Are We There Yet?
 By
By
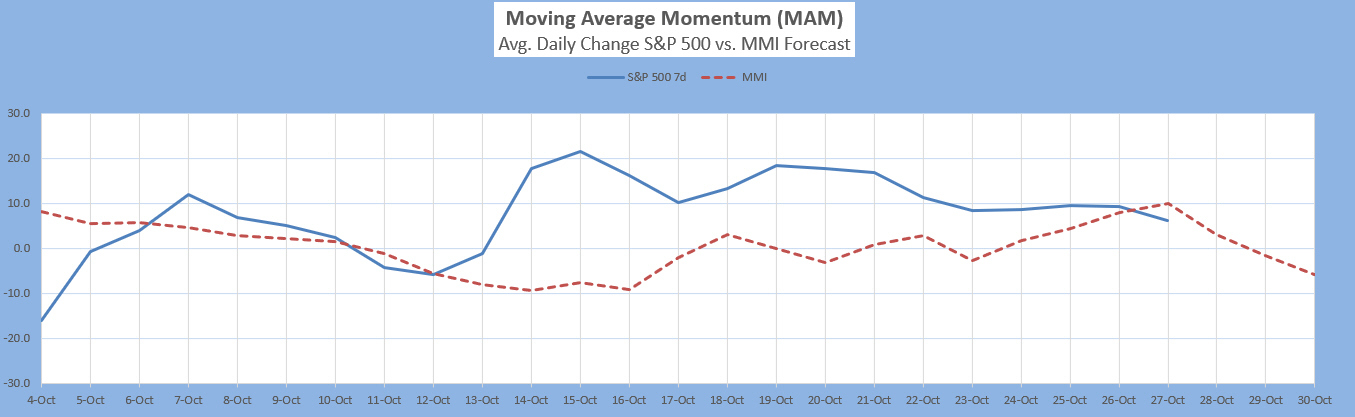
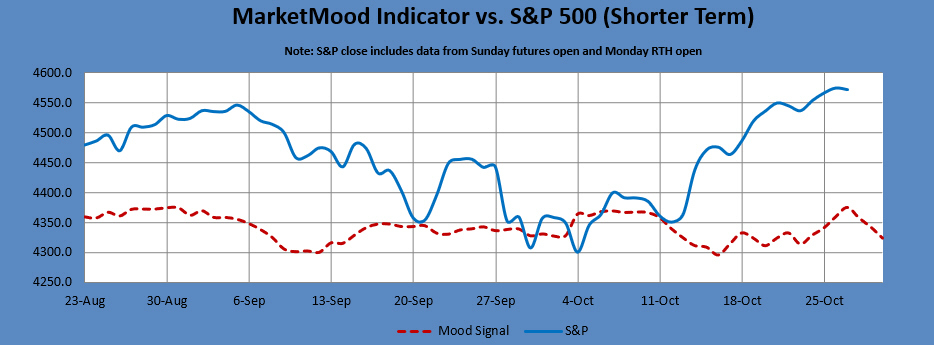
Is the market in process of a short term direction change? Our Moving Average Momentum (MAM) indicator signaled a significant local high is likely between today and 3 November. The MarketMood Indicator's (MMI) Daily signal is up today, then down tomorrow. Our CDMS trade signal is Buy today and Sell tomorrow.
MMI for Friday is same as Thursday closes. CDMS will be a Sell for Friday if Thursday closes down, otherwise a No Trade. The charts posted here assume a down close Thursday and down MMI Friday.
Zooming out, Long Term Trend Indicator remains bullish and the intermediate term gauges of MM Trend Trader remains full on bullish. A break below the bull / bear trend line would imply the beginning of a temporary sell-off which may or may not be sizeable, but likely short-lived.
Latest charts follow the summary table. For more detailed info see this evening's full report:
MM Indicators and Trading Parameters Summary:
| Indicator | Scope | Direction |
| LTTI | Longer Term Trend | Bullish |
| MMTT (main) | Medium Term Trend | Bullish |
| MMTT (HP) | Medium Term Trend | Bullish |
| MMTT (b/b) | Near Term bull/bear Trend Line | 4547 SPX (cash) |
| MM MACD | Swing Trade | Neutral |
| CDMS** | Today Close to Next Trade Day Close | Sell |
Note: Medium term is roughly 1 week to 2 months. Longer term is roughly 1 month to a year or more.
**Composite Daily Mood Signal (CDMS) combines the MMI daily signal and the various MM trend and trading indicators into one overall daily trade signal. Possible signals are buy, strong buy, no trade, sell, and strong sell.