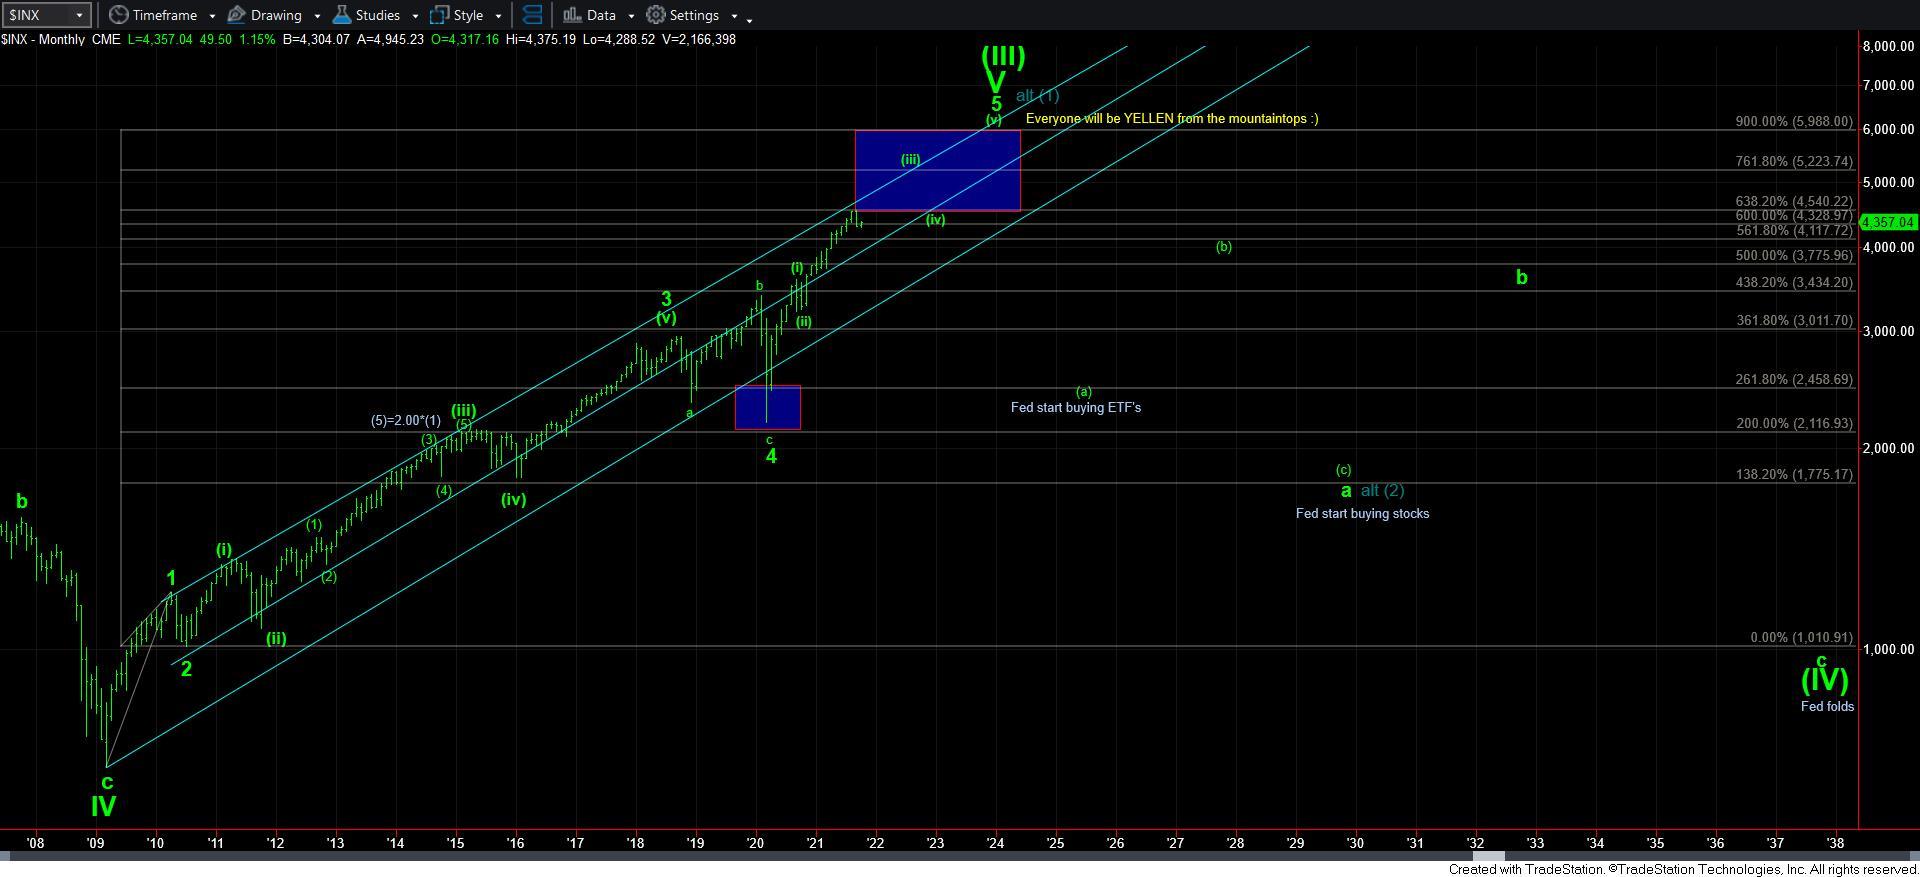
Are We There Yet?
As we came into 2021, the market was in the 3750SPX region. And, if you remember, I was suggesting that 2021 would look like 2017, wherein we continue the rally we saw the prior year. Therefore, I outlined my expectation for the market to see at least a 20% rally, which we clearly met and exceeded.
Moreover, I had set a target for wave 3 of [3] between the 4440-4600SPX region. Based upon our Fibonacci Pinball perspective, the market targets the 1.00-1.236 extensions of waves [1][2] for wave 3 of [3], and those extensions were 4440-4600SPX. As we now know, the market topped in the 4550 region (based upon the high in the futures). And, since that time, we have clearly been in the corrective wave 4 pullback I had been expecting.
So, let’s analyze what we want to see in a wave 4 pullback, and what we want to see to provide initial indications that wave 4 is done, and that wave 5 has indeed begun to take us to our next ideal target in the 4900-5000SPX region.
As far as expectations for wave 4, we again look towards our Fibonacci Pinball perspective. While wave 3 of [3] targets the 1.00-1.236 extensions of waves [1][2], wave 4 often finds support between the .618-.764 extensions of waves [1][2]. In our case, that is the 4165-4270SPX region. Moreover, the .382 retracement of wave 3 is often a common target for wave 4, which also resides within the region of the .764 extension in the 4270SPX region.
This past week, the overnight futures action struck the 4270SPX region, whereas the low in the cash market was struck on Friday in the 4288SPX region. So, of course, we are all now questioning whether wave 4 is done.
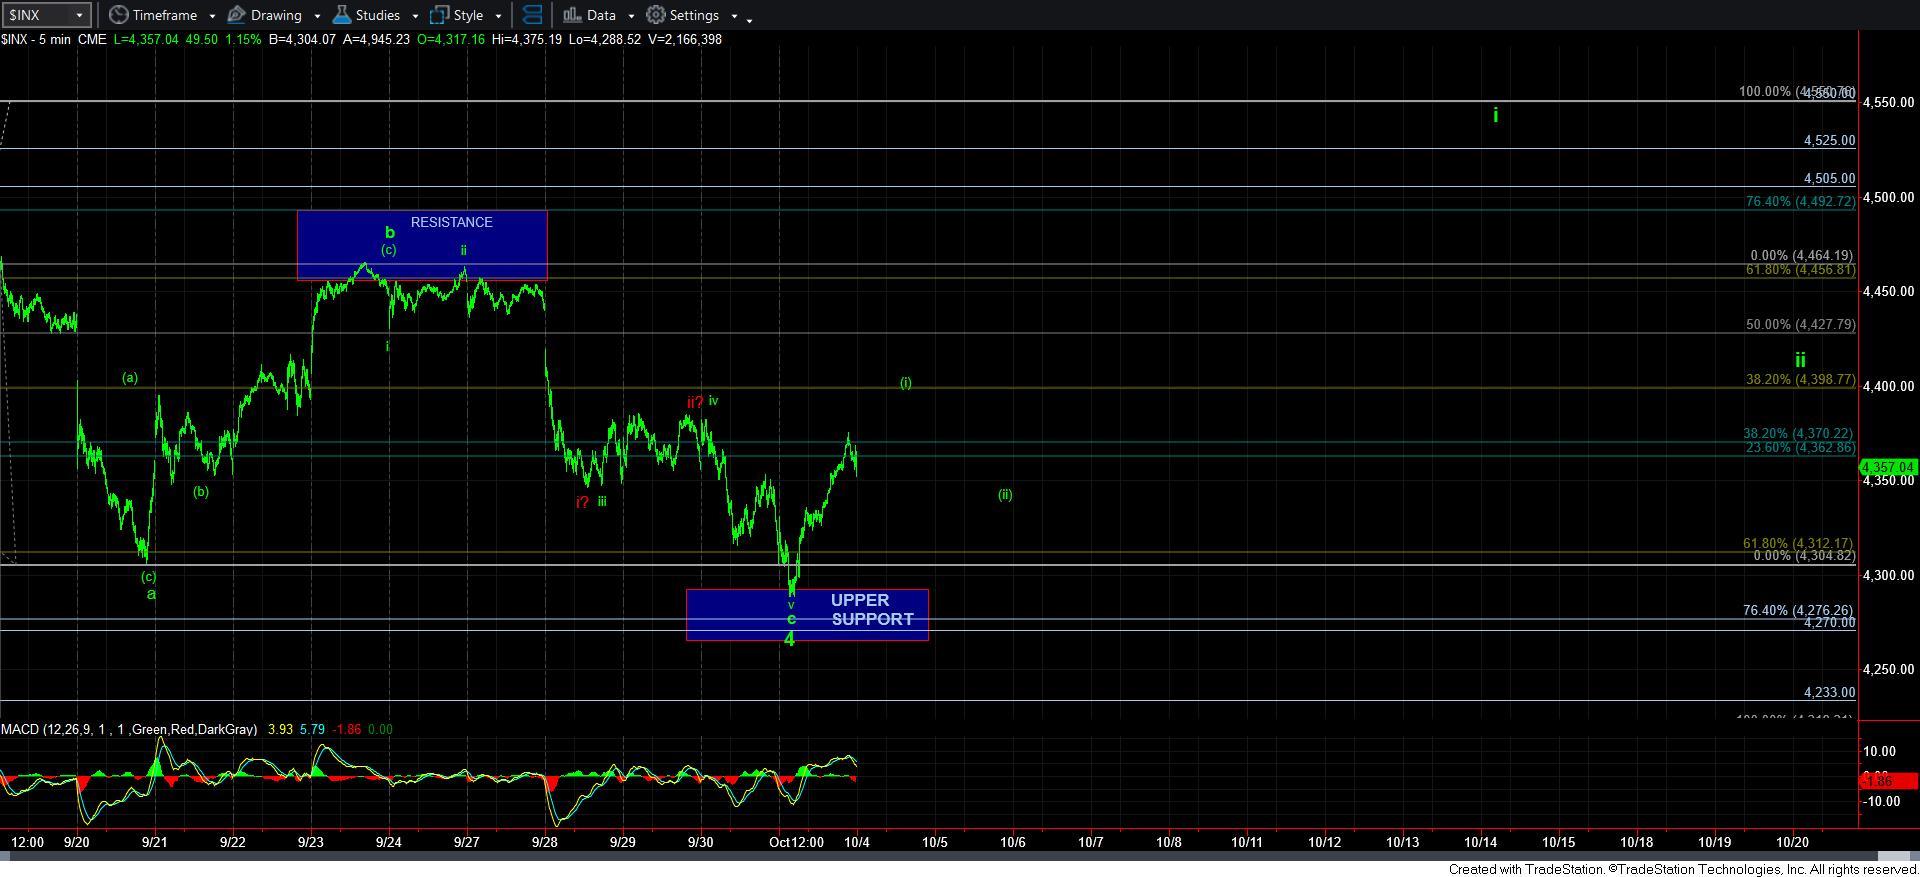
Well, one of the other factors we look towards in being able to identify a completed wave 4 is that we often see the c-wave of the a-b-c 4th wave structure complete a 5-wave structure. While I can clearly see a 5-wave structure having completed in the SPX, I cannot say that the futures are anywhere nearly as clear. So, this does leave me with questions as to whether wave 4 has indeed completed.
So, we move towards the next clues to provide us initial confirmation that wave 4 has indeed completed. We need to see a 5-wave rally off the lows, followed by a corrective pullback, and then a rally over the high of the initial 5-wave structure. And, while the market rallied strongly off support on Friday, I cannot yet say that I have seen a clearly completed 5-wave rally just yet.
Therefore, I will need to see the market head higher on Monday in order to complete a 5-wave rally off the lows, which would then potentially provide us with wave [i] of i of 5 of [3]. While I know this may sound a bit difficult to our newer members, let’s pull this apart and take a moment to explain it.
Since the market is fractal in nature, it means that structures are variably self-similar at all degrees of trend. In other words, during an impulsive structure, each impulsive wave degree within the primary trend should contain 5-waves. In other words, the first, third and fifth waves of a 5-wave structure should all break down into 5-waves themselves.
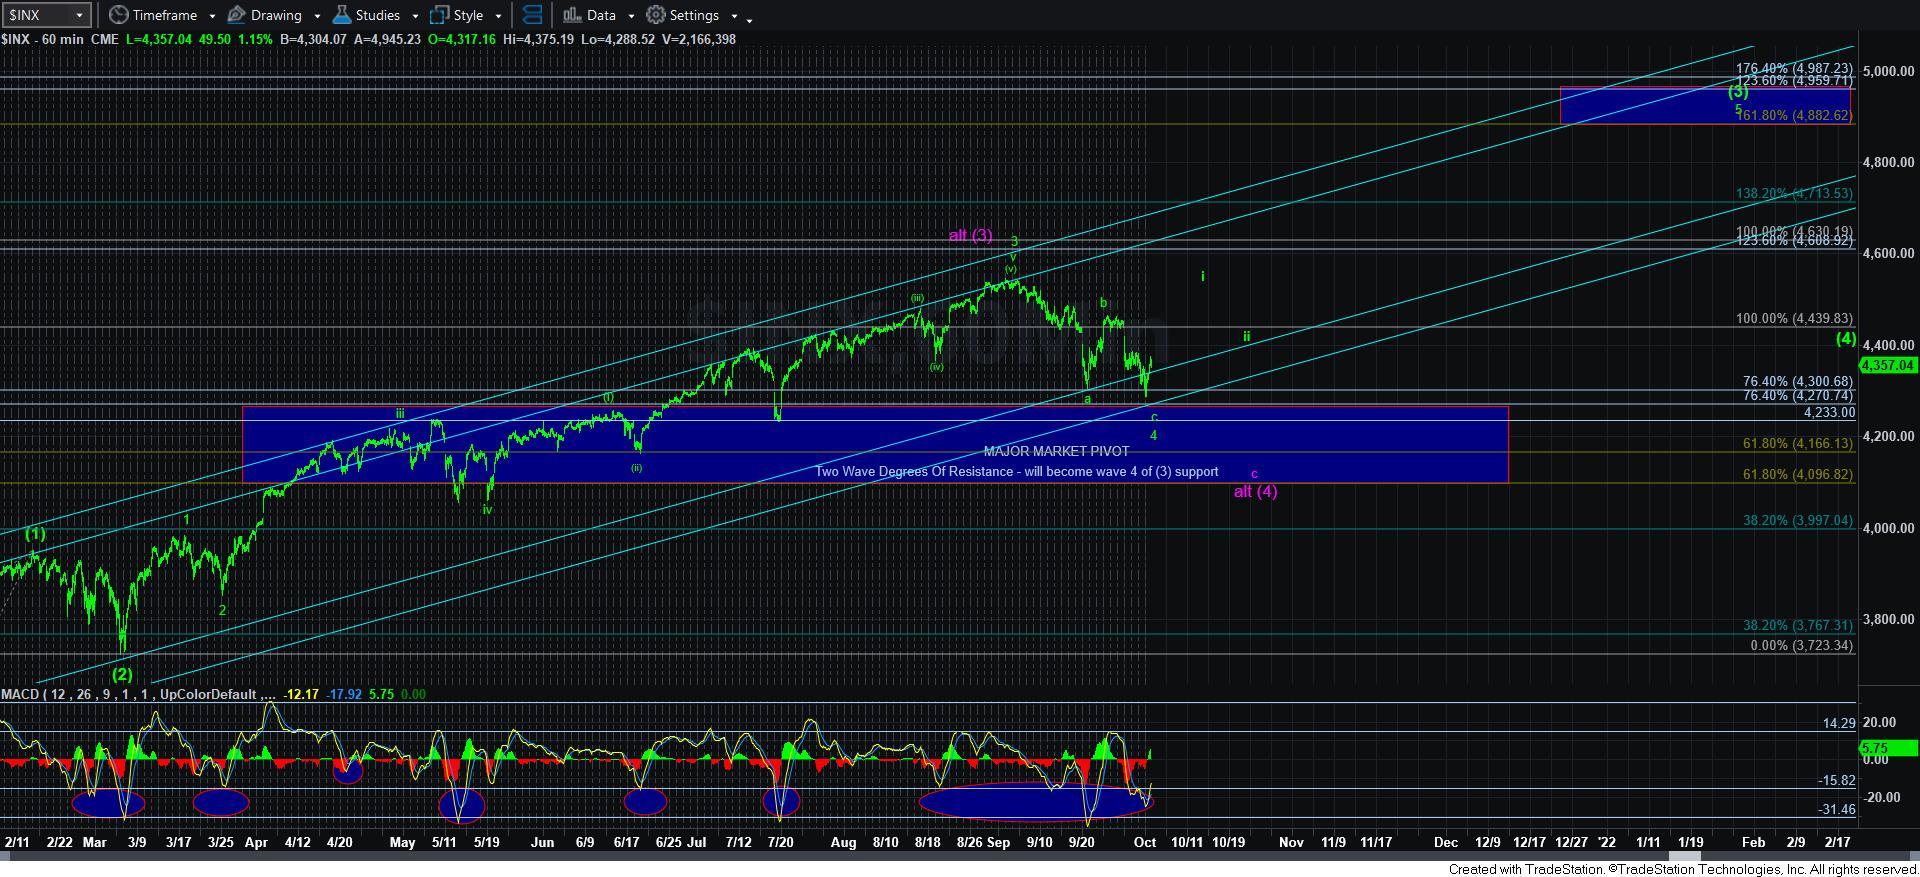
Therefore, if we are in wave 5 of wave [3] (which can be seen on the 60-minute SPX chart), then wave 5 must be comprised of 5-waves. That means that wave 5 will be counted using waves i-v. Moreover, since wave i also should be 5-waves, it will be comprised of waves [i]-[v]. So, as it stands right now, I am looking to see if we can complete wave [i] of i of 5 of [3].
But, simply seeing 5-waves is not really enough. You see, in order to have a much higher degree of confidence in any structure, all degrees of trend should fit together within the other degrees of trend like a neat mathematical puzzle. This means that wave i of 5 should take us back up towards the prior market highs in order to set up a i-ii structure that projects the 2.00 extension of our Fibonacci Pinball structure which aligns with the next higher wave degree target. And, if we do see a wave i of 5 topping out in the region of the prior market highs, then we can develop a i-ii structure that projects a 2.00 extension in the 4900SPX target region which aligns with the standard targets we normally see for wave 5 of [3] in the next larger wave degree.
To take this to the next step, it means that waves [i] and [ii] off the lows should also provide us with a large enough structure that can project up to the prior highs to compete an appropriate i-ii structure. And, if we can continue higher on Monday to complete what may be a 5-wave rally off the recent lows, then we have a large enough structure for a [i][ii] set up which will point us up towards the prior highs to complete an appropriate i-ii structure, which will, in turn, point us up towards our next major target in the 4900SPX region. So, this would fill in all the pieces of the puzzle to point us up towards our next major target in the 4900/5000SPX region.
The reason I am explaining this in depth is because I remember that trying to understand how to apply the fractal nature of the market within an analysis methodology was one of the most complex aspects of Elliott Wave analysis. Understanding the waves within the waves is clearly not easy. But, it is one of the most important aspects of Elliott Wave analysis if you want to generate high probability expectations. And, this is what sets apart a good Elliott Wave analysts from the charlatans and the amateurs who give Elliott Wave analysis a bad name due to the lack of their focus on these details. Everything should fit rather neatly together in order to generate a higher probability expectation.
I have also been trying to outline the risk/reward perspective as we have been heading down to our target for wave 4. As we were approaching the 4270SPX region, I was outlining that we had approximately 100-150 points of downside risk, whereas the upside potential exceeds 600 points. For long term investors, you recognize that as a buying opportunity in the market. But, with most buying opportunities, one usually layers into positions as we approach a support region. This has been the perspective I have been trying to outline to members.
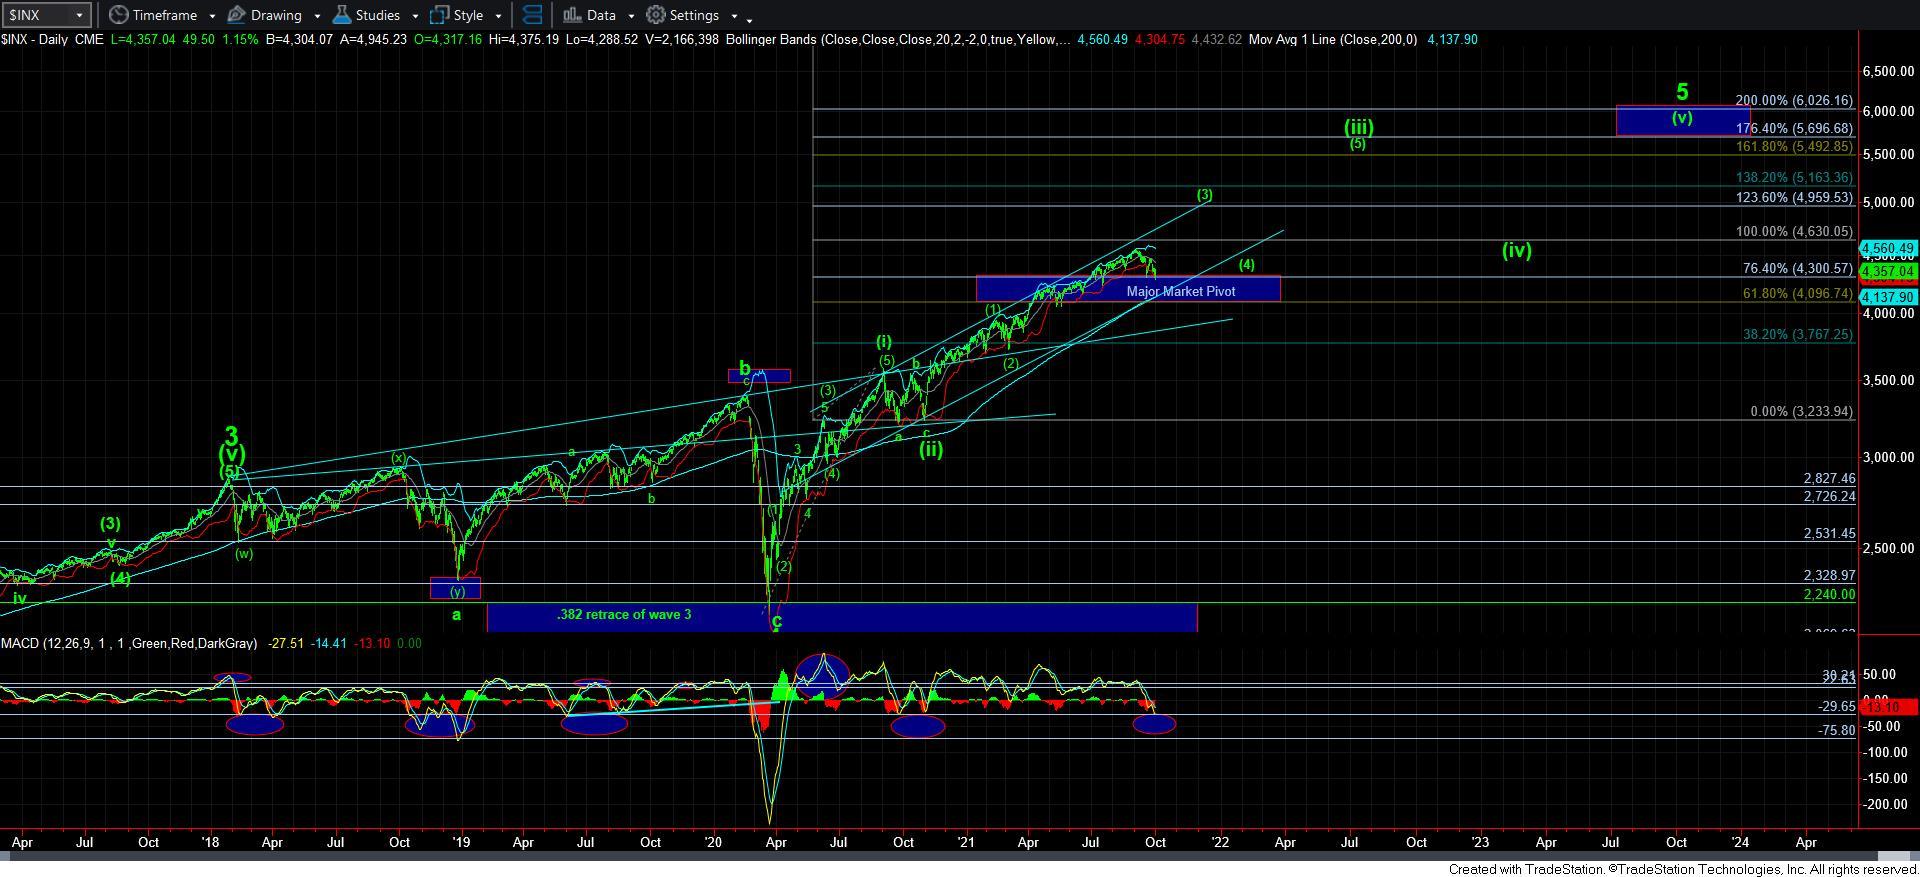
One of the other market indications which suggest we are approaching a major low in the market is represented by the technicals on the various charts. You have all seen how the market provides us with sizeable rallies when it hits the MACD oversold region on our 60-minute chart. Well, consider that we are now hitting the equivalent levels on the daily timeframe. If we look at the daily SPX chart, you will see that the MACD is just as oversold as we saw back in the fall of 2020, when we were completing wave [ii]. And, that level of oversold condition provided enough upside room to support the 1300-point rally which we saw from the fall of 2020 until we recently struck 4550 in 2021. My expectation is that we can see a 600-point rally from this oversold condition to our next target region in the 4900-5000SPX region. And, based upon historical perspectives of the MACD, I think this to be quite a reasonable expectation.
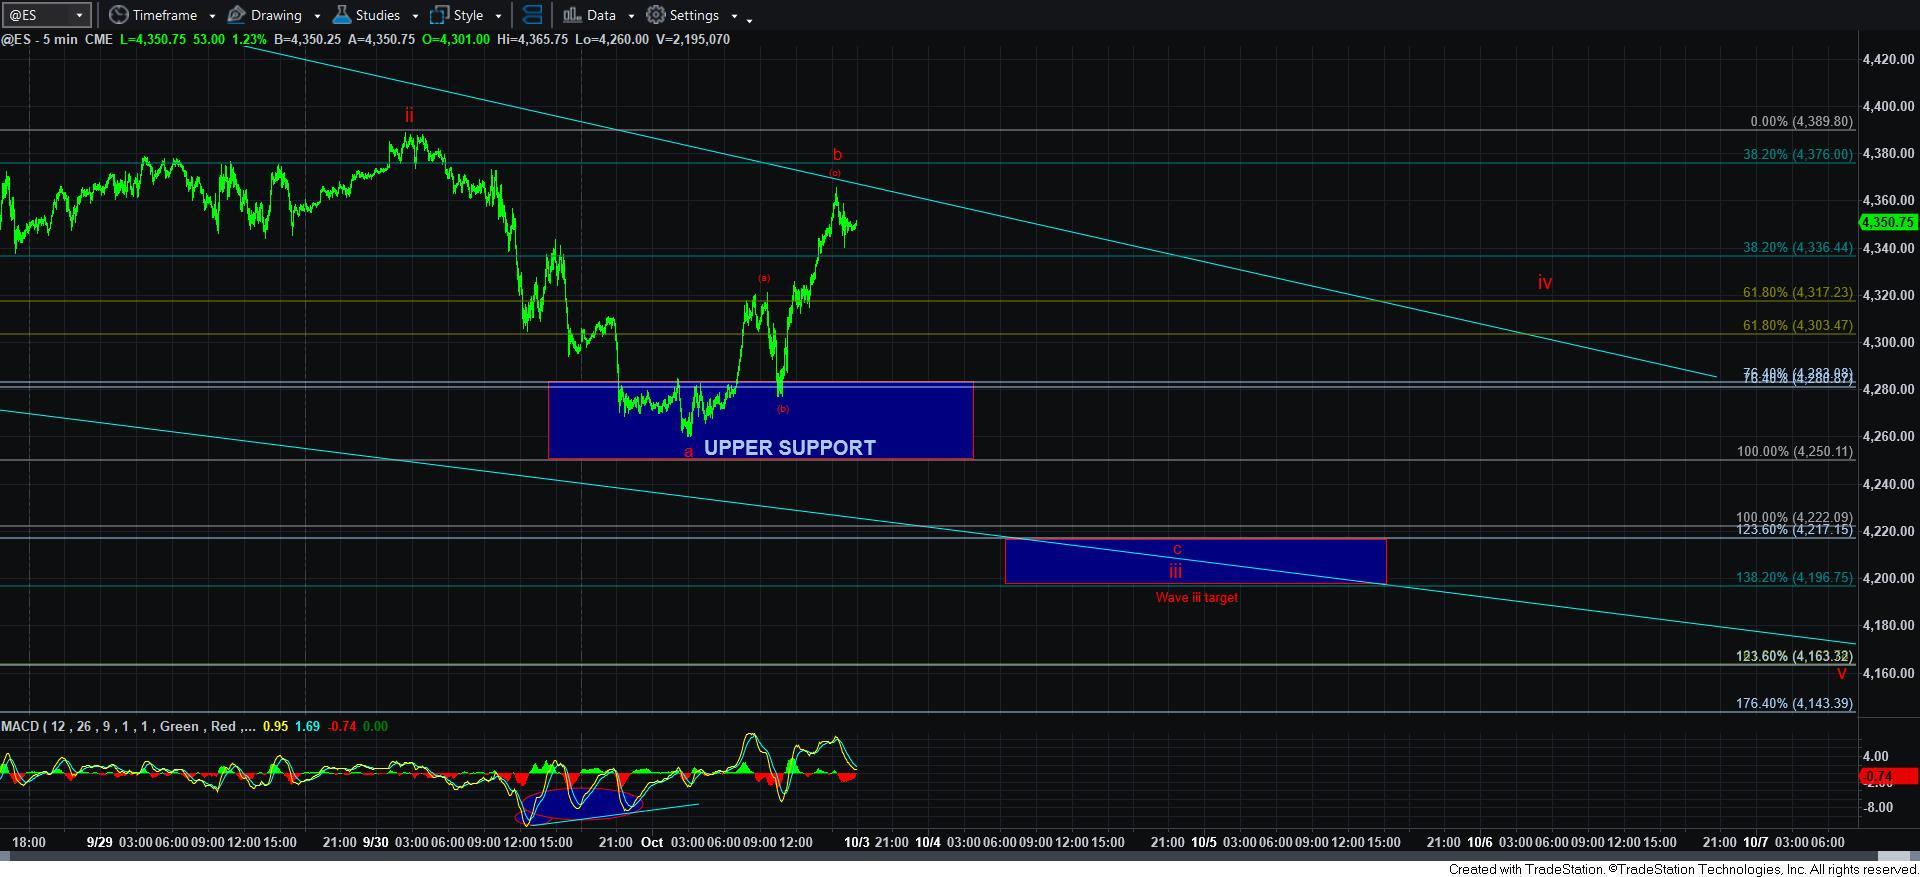
Now, of course, we still have not seen the 5-wave rally complete off our support level. Therefore, there still exists potential for the market to extend lower to the 4165SPX region, which is the lower end of our target zone for this wave 4. Therefore, if the market breaks down on Monday (instead of continuing higher to complete wave [i]), and we continue down to see a sustained break down below 4310ES, then it is likely we are still within a bigger ending diagonal structure for this c-wave of 4, which I have outlined on the 5-minute ES chart. This would keep us within wave iii within that ending diagonal structure, and we would then be completing the c-wave of wave iii.
For those that are asking me why I am counting this 5-wave c-wave structure with a-b-c’s after I outlined above that the impulsive waves should be counted with 5-wave sub-structures, well, the one pattern which counts as 3-wave sub-structures within a 5-wave structure is the ending diagonal. And, the only reasonable way to view us as going lower right now is with this overlapping ending diagonal structure. It is the one structure which is the exception to the standard 5-wave sub-structure rule. And, diagonals are only seen as leading diagonals in the first wave position, and as an ending diagonal as a 5th wave or c-wave position.
Whereas a standard Fibonacci Pinball structure sees the 3rd wave as targeting the 1.382-1.618 extensions of the first and second waves, an ending diagonal often sees its 3rd wave target the 1.236 to the 1.382 extensions of the first and second waves. Hence, you can see my target box for wave iii on the 5-minute ES chart. Thereafter, I would expect a sizeable rally for wave iv, as it often overlaps with the bottom of wave i. The 5th wave within this ending diagonal will likely challenge the lower end of our wave 4 support in the 4165SPX region, which would likely also test the 200DMA, which has now risen into our MAJOR MARKET PIVOT.
In summary, I still have questions as to whether wave 4 has indeed completed. There is strong evidence which suggests that we should expect a major rally from this region. But, I am still unsure if we have a bit lower to go before we begin that next rally I expect.
Therefore, I am going to need to see a 5-wave rally complete on Monday to complete wave [i] of i of 5 of [3]. Thereafter, I will need to see a corrective 3-wave pullback for wave [ii], followed by a rally over the high of wave [i] to suggest we are rallying in wave [iii] of i of 5 of [3]. Breaking back out over the high of wave [i] will provide us with strong evidence that wave 4 is done, and we have begun wave i of 5 of [3].
Lastly, for those that may develop a fear of missing out on that next rally, please remember that we likely have 500-600 points higher to still see in the market for wave 5 of [3]. There will be other buying opportunities to glean the great majority of that upside potential if you are not layering into long positions down here. In fact, keep in mind that even if we do complete a 5-wave rally back up towards the market highs, a wave ii pullback will likely take us back into the 4400SPX region for another buying opportunity.
Moreover, there are many stocks which are still completing major bottoming structures, as outlined by our StockWaves analysts. And, there are plenty of opportunities being presented in those charts.
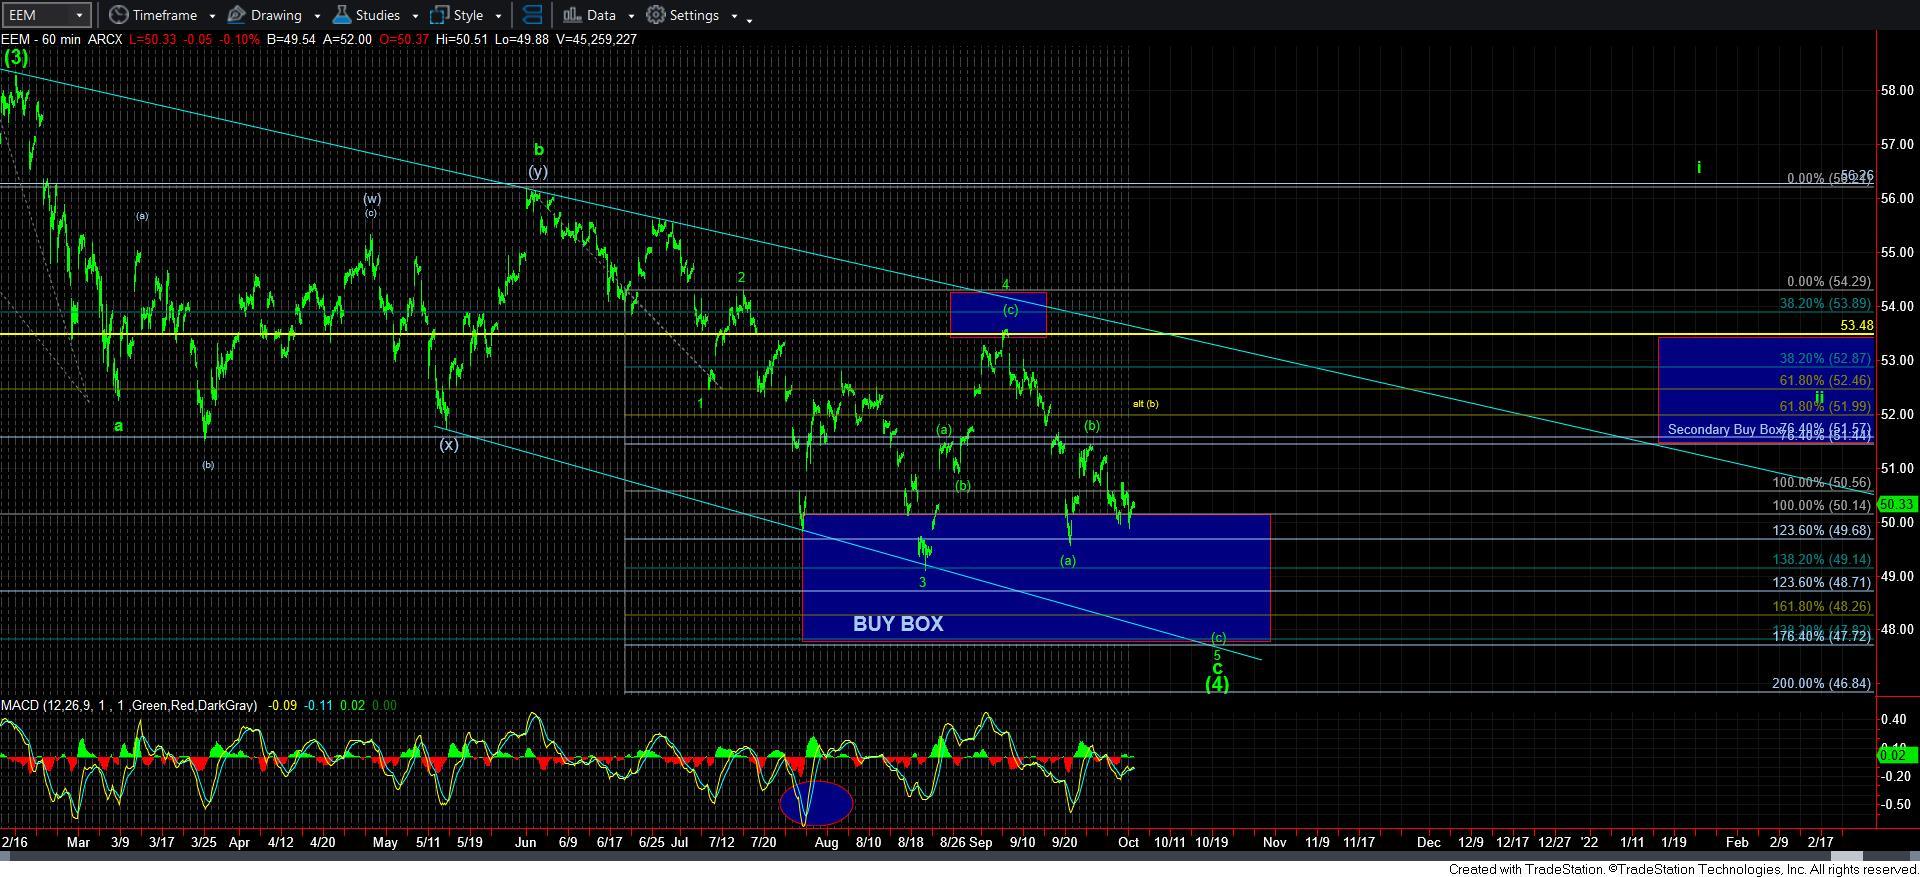
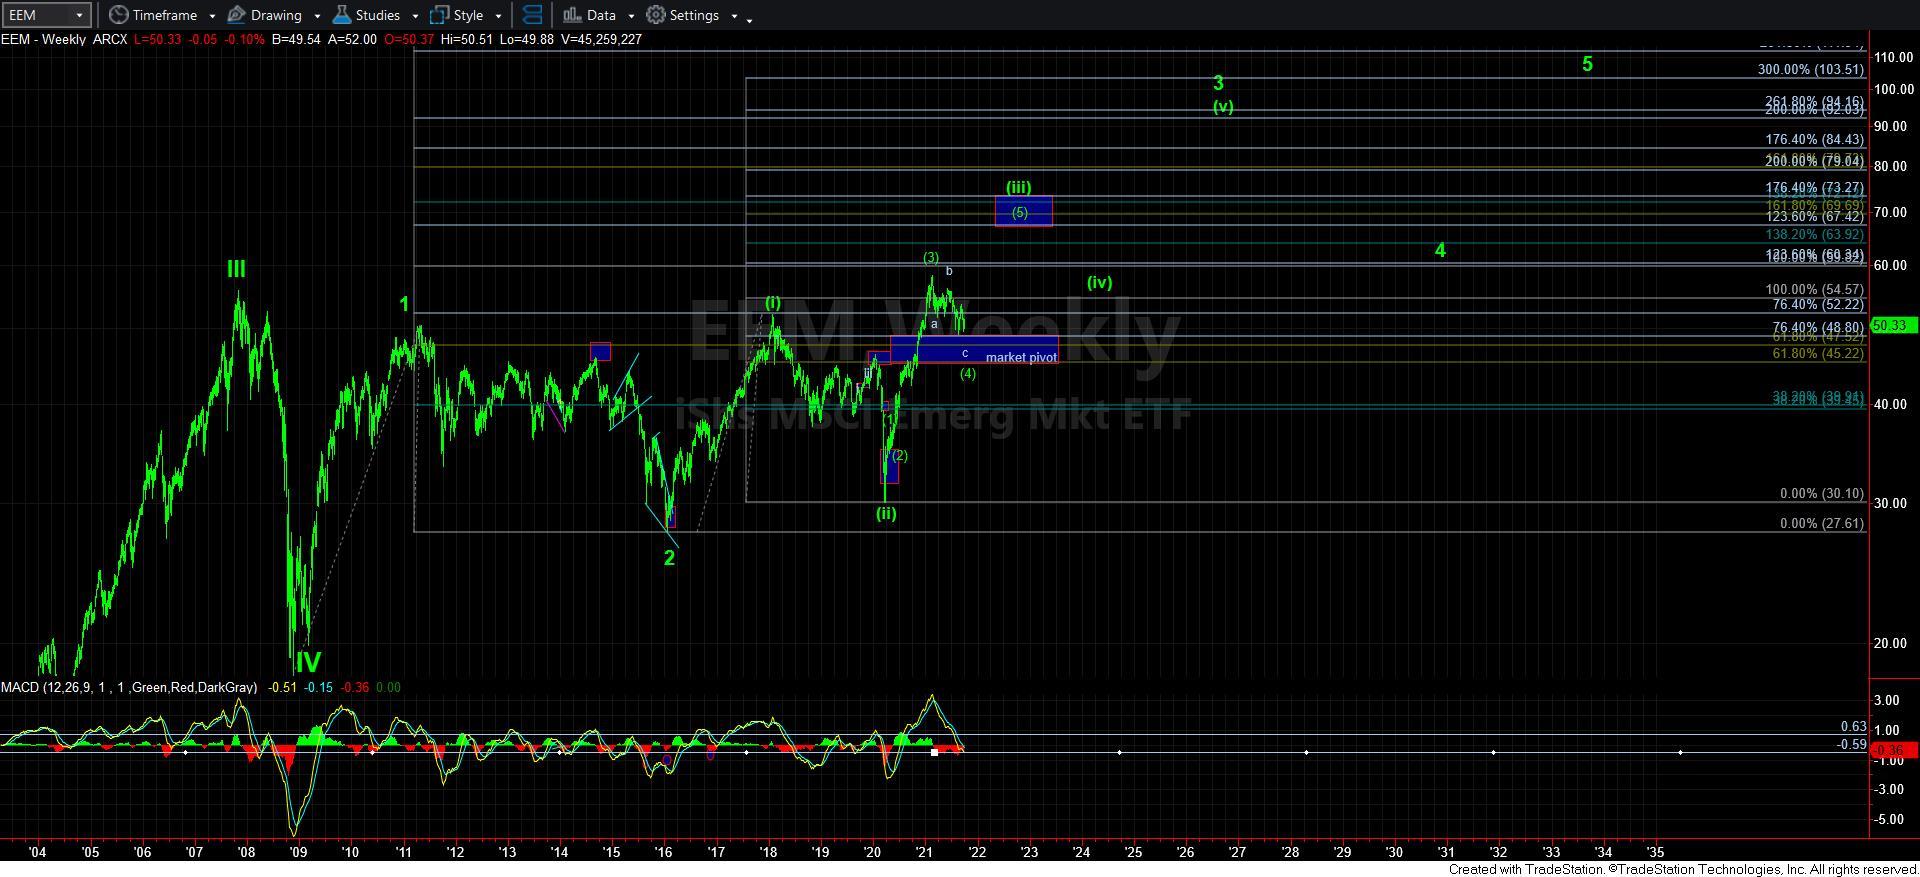
Finally, there is still one chart I am personally stalking for a lower low, and, as many of you know if you have been following me closely, that is the EEM chart. While it is certainly “possible” that the market has found a bottom in the EEM in its wave [4], that would only be with a very rare and unorthodox bottoming pattern. But, keep in mind that I have outlined this BUY BOX on EEM for a reason. If you look at the bigger perspective, we are in a major market pivot for wave [4] in the EEM, which suggests we are also setting up to rally in another major rally after a 6+ month long pullback. While I am leaving some cash on hand to buy my ideal target for a [c] wave of wave 5 of the bigger c-wave of [4] (yes, this c-wave is taking shape as an ending diagonal), I have been layering into my positions in EEM in the expectation of a rally to my next target on the weekly chart. And, my stops are being set at just below the pivot on that chart.