Are Metals About To Whipsaw or Waterfall?
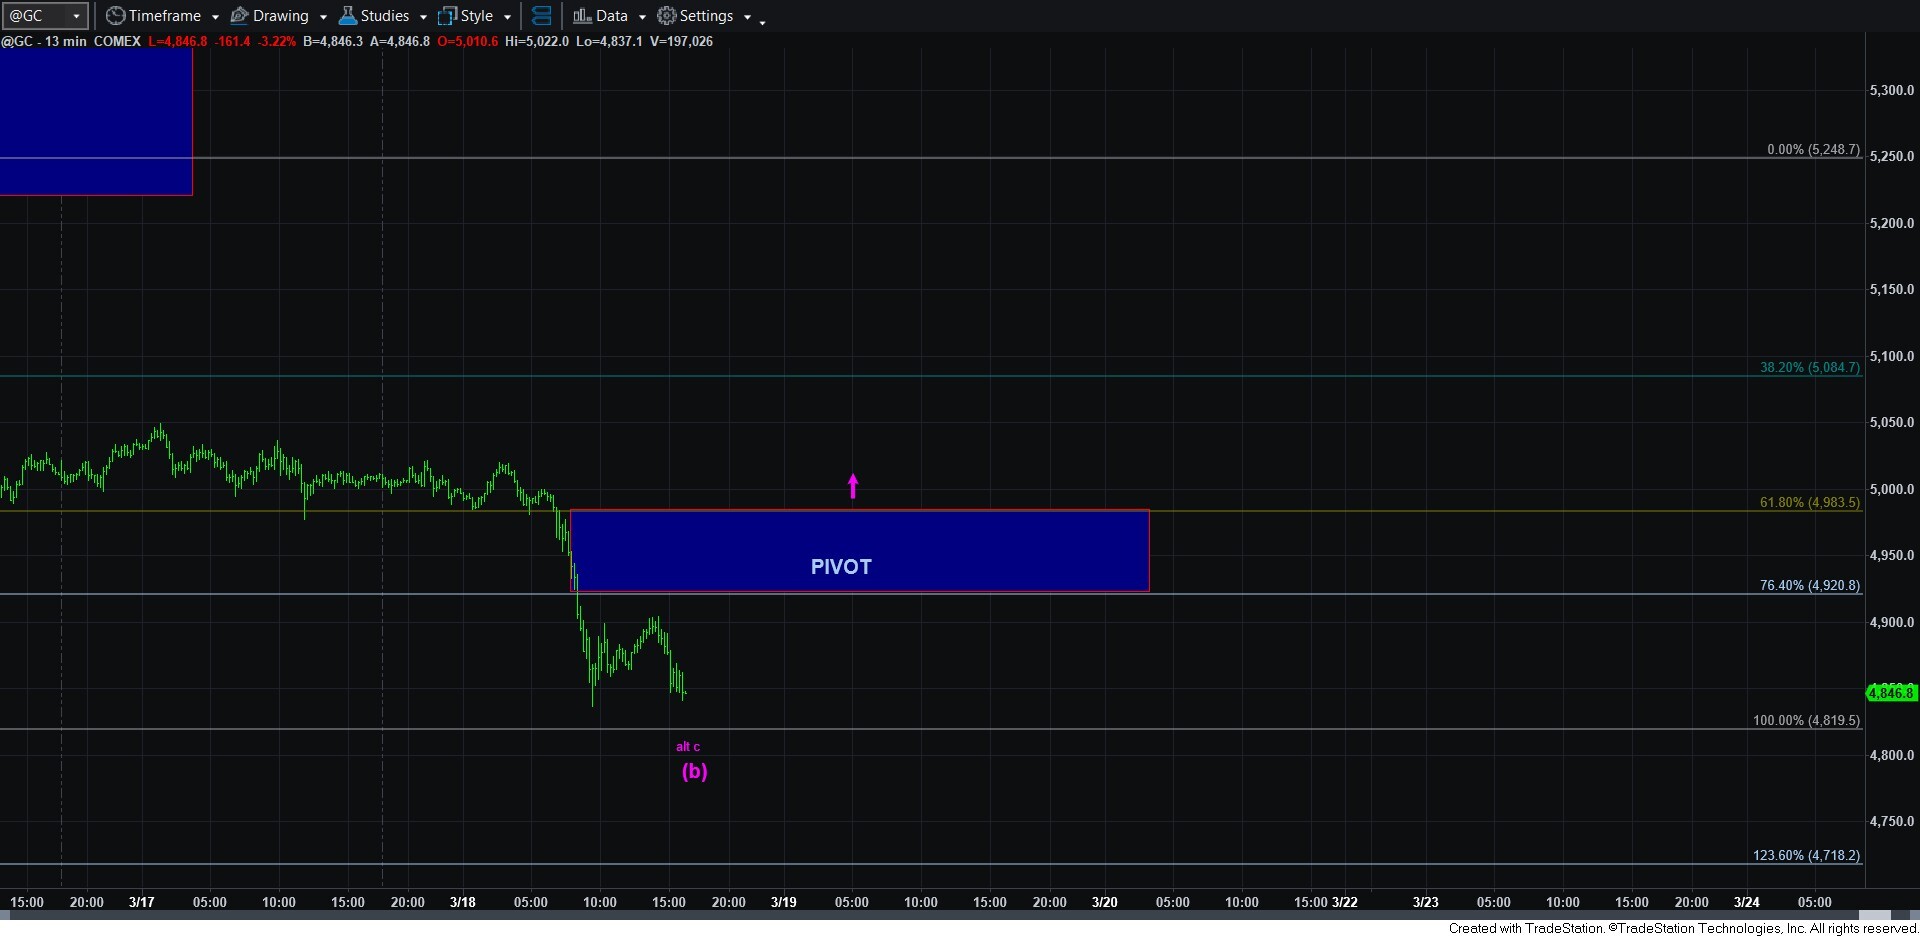
As I outlined over the weekend, gold was the clearest of the charts of late. And, I also noted that should we see a sustained break of the 5000 region, then we are likely next heading to the 4800 region which will be a VERY important point for the market.
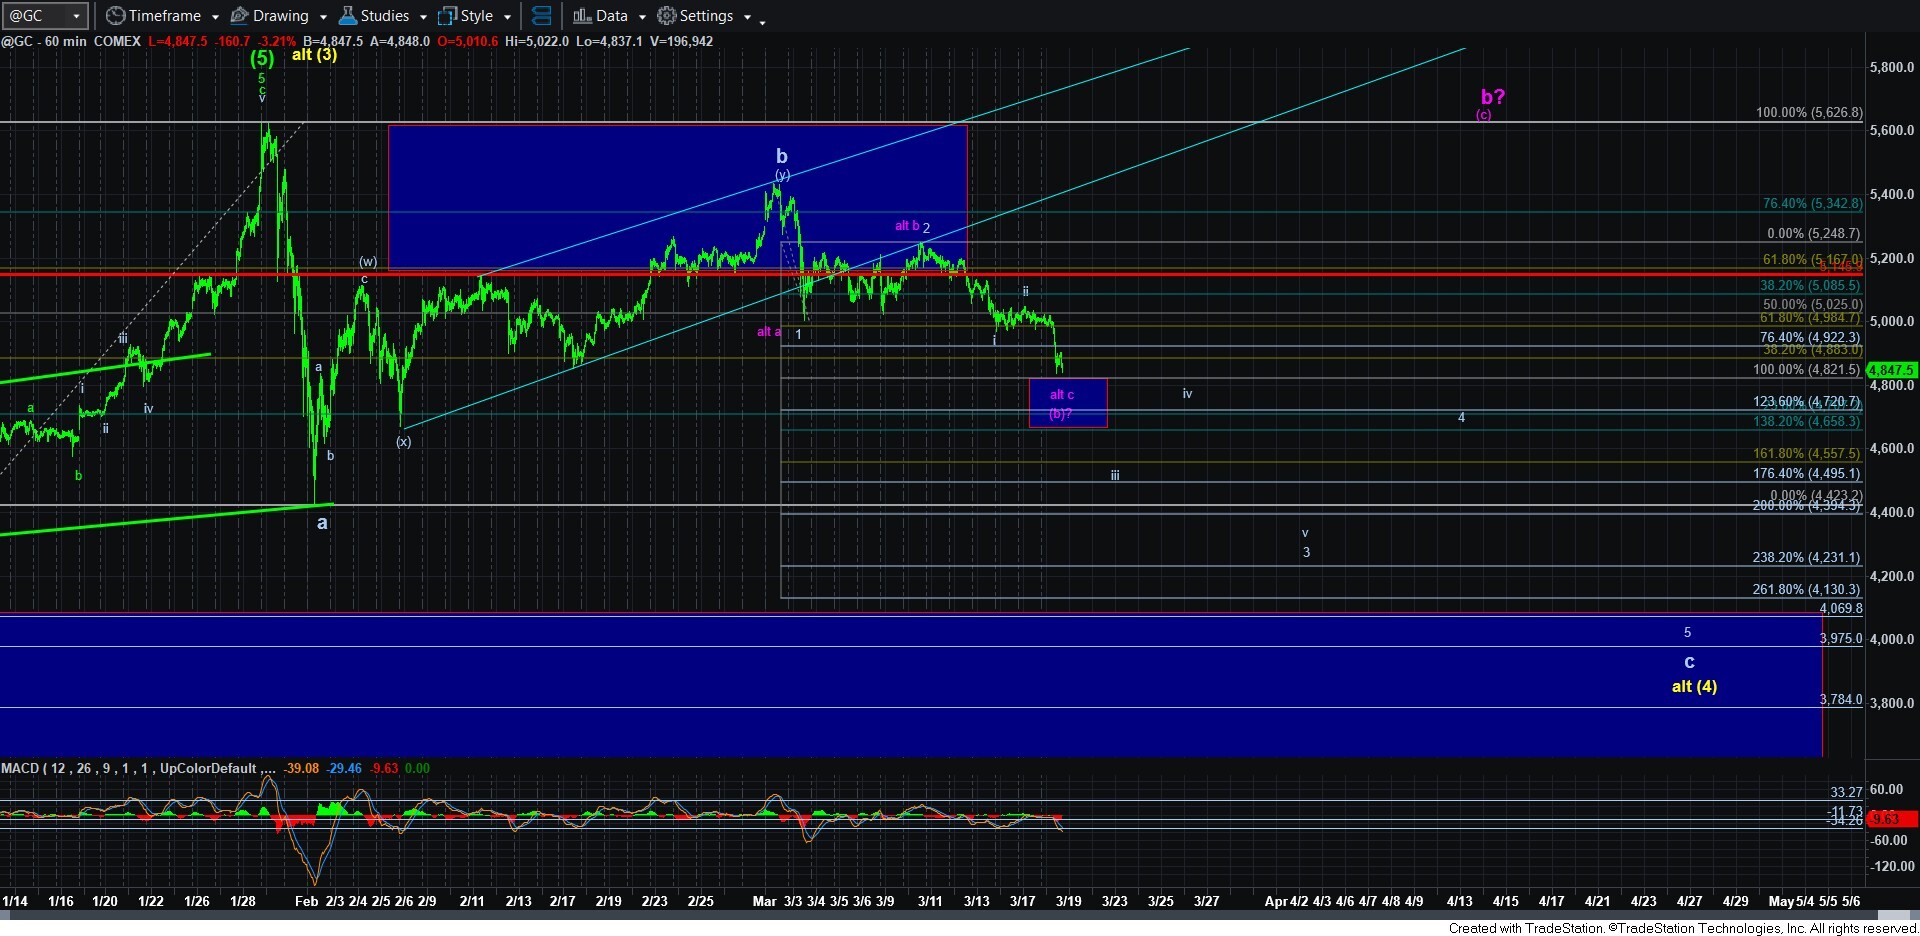
To explain again, thus far, we have dropped down to the 1.00 extension (4800 region) off the 1-2 downside set up we have been tracking. Normally, when the market bottoms at the 1.00 extension and begins an impulsive rally back up through the .618 extension (4983.50), it tells us that the market is not going to follow through on the downside set up, and that the decline was really a corrective a-b-c pullback. In our case, that would be the (b) wave in purple. And, should we rally back up through the .618 extension in impulsive fashion from this support, then we are likely heading back to the prior high (and may even exceed the prior all-time highs as the (a)=(c) from this point is over that level).
But, that is a tall order at this time. If the market only bounces correctively from this point forth, then pressure will remain down in a big way, and we should slice through the (b) wave support box noted on the 60-minute gold chart. That would indicate that we are clearly in wave iii of 3, and we are likely pointing down towards the 4000 region in the bigger a-b-c structure.
So, clearly, we are at a VERY important juncture in the gold chart.
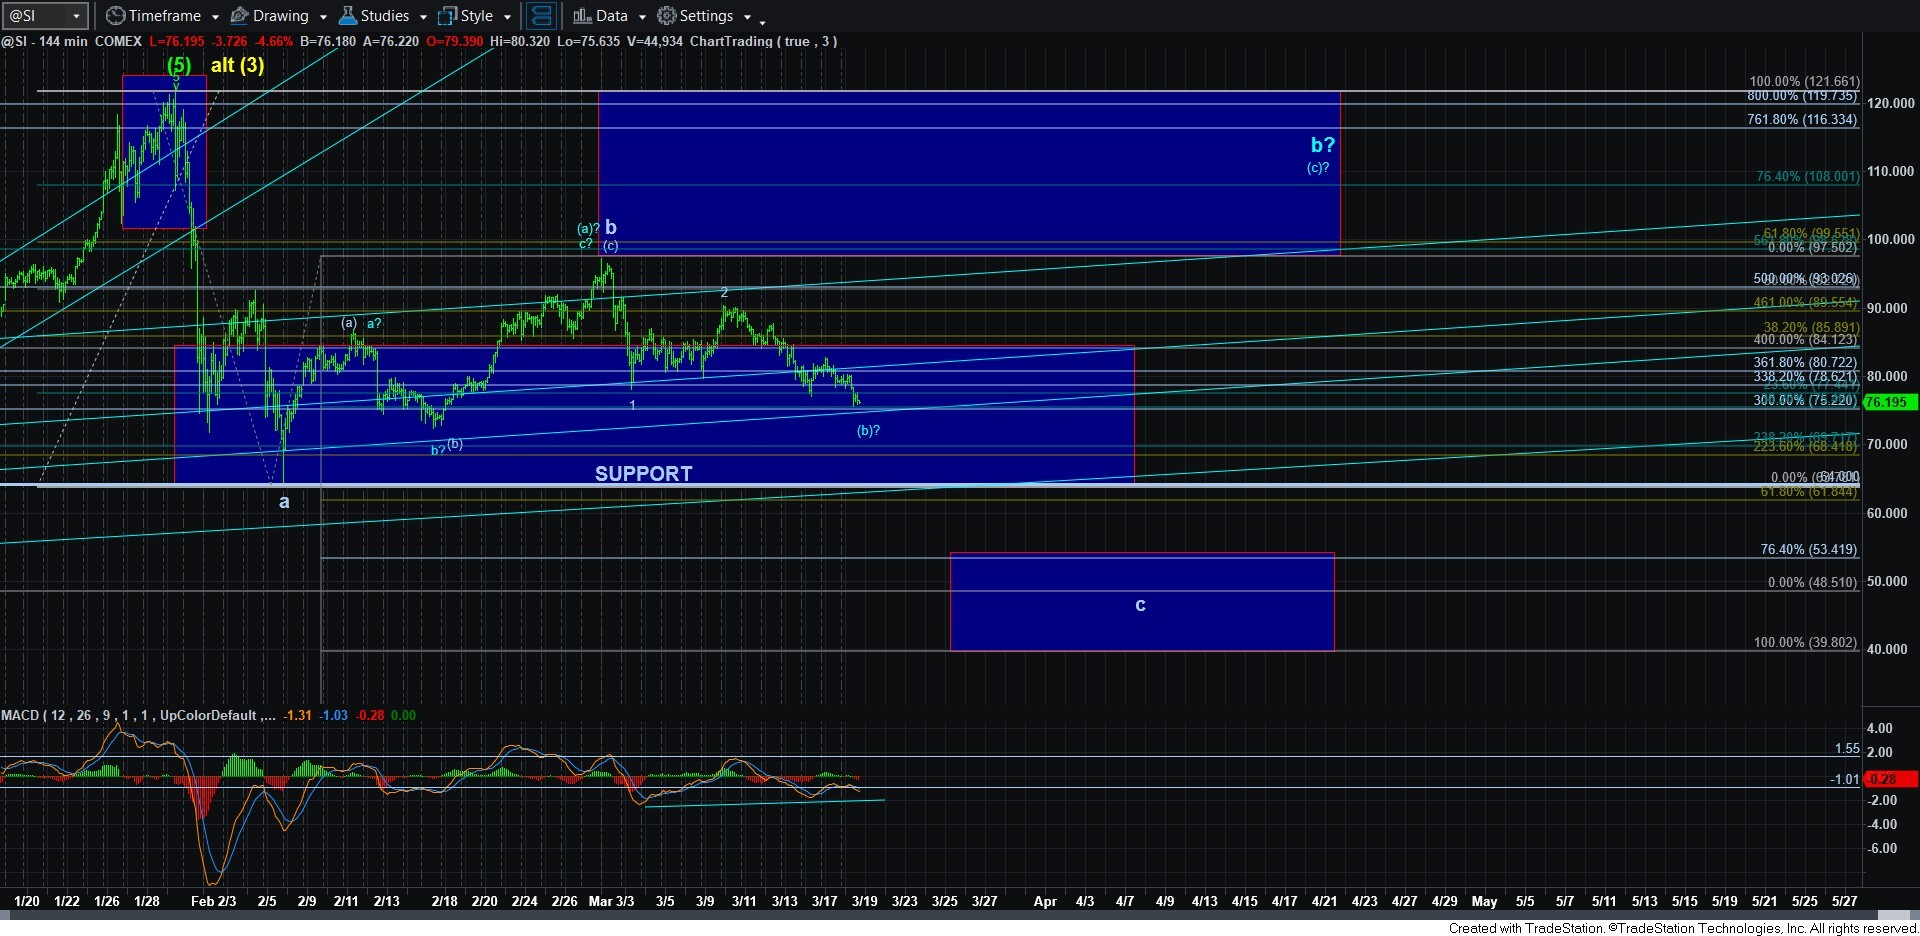
This now brings me to the silver chart. The big issue I see at this time is that the 144-minute MACD is holding a positive divergence set up. That provides some evidence for the blue (b) wave. But, of course, that divergence can break. Yet, it still does not help with the smaller degree wave count in silver as it is really unclear. So, I cannot provide any specific smaller degree guidance. Yet, as with gold, should we see an impulsive rally begin in the near term, then we have to assume the blue (b) wave has bottomed and the blue (c) wave has likely begun.
Should the market follow the blue count, then unlike gold, it is not projecting beyond the .764 retracement of the a-wave, which is where we would see an (a)=(c) target right at the .764 retracement in the 108 region.
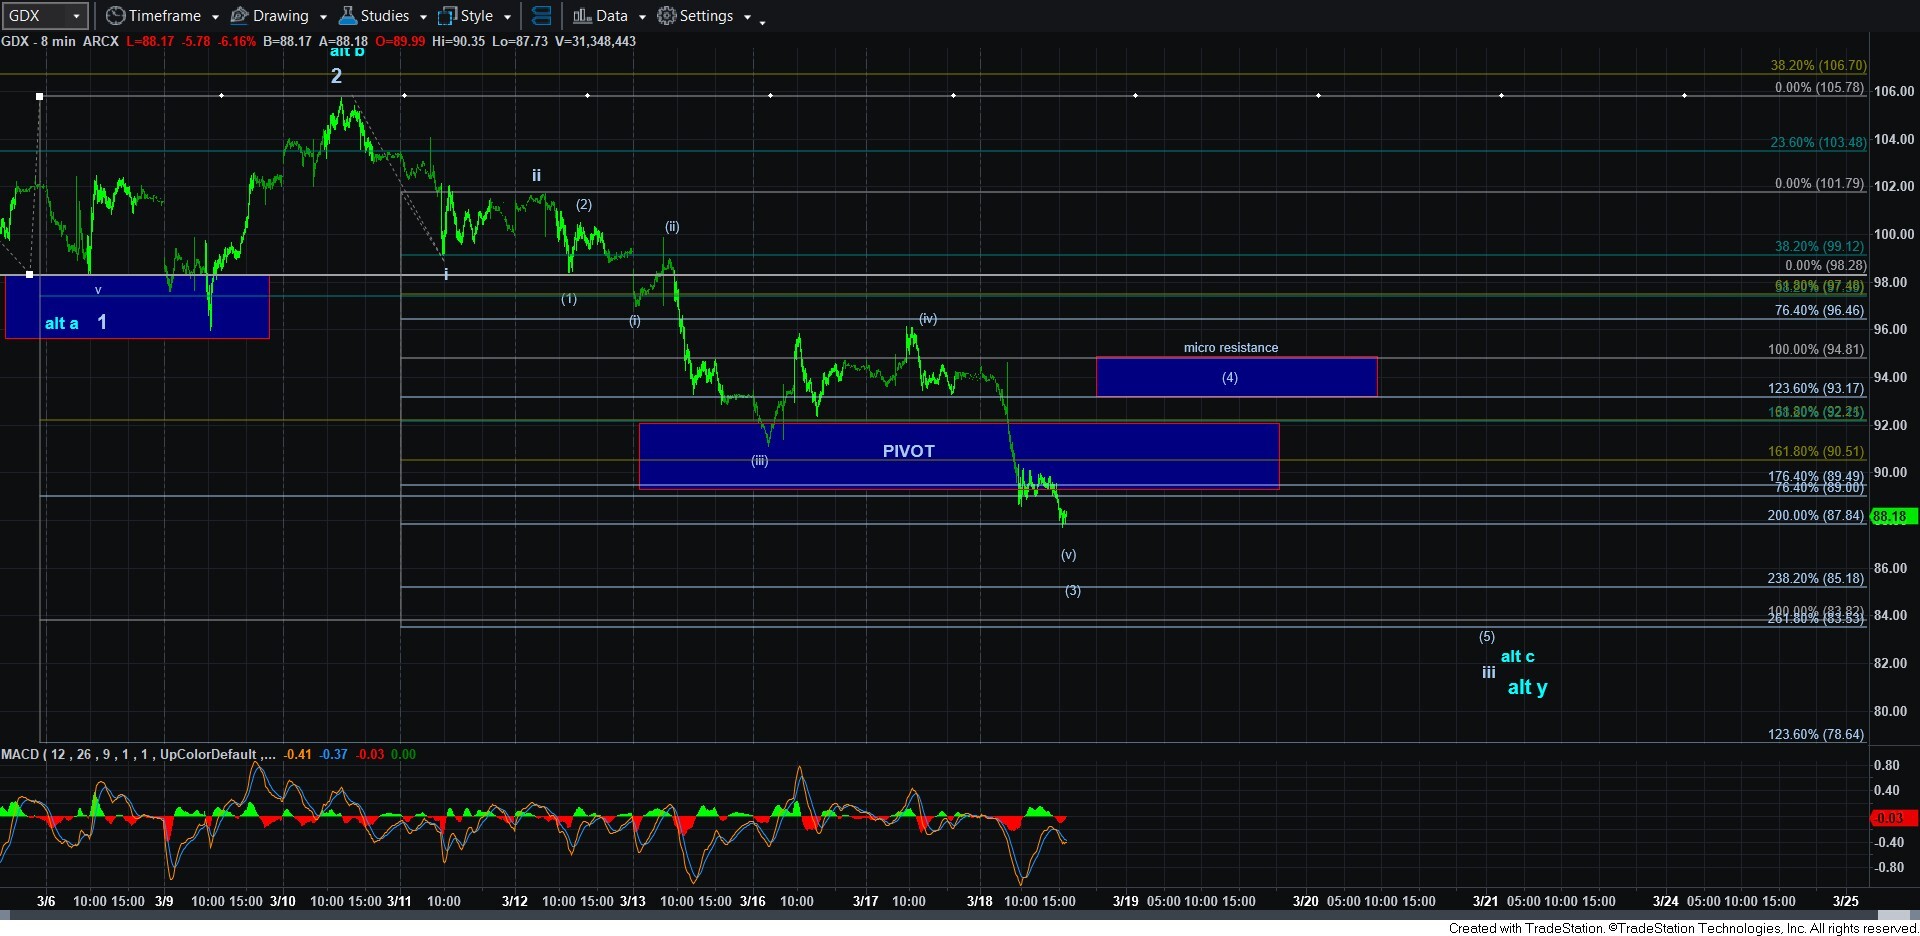
As far as GDX, it gave us a strong indication of the action we saw today, and I outlined that potential towards the end of the trading day yesterday, as we had a micro 1-2 structure pointing to this decline today.
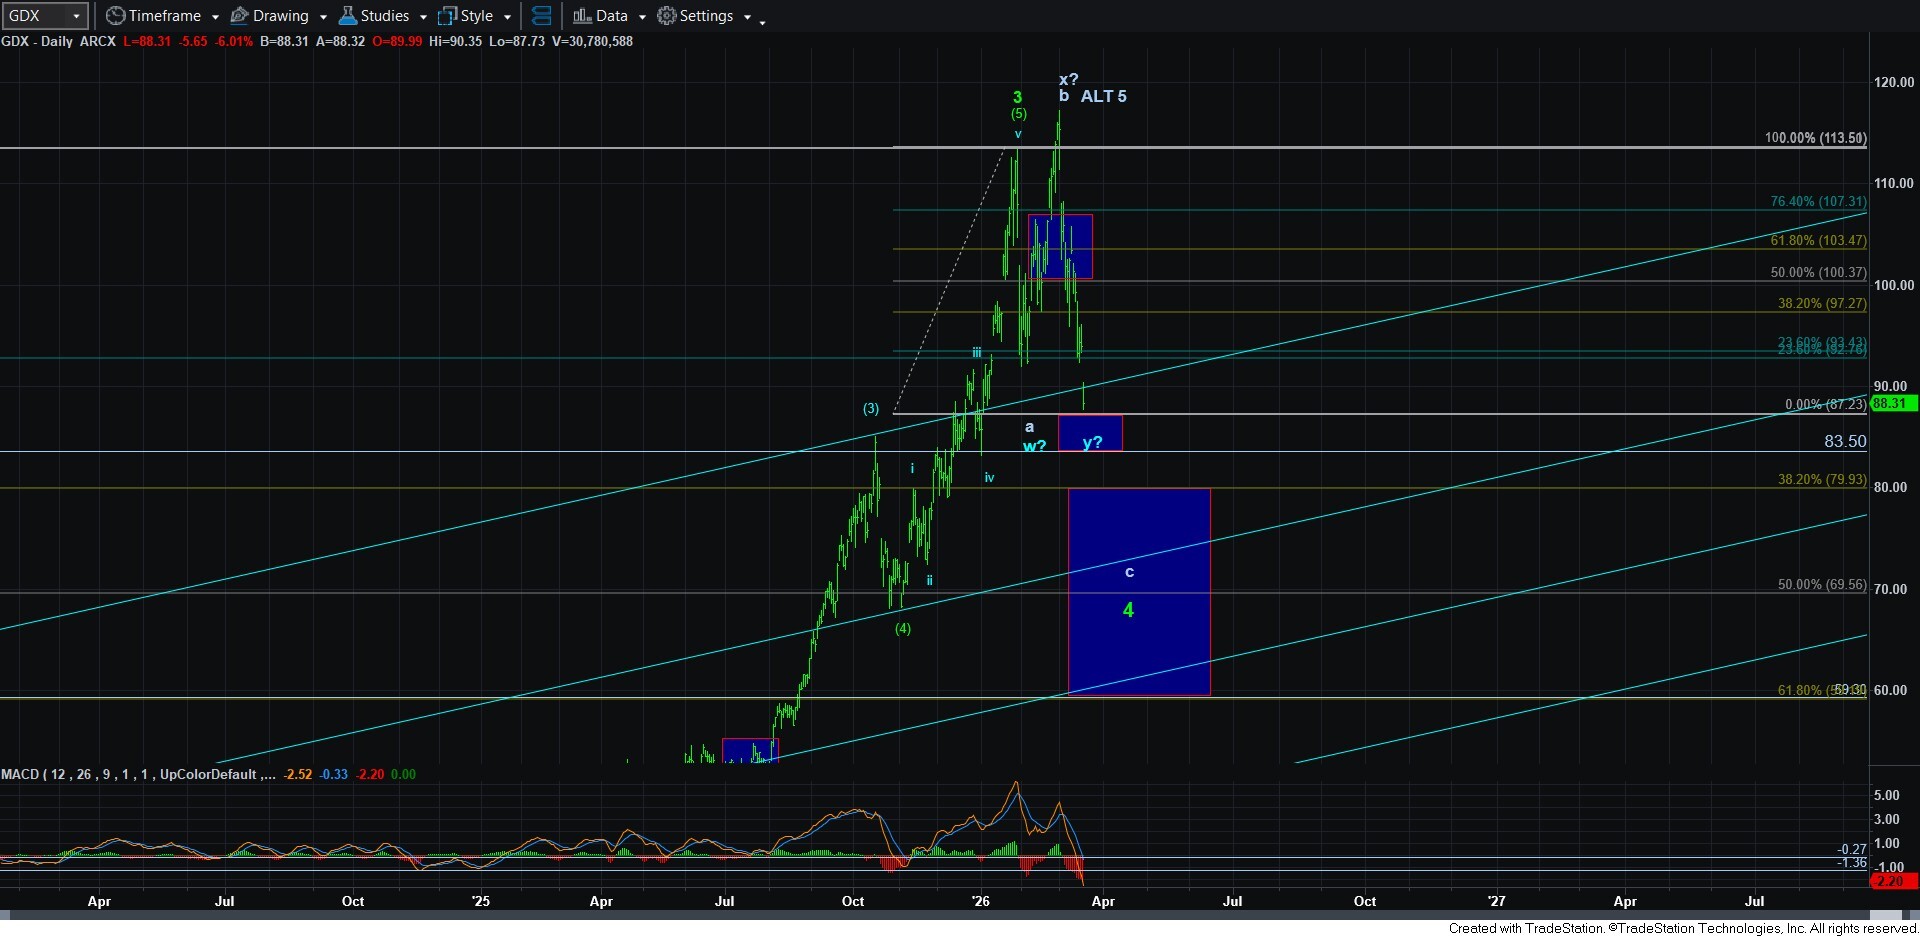
But, nonetheless, GDX may also be suggesting that we could see an alternative as well, as presented in blue. We have now approached a support box I have added to the daily chart, which can represent a w-x-y bottoming structure. What is different about GDX is that whether it will see a higher high will depend on whether it rallies through the micro resistance box noted on the 8-minute GDX chart. If that rally is impulsive, then we could see new highs in GDX. If it is corrective, then this is simply an ongoing corrective structure which will still likely take us down to at least the 80 region.
And, of course, if the market begins to accelerate to the downside, then we could conceivably be pointing down as deep as the 60-70 region as I have explained in prior updates. But, please do take note that the daily MACD has now dropped to an extreme oversold level which we have not seen since 2022, and at that time, it represented only the middle of the decline.
Again, we are now approaching a VERY important point for the metals complex. And, if you are trading this, you must be nimble in this region. I cannot say that one scenario is much more likely than the other at this time. I think the next few days will provide us with more clues to determine which path is much higher in probabilistic terms based upon the action we see. But, the key point is that as long as we remain below resistance in GDX and gold, pressure will remain down.