Are Bonds Broken?
 By
Zac Mannes
By
Zac Mannes
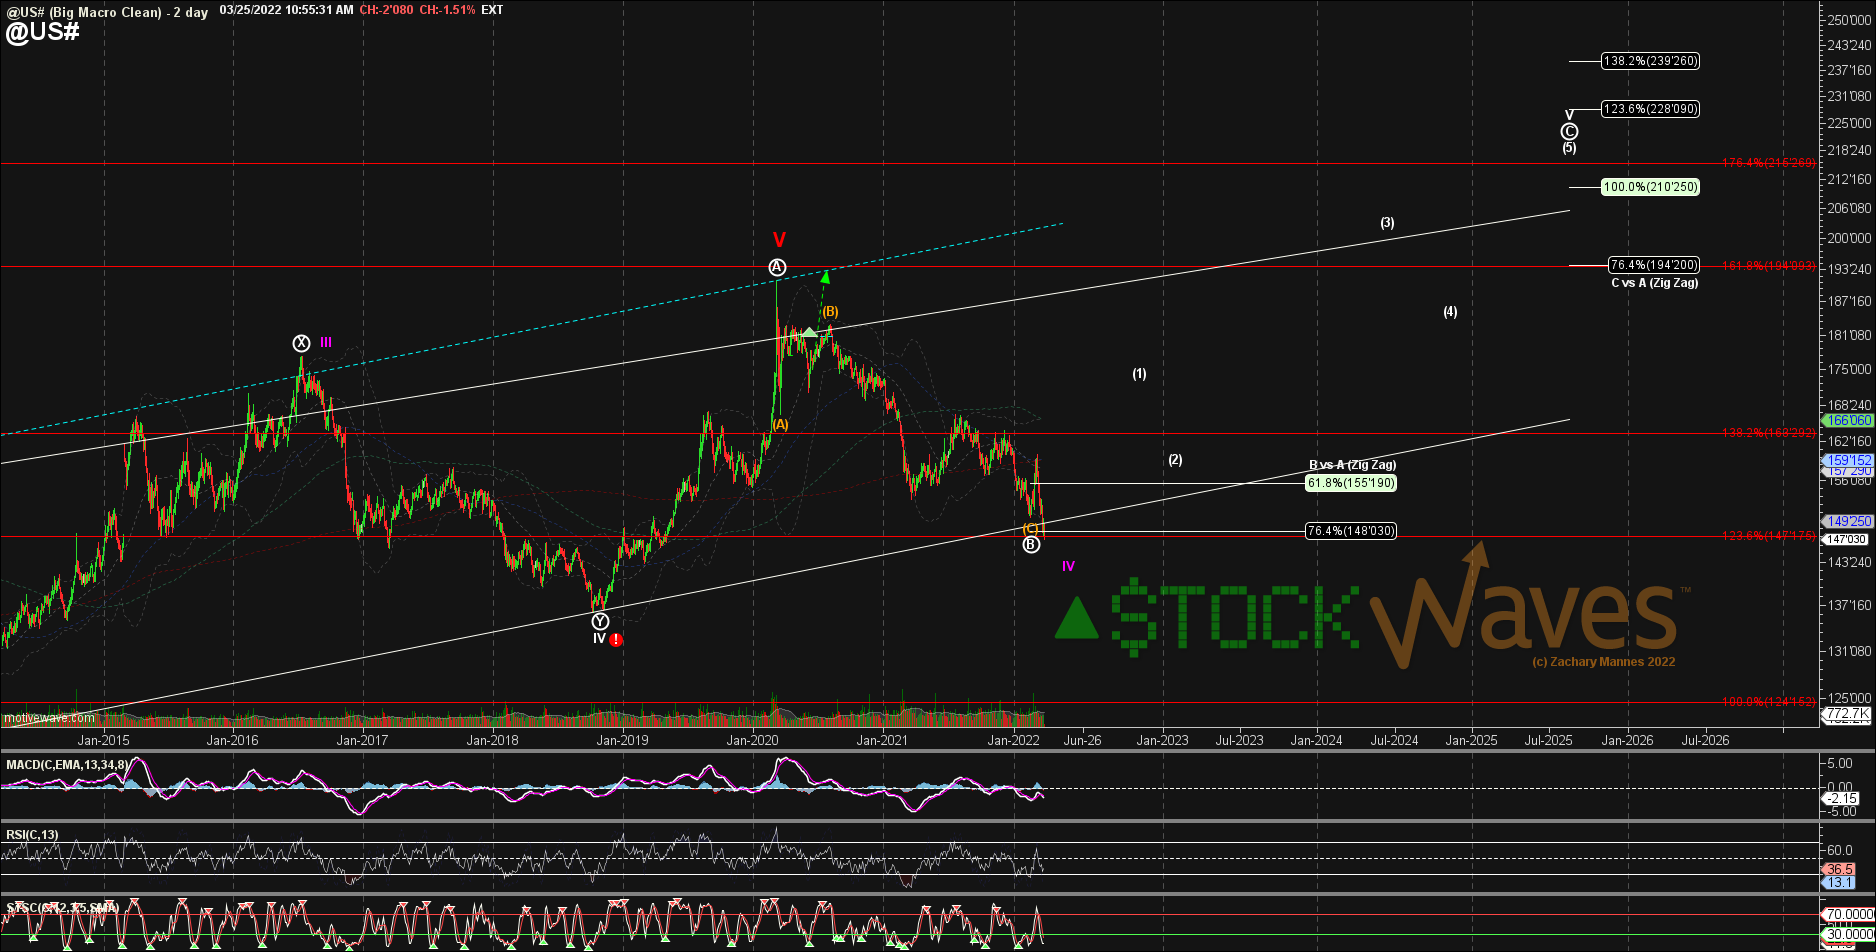
The chart on the 30-Year Treasury can count 5 down now from the 2020 high. Even though this could be just an extension of the orange 5 of (C) of the Primary B wave or the purple C of an expanded flat for an alt Cycle IV, we should not ignore the potential that the Cycle V could have actually topped at the blow-off top high in early March 2020.
Even if that is the case, though, we still look to be completing 5 down now from 167 as an ending diagonal, and that is completing 5 down from the 2020 top, so we would be due for a significant relief bounce even if not a re-attempt at a higher high as V.
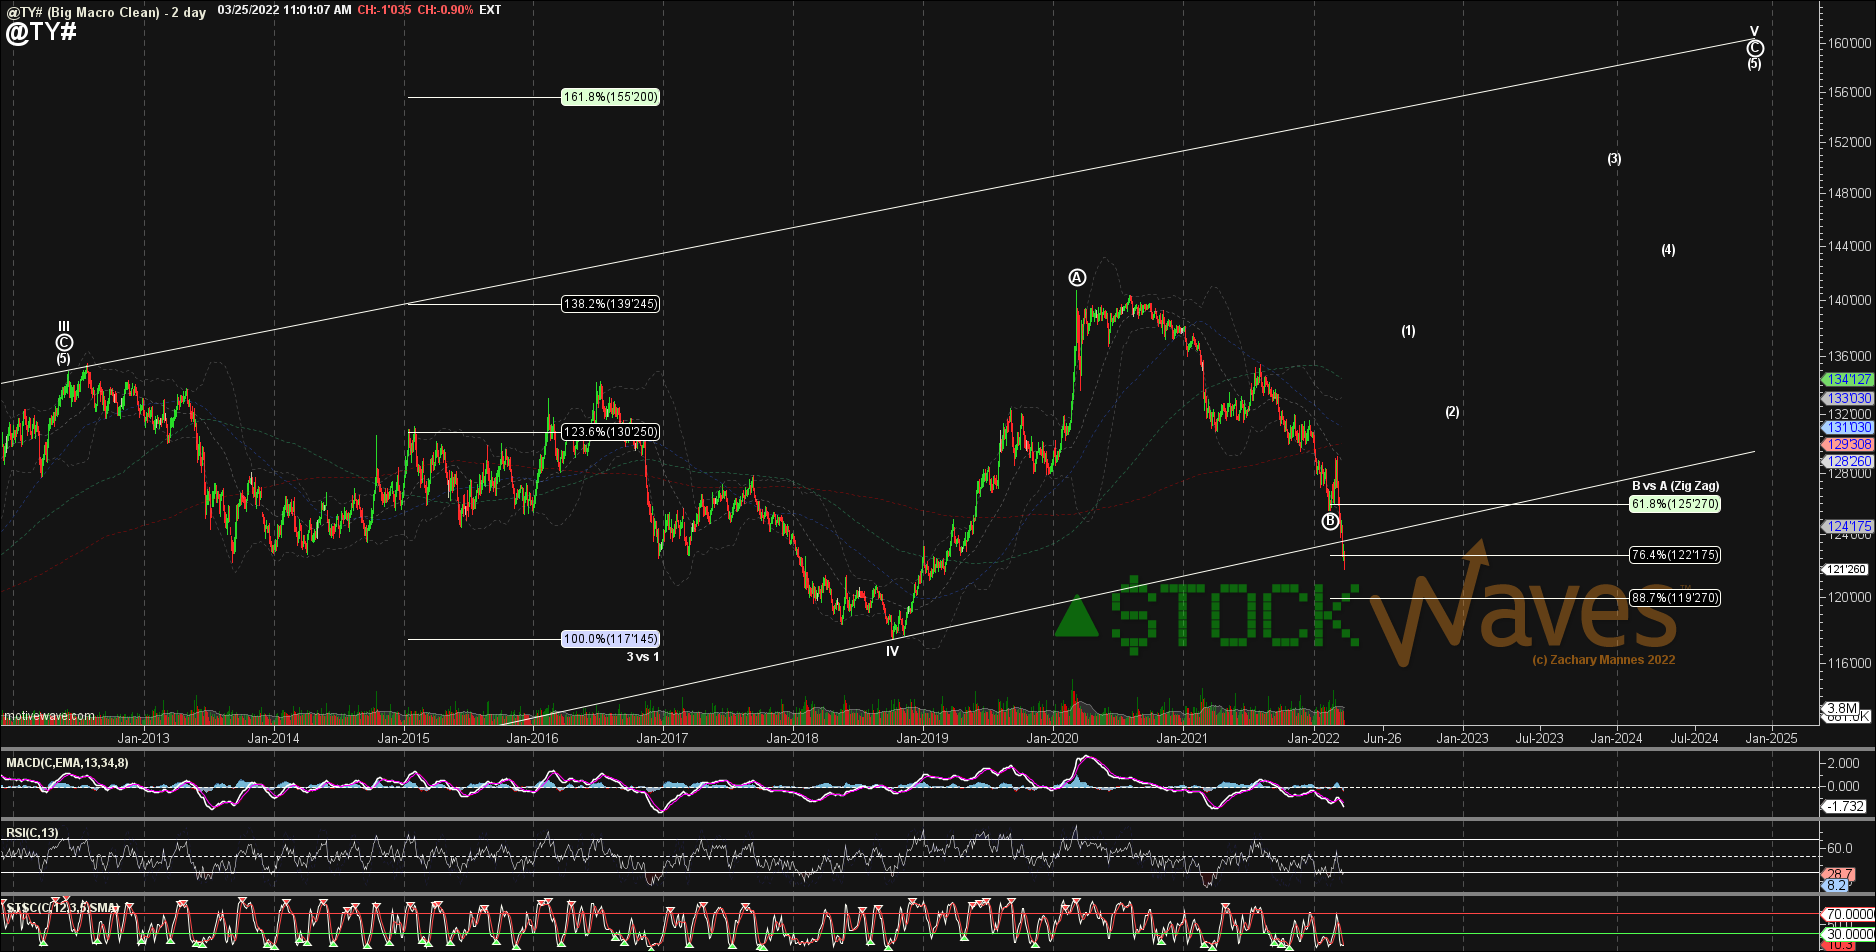
The 168-175 level is a normal resistance region to look for even if things are flipping more L/T Bearish Bonds (Barry Bonds?). Similar red and purple notes can be applied to the 10 Year chart as well.