Approaching Another Resistance Point
Since this is a mid-week update, I am going to be focusing on the smaller degree perspectives rather than the big picture, especially you should know my bigger perspective quite well after this last weekend’s update.
In the weekend update, I noted:
“since the pullback off this past week’s highs looks more corrective, I am going to look higher as long as we do not approach last week’s lows.”
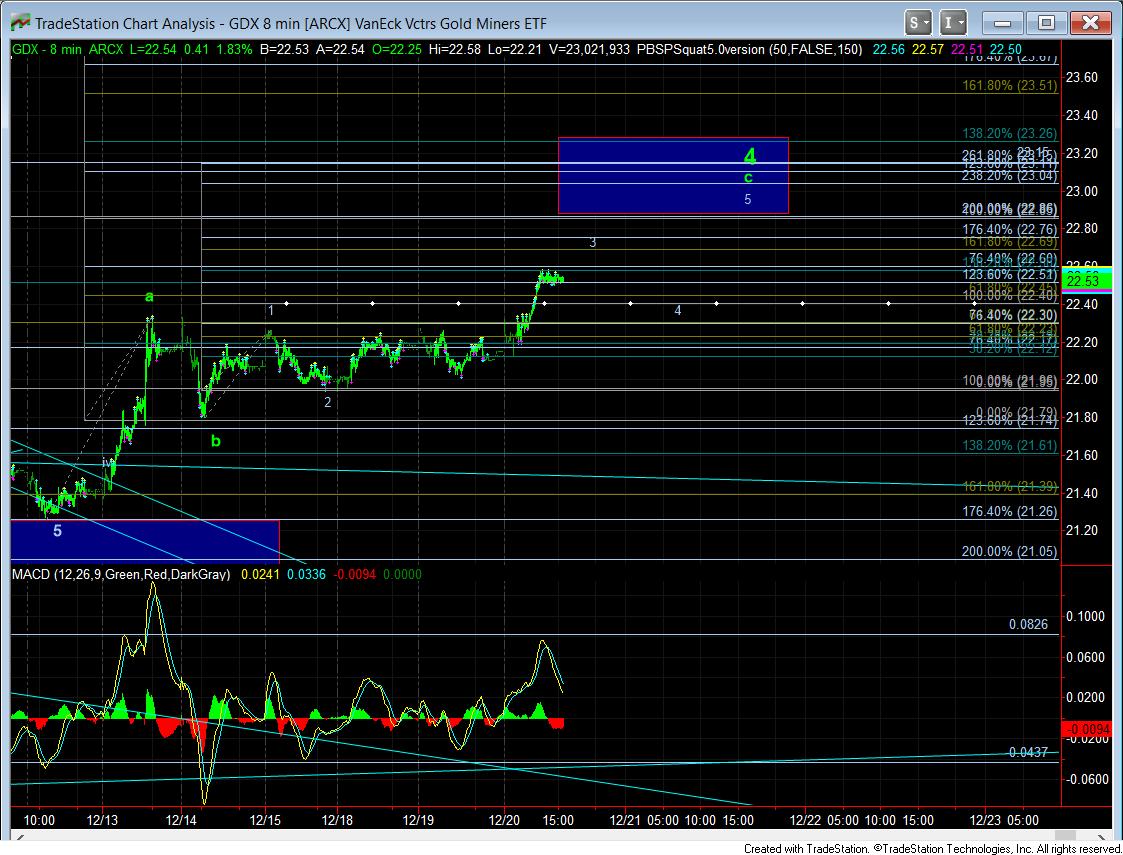
And, the market has clearly delivered a further rally as expected from the weekend update. But, the manner in which the upside set up seems to be suggesting, this seems to be a c-wave in the GDX to me.
During the week, I provided intra-day updates showing how this set up in the GDX can take us up towards the 22.85 region. The pullback off last week’s high seems to best count as a b-wave pullback, which had me looking for the 1-2 set up pointing us higher in the c-wave. Once that became evident, I posted this chart through the early part of the week to show you the target the market seems to be presenting us.
As it stands today, we have a perfect point of confluence in the GDX at the 22.85 level. That is where a=c off the recent lows struck last week, in addition to where the 2.00 extension is pointing within the 5-wave c-wave structure. Moreover, I have noted resistance up to the 23.25 region. So, as long as we remain below that resistance, my expectation is to set up another decline into early 2018 for a 5th wave in an ending diagonal.
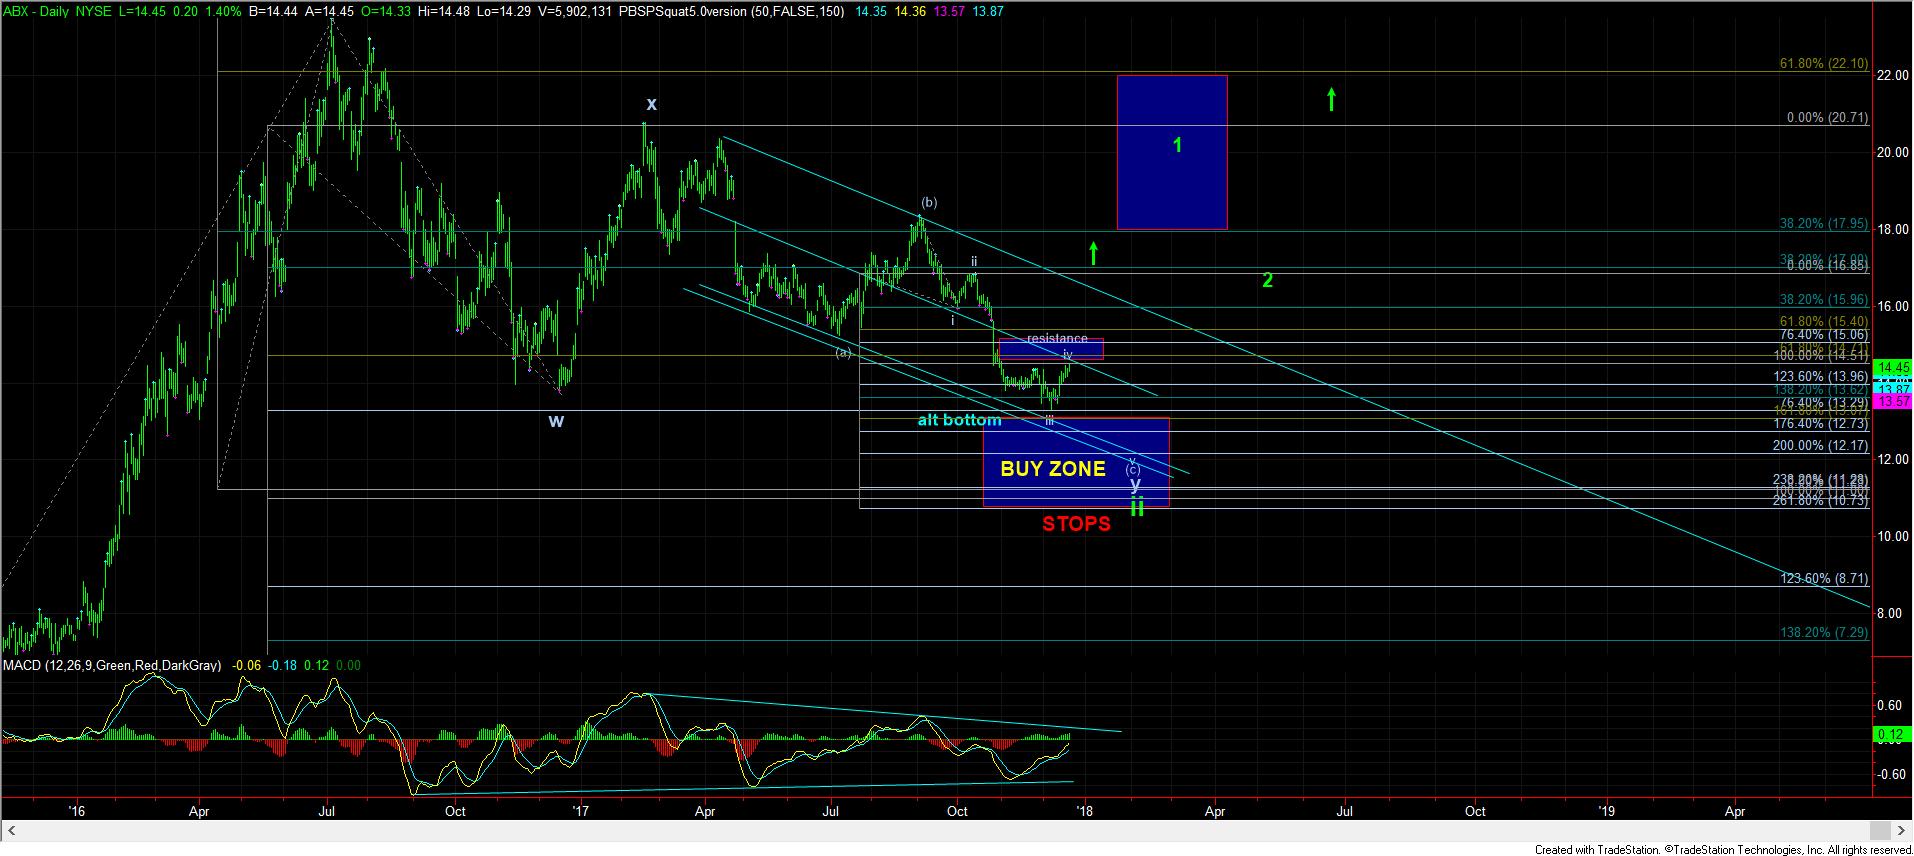
In support of this potential, the ABX has now rallied right to the resistance region, and does not even have a full 5 waves up yet. And, even if it does complete 5 waves up, it still can be a c-wave within a complex 4th wave in the ABX. But, I will note that if we do see a full 5 waves complete in the ABX, it will certainly make me stand up and take notice, and have me watching how the market turns down from that completed structure.
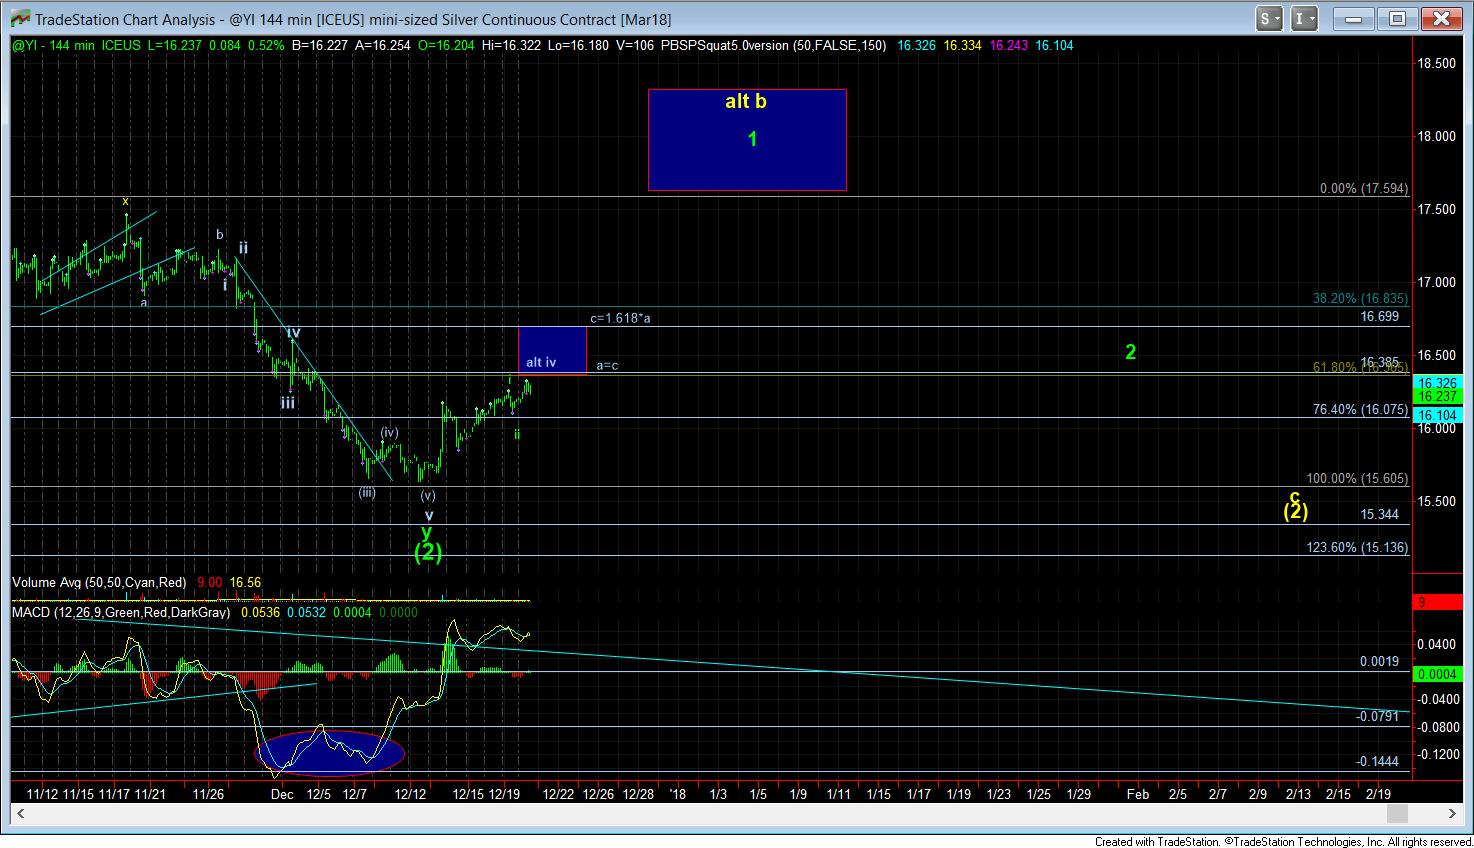
When it comes to silver, the more reasonable count would be to consider the initial move off the lows as a 3 wave structure. That means we have resistance between 16.38-16.70, wherein we have a=c and c=1.618*a confluence off the lows. It will take a STRONG break out through this resistance for me to consider us having a 1-2, i-ii structure off the lows, and opening the door much wider to a potential bottom being in place.
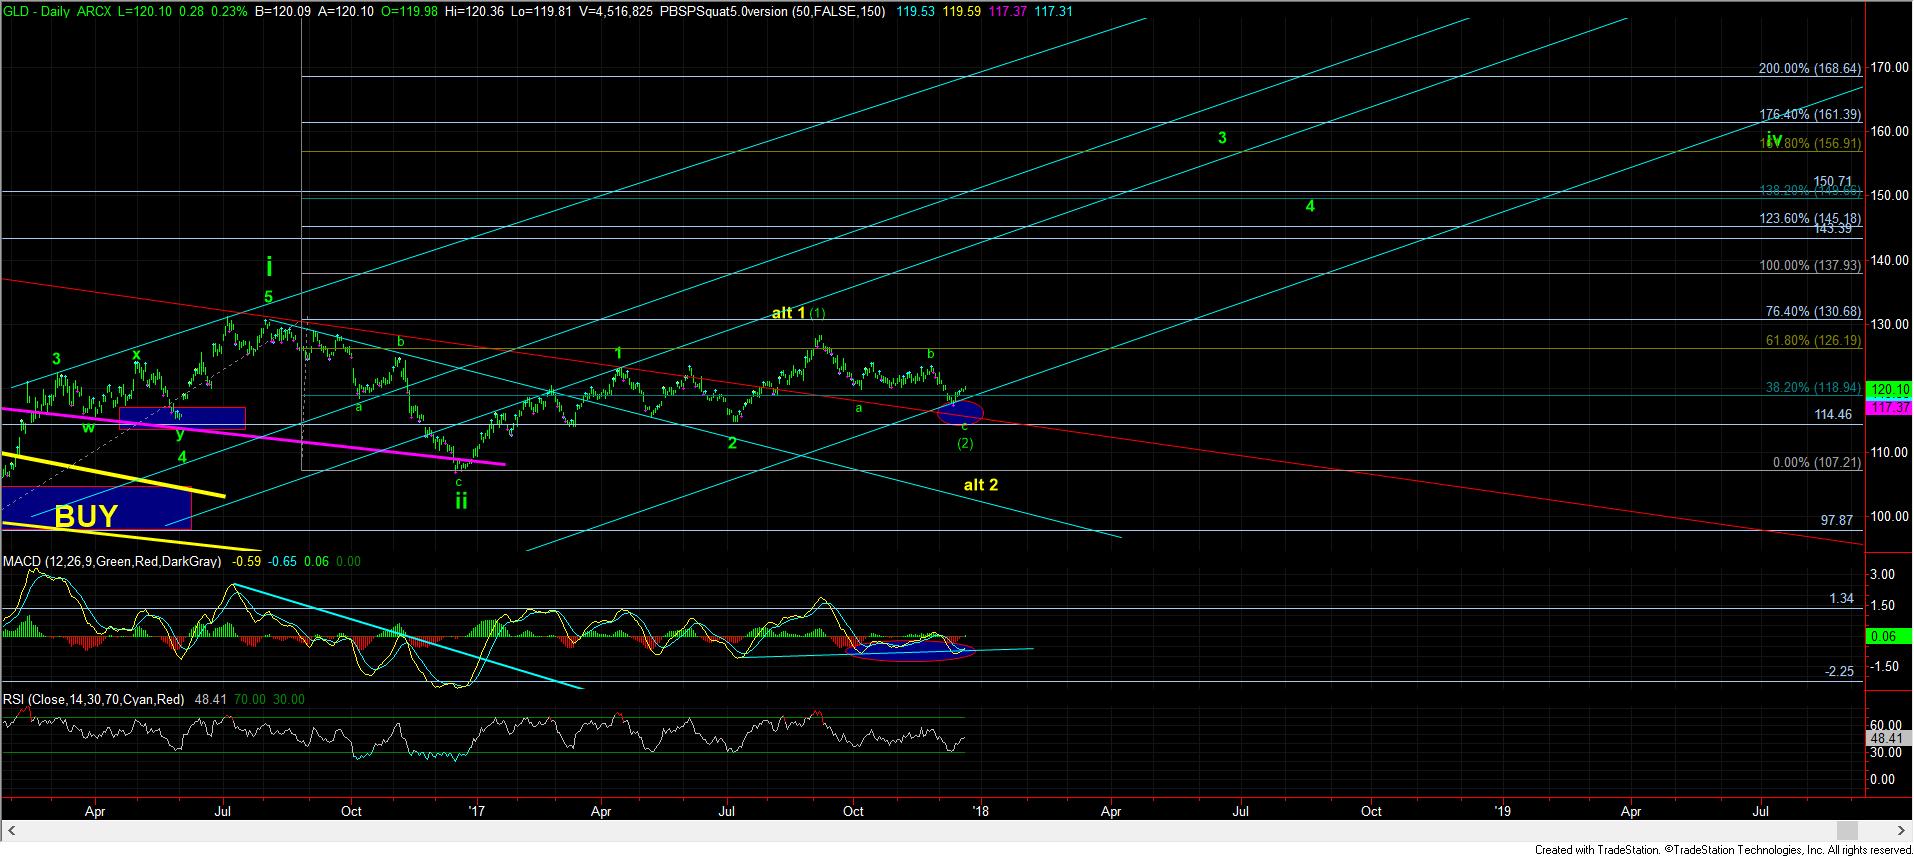
As far as GLD is concerned, I can count the GLD in a similar manner as GDX, and that it is in an ending diagonal for a c-wave down. And, I have initial resistance in GLD at 120.65.
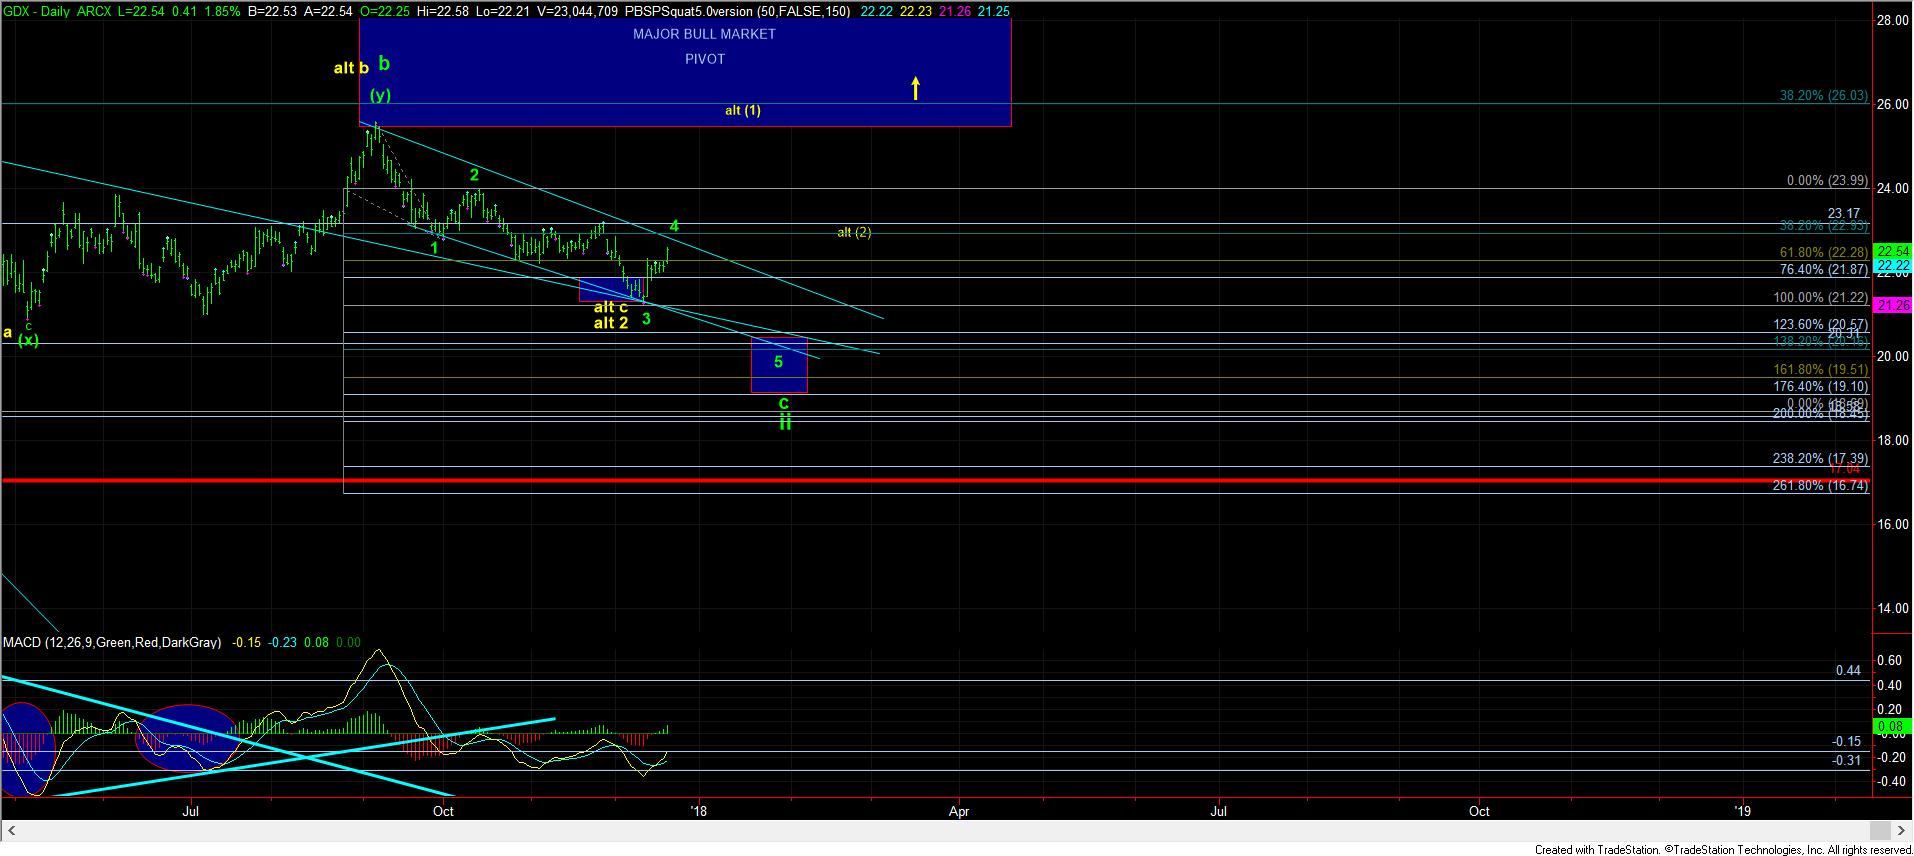
Again, as we move into 2018, I am bullish the overall complex, as I explained quite clearly in my weekend update. But, I still think there is potential that this pullback which began in September has not yet completed. And, I will need the market to prove it to me that this is not the case with a strong break out of all the relevant resistances I am following. Remember, the market still needs a bigger (1)(2) structure to develop before we are ready for the major rally. So, I don’t think the market is going to run away from us without that structure setting up the bigger break out I want to see in 2018.