Applying Fibonacci Analysis To AAPL
Carolyn Boroden's Fibonacci work has yielded a setup in AAPL that is not only worth highlighting as a top call but that's also exemplary for anyone seeking to better understand her methodology.
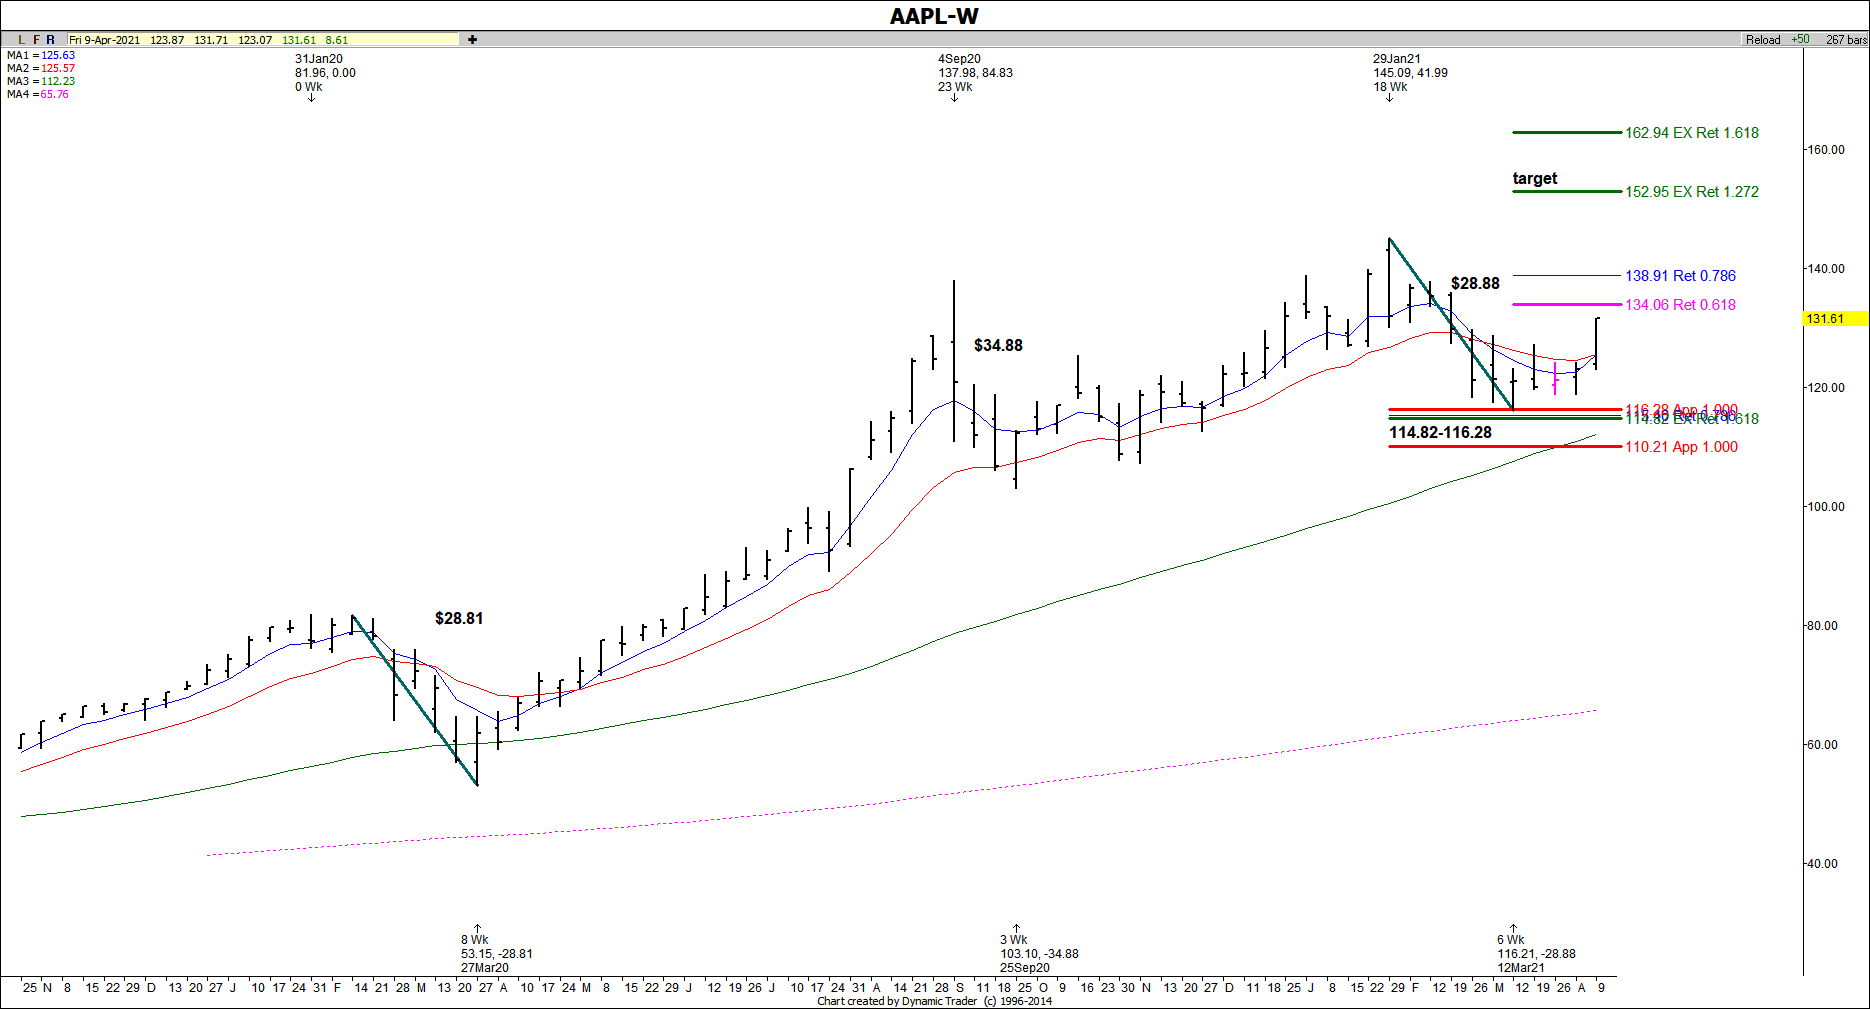
Carolyn explains, "This setup has taken forever to bust a move, but we're finally seeing a nice rally in AAPL off key daily/weekly support in the 114.82-116.28 area."
What stood out for Carolyn, who highlighted this setup for members of her Fibonacci Markets & Stocks service, was something she refers to as symmetry. Noticing that a prior decline on AAPL's weekly chart back in Feb & Mar 2020 lasted $28.81, she projected a similar decline off the high made in late January of this year, which pointed down to $116.28.
The actual low in AAPL was made at $116.21 on March 8, just 7 cents from her projected level ... directly in the Fibonacci support cluster zone. From there she was able to anticipate AAPL's bounce.
"The second swing was very similar to the first at $28.88 as illustrated on the chart," she explains. "If we can clear the hurdles of resistance on the way up, the $152.95 target is the initial target we're looking at off this low."
See Carolyn's AAPL chart below (and click on the chart to expand).
Also, see a recent presentation Carolyn did outlining her Fibonacci Time & Price Analysis.