Another Spin On Evil
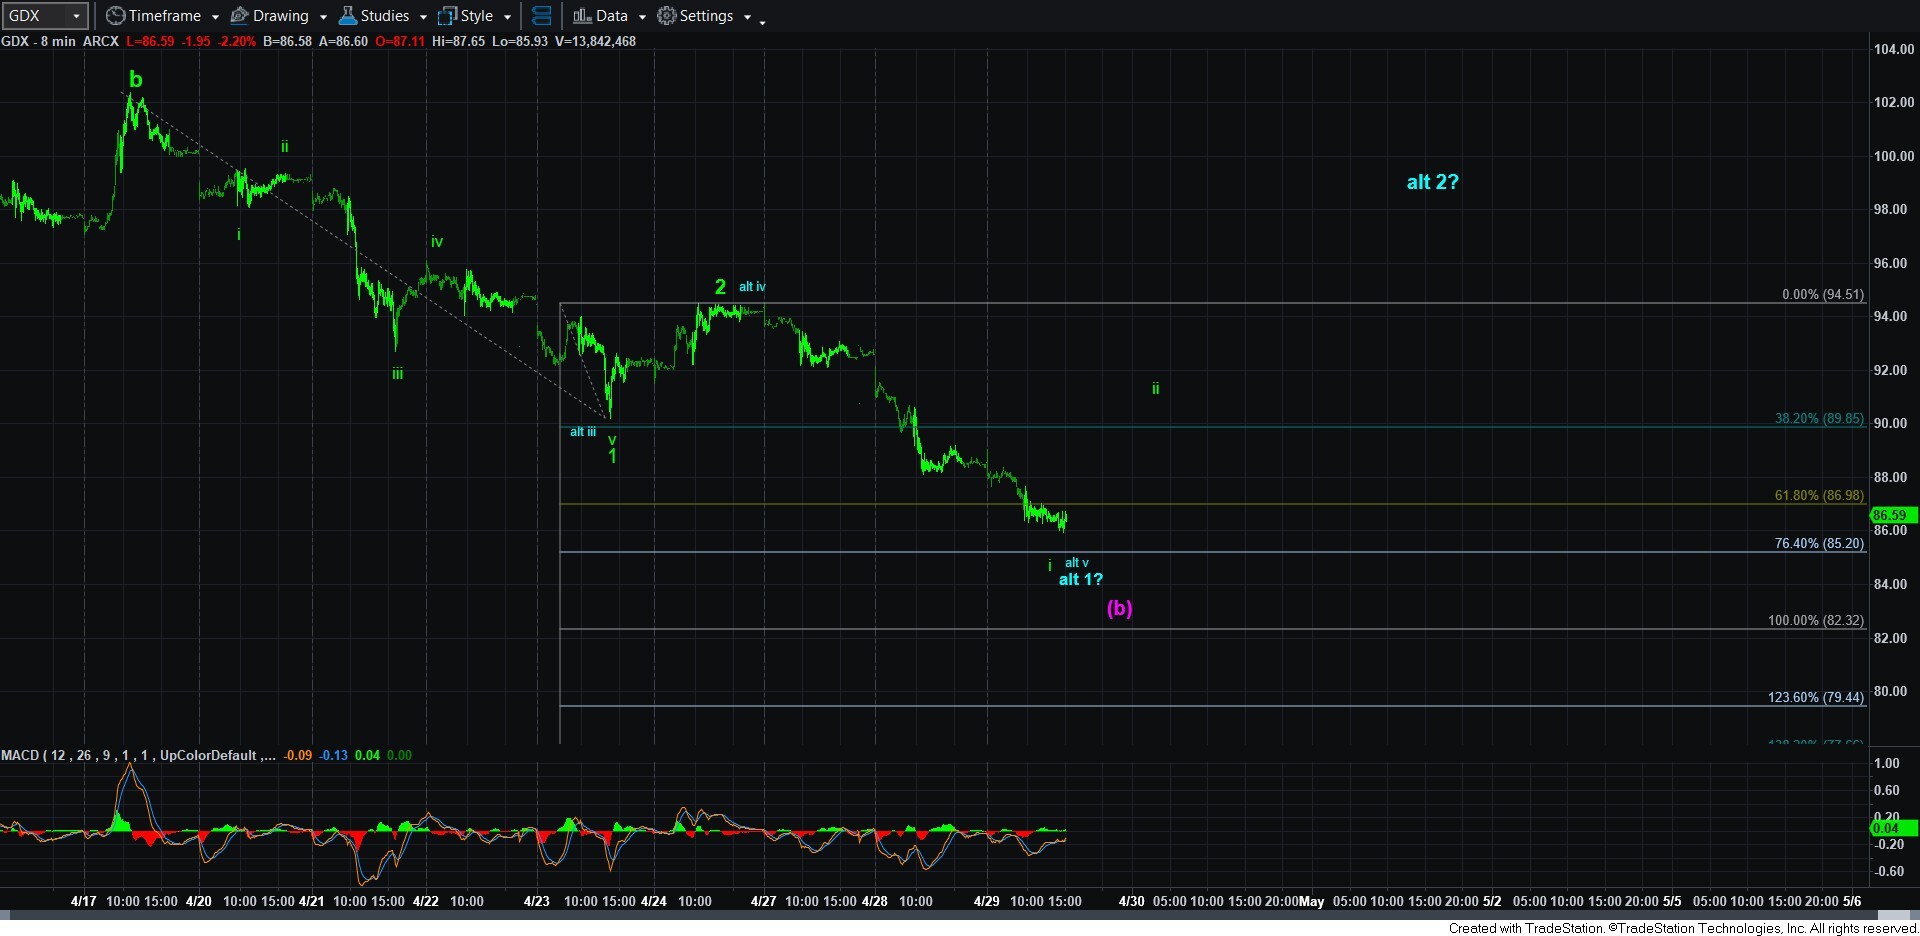
While GDX has been the cleanest of the paths over the last week or so, today’s action has placed more uncertainty around it. While the bigger picture still strongly suggests lower levels will be seen before this correction is done, the fact that we have dropped this deep without an appropriate 2nd wave bounce if this is a c-wave decline adds a certain amount of complication to the chart which forces me to consider a different twist on the “evil” purple count.
As you know, I have been expecting more of a bounce for a wave 2. But, if the 3rd wave down in GDX has indeed begun, it would provide for a 2nd wave bounce that reached only a .382 retracement of wave 1 down. This does place this count into question as that is an abnormally shallow 2nd wave retracement. So, it forces me to consider other potential paths.
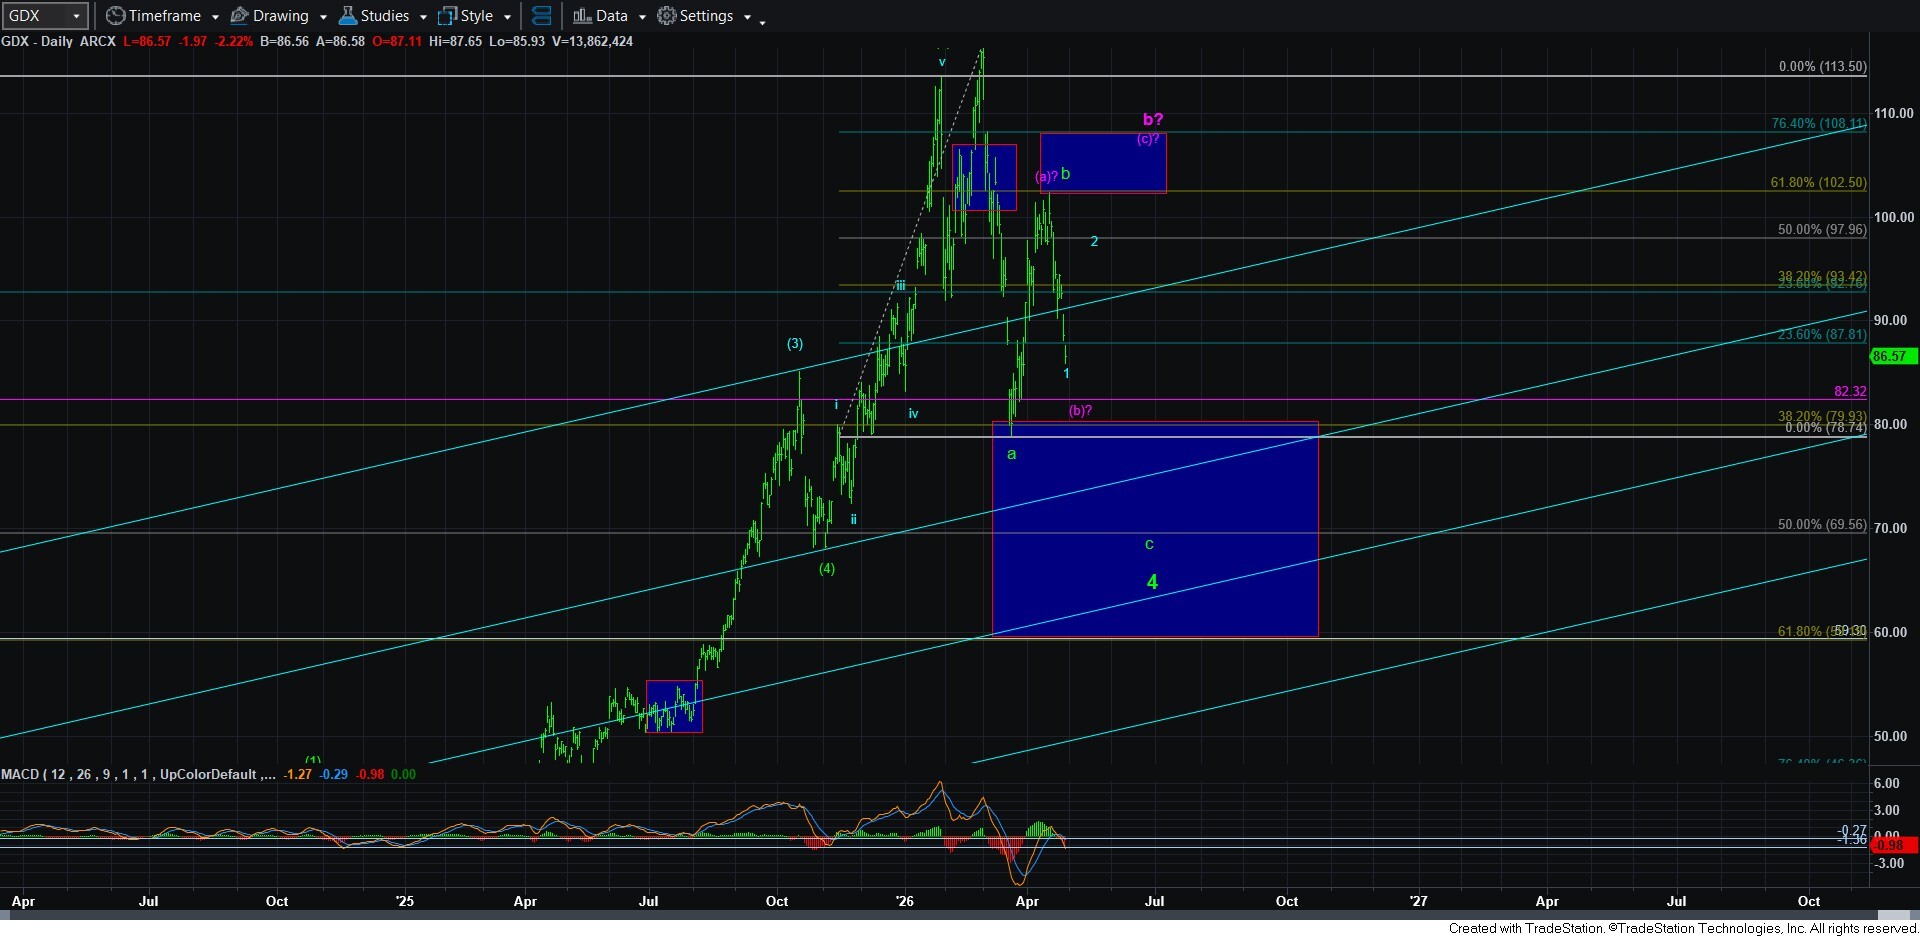
One of the potential alternatives I would consider is that this is really a 5th wave in a bigger wave 1 down, which is presented as a blue alternative, and labeled “alt”. But, when the 5th wave exceeds .618 the size of waves i-iii, it places into question the potential that this is a 5th wave in that bigger wave 1 down. And, should we break down below the .764 extension, then it makes it highly unlikely that this is a 5th wave, and places other alternatives before us.
One such other alternative is presented by a different purple count I now have on the chart. (As an aside, I presented this path in yellow earlier today, so please realize it now relabeled as the latest EVIL purple iteration). This would suggest that the market can bottom between the .764-1.00 extensions (85.20-82.32) and represent a (b) wave in a much bigger b-wave structure. And, should we bottom in that support region, and then rally impulsively through the .618 extension (87 region), then it would significantly increase the potential for this even more evil path to play out.
So, for now, I am probably forced to view the green count as my primary since it presents us with the most immediate downside follow through structure we are tracking, despite its issues regarding a shallow 2nd wave and the wave i of 3 slightly exceeding the .618 extension – so far. And, at this time, I would have to view the purple alternative as the lesser likely of these three paths, at least until we drop down to the .764-1.00 extensions below and then reverse in impulsive fashion. That also means that the blue path is the main alternative path I am tracking for now. So, the order of probability as I write this update is green (most immediate), blue, and then purple. And, it also means that a break-down below 82 makes it highly likely we are on our way to the 60-70 region, of course, the ultimate target depending upon whether we take the blue or green paths and the size of the 3rd wave extension.
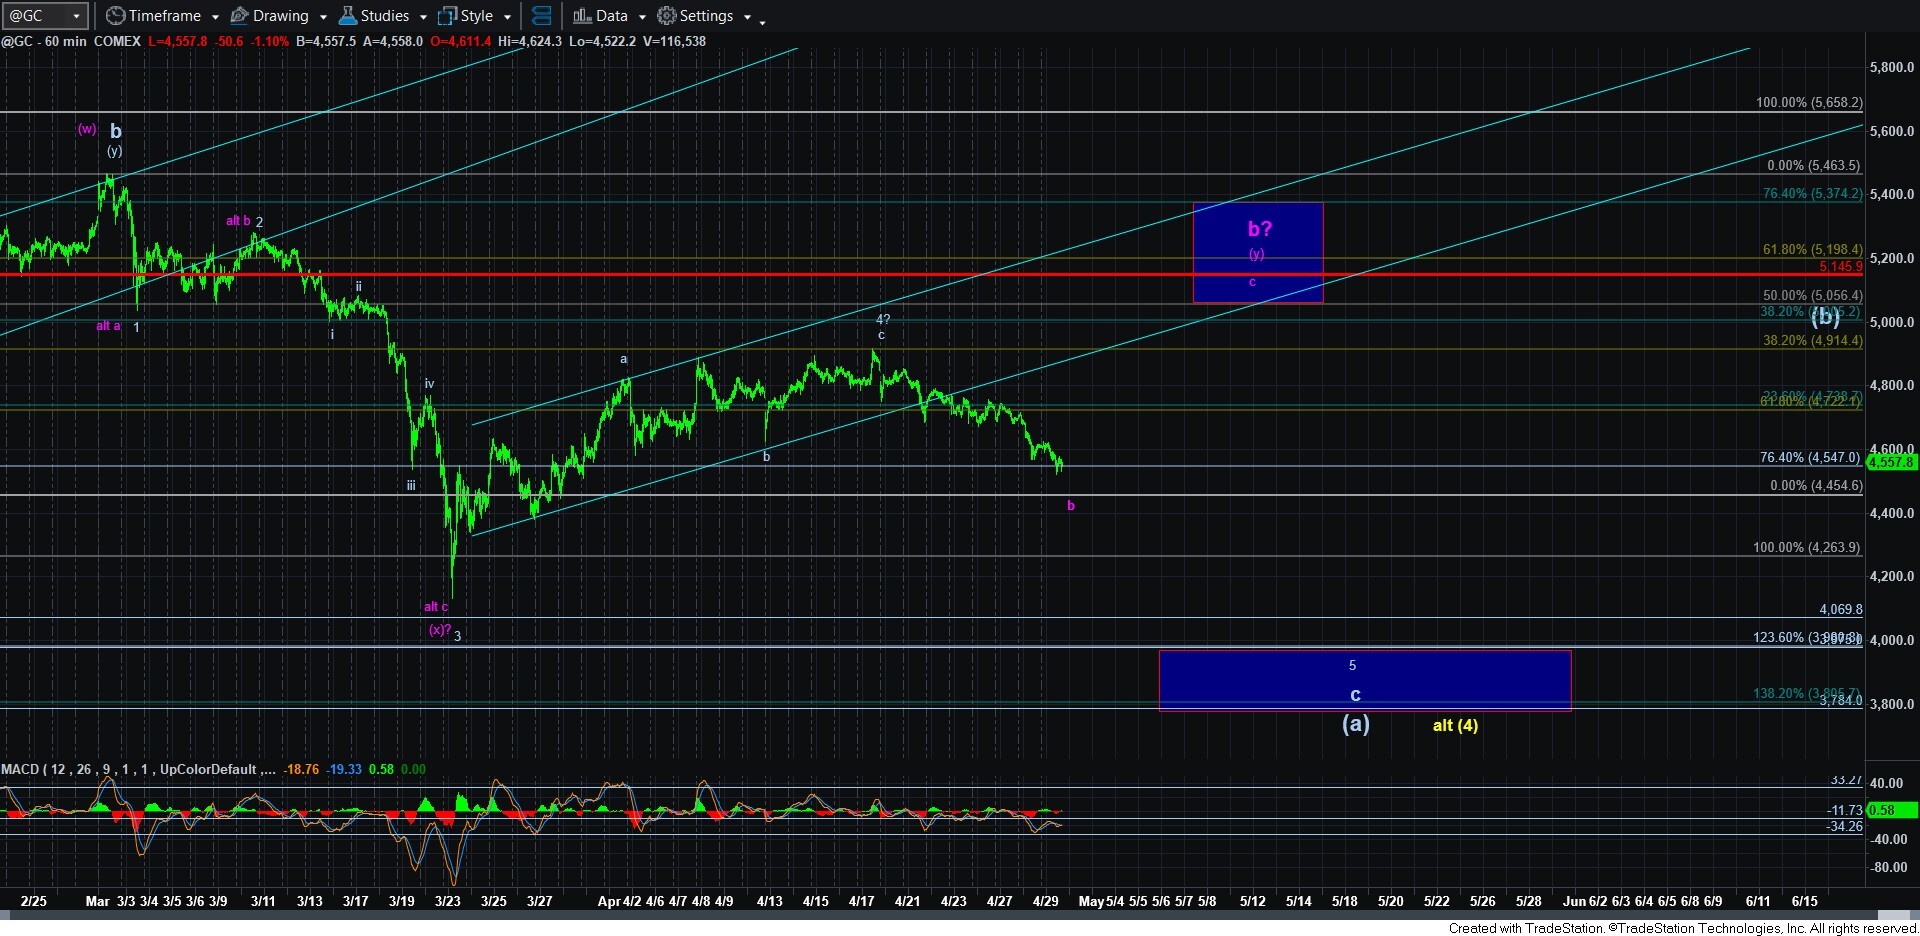
And, believe it or not, this is the clearest chart of the three main charts I am tracking in the metals right now. So, yes, both gold and silver can still retain their respective purple counts as shown before, but with a slightly different perspective since gold has broken its b-wave triangle. So, if we begin to see 5-wave rally structures across the 3 charts at any time now, then we have to again give greater consideration to the purple count.
So, for now, I intend to be using the GDX as a guide for the metals paths we are tracking in the coming weeks. Unfortunately, both silver and gold are not providing us with anywhere near as clear indications as is GDX.
As I have warned oh so many times over the last 15 years that tracking a b-wave is akin to throwing jello for distance, I think we are seeing a true life example as to how and why that is the case. This correction may still yet have more twists and turns for us before we see strong evidence that the c-wave is in progress. And, should we see either the blue or purple paths take shape, then it will likely give us a better opportunity for a short trade for that c-wave decline. Unfortunately, the shallow green wave 2 certainly left us lacking for a low risk, high probability short side set up.