Another Key Juncture- (Nightly Report September 4, 2018)
 By
Ryan Wilday
By
Ryan Wilday
Summary
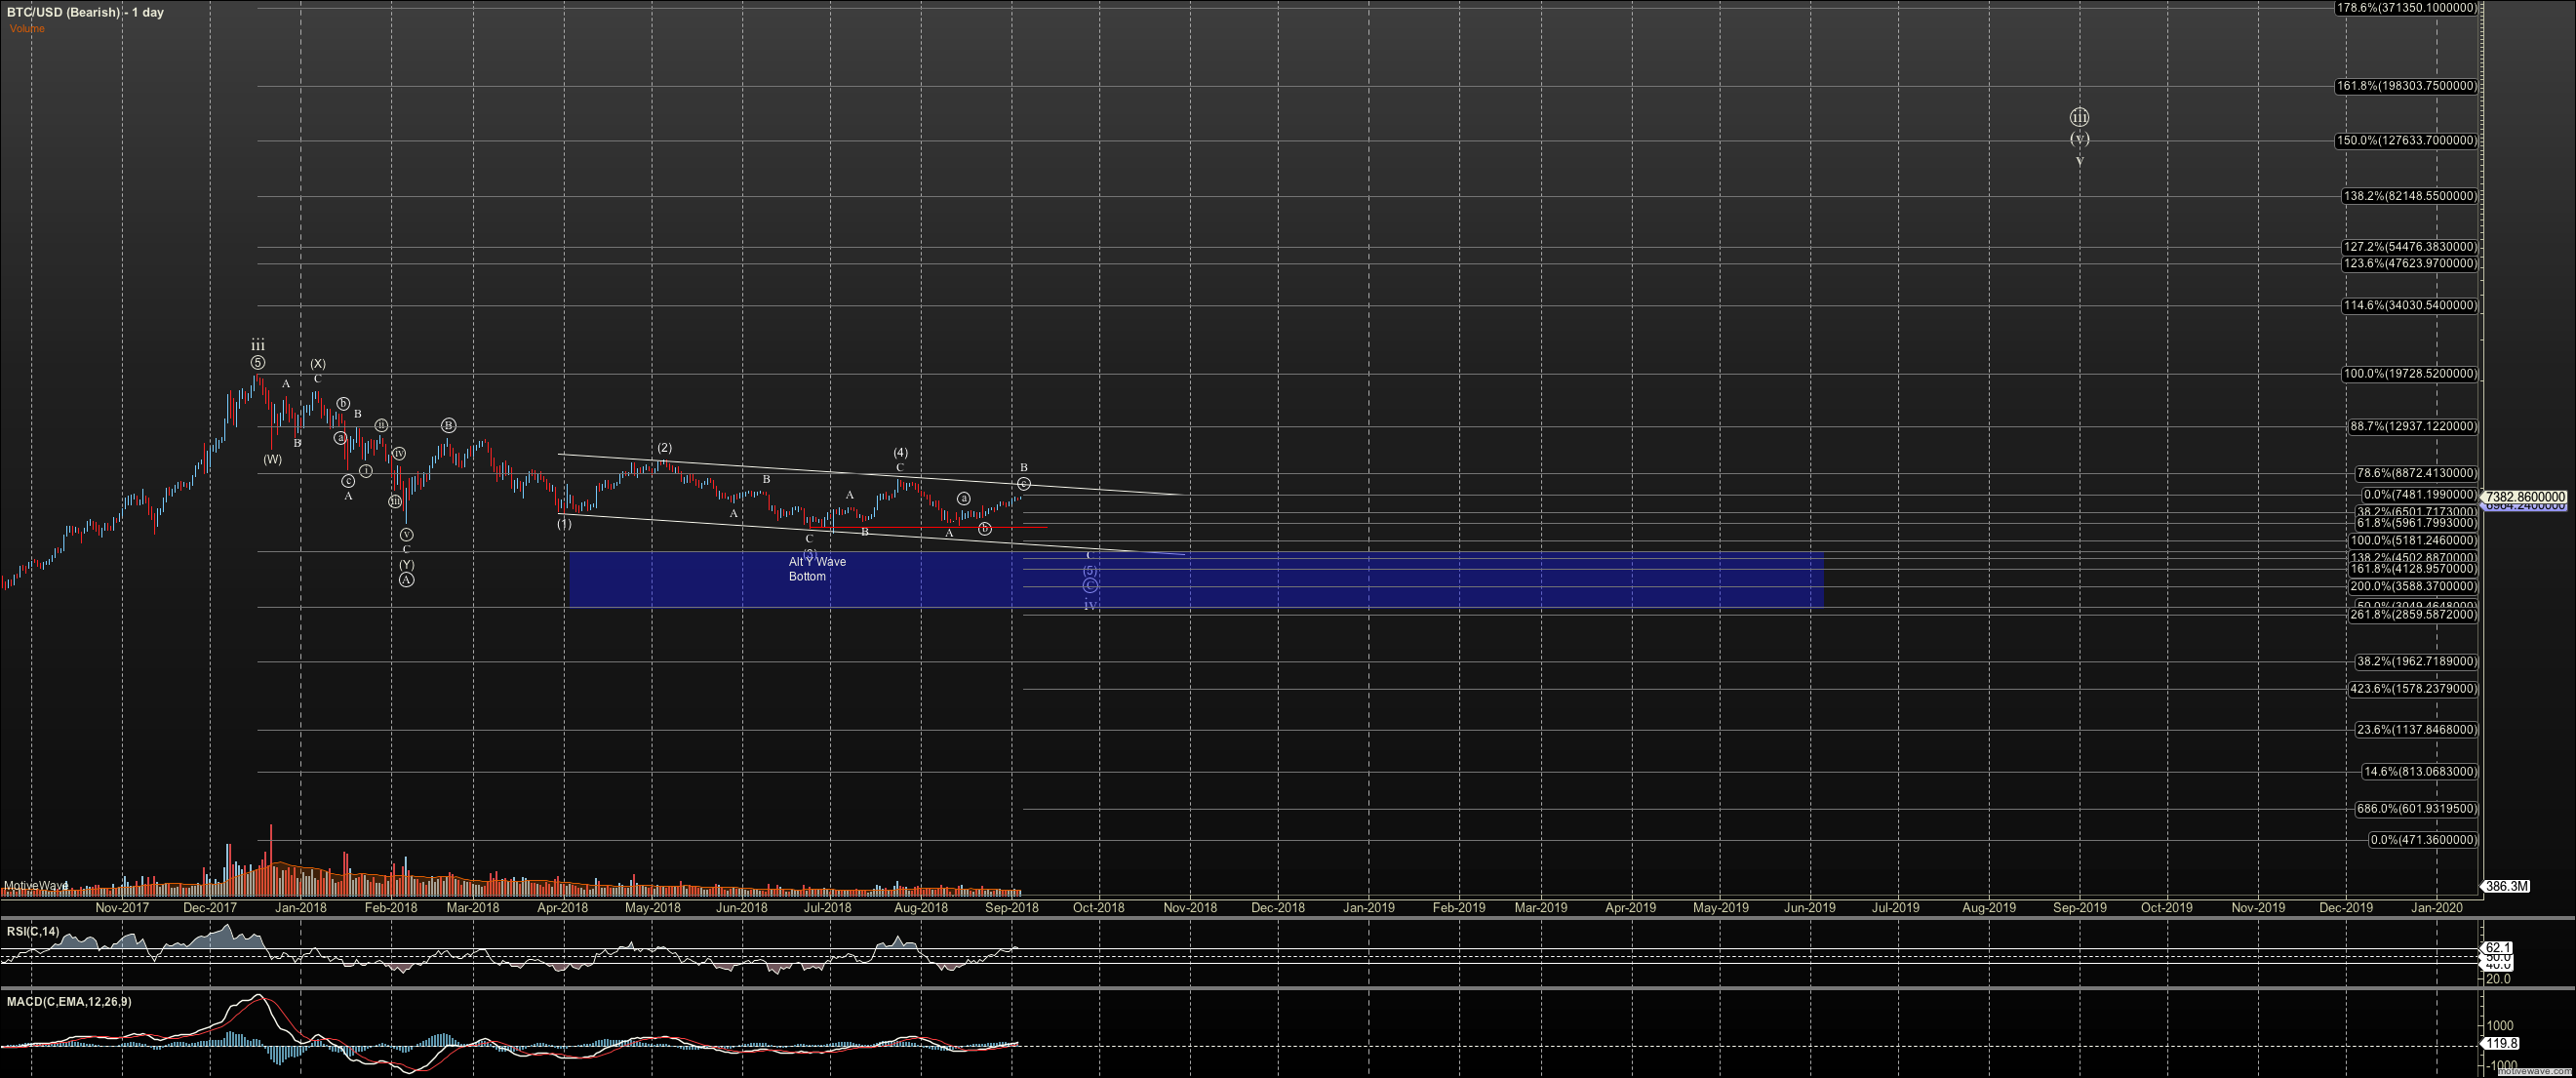
If you have followed along via my posts, and articles, I have held out $4700 as ideal support for Bitcoin, since January. And, here we stand, with another setup that could potentially get us there. But just as many setups ‘threatened’ to plumb the depths, but were thwarted by bulls, this one now is being pushed to its edge.
$4700 is the .382 retrace of the 1-2 setup that bottomed in XXX 2016 so is an ideal landing spot for this wave iv. And, as long as we hold $3000 my primary long term count is maintained in lieu of the alternate that this is primary iv.
And in parallel with this setup, so many alt coins, also have a similar ‘one more low’ setup that points to key long term support. We are obviously at a key juncture..
Regardless of outcome, we should know soon.
Bitcoin
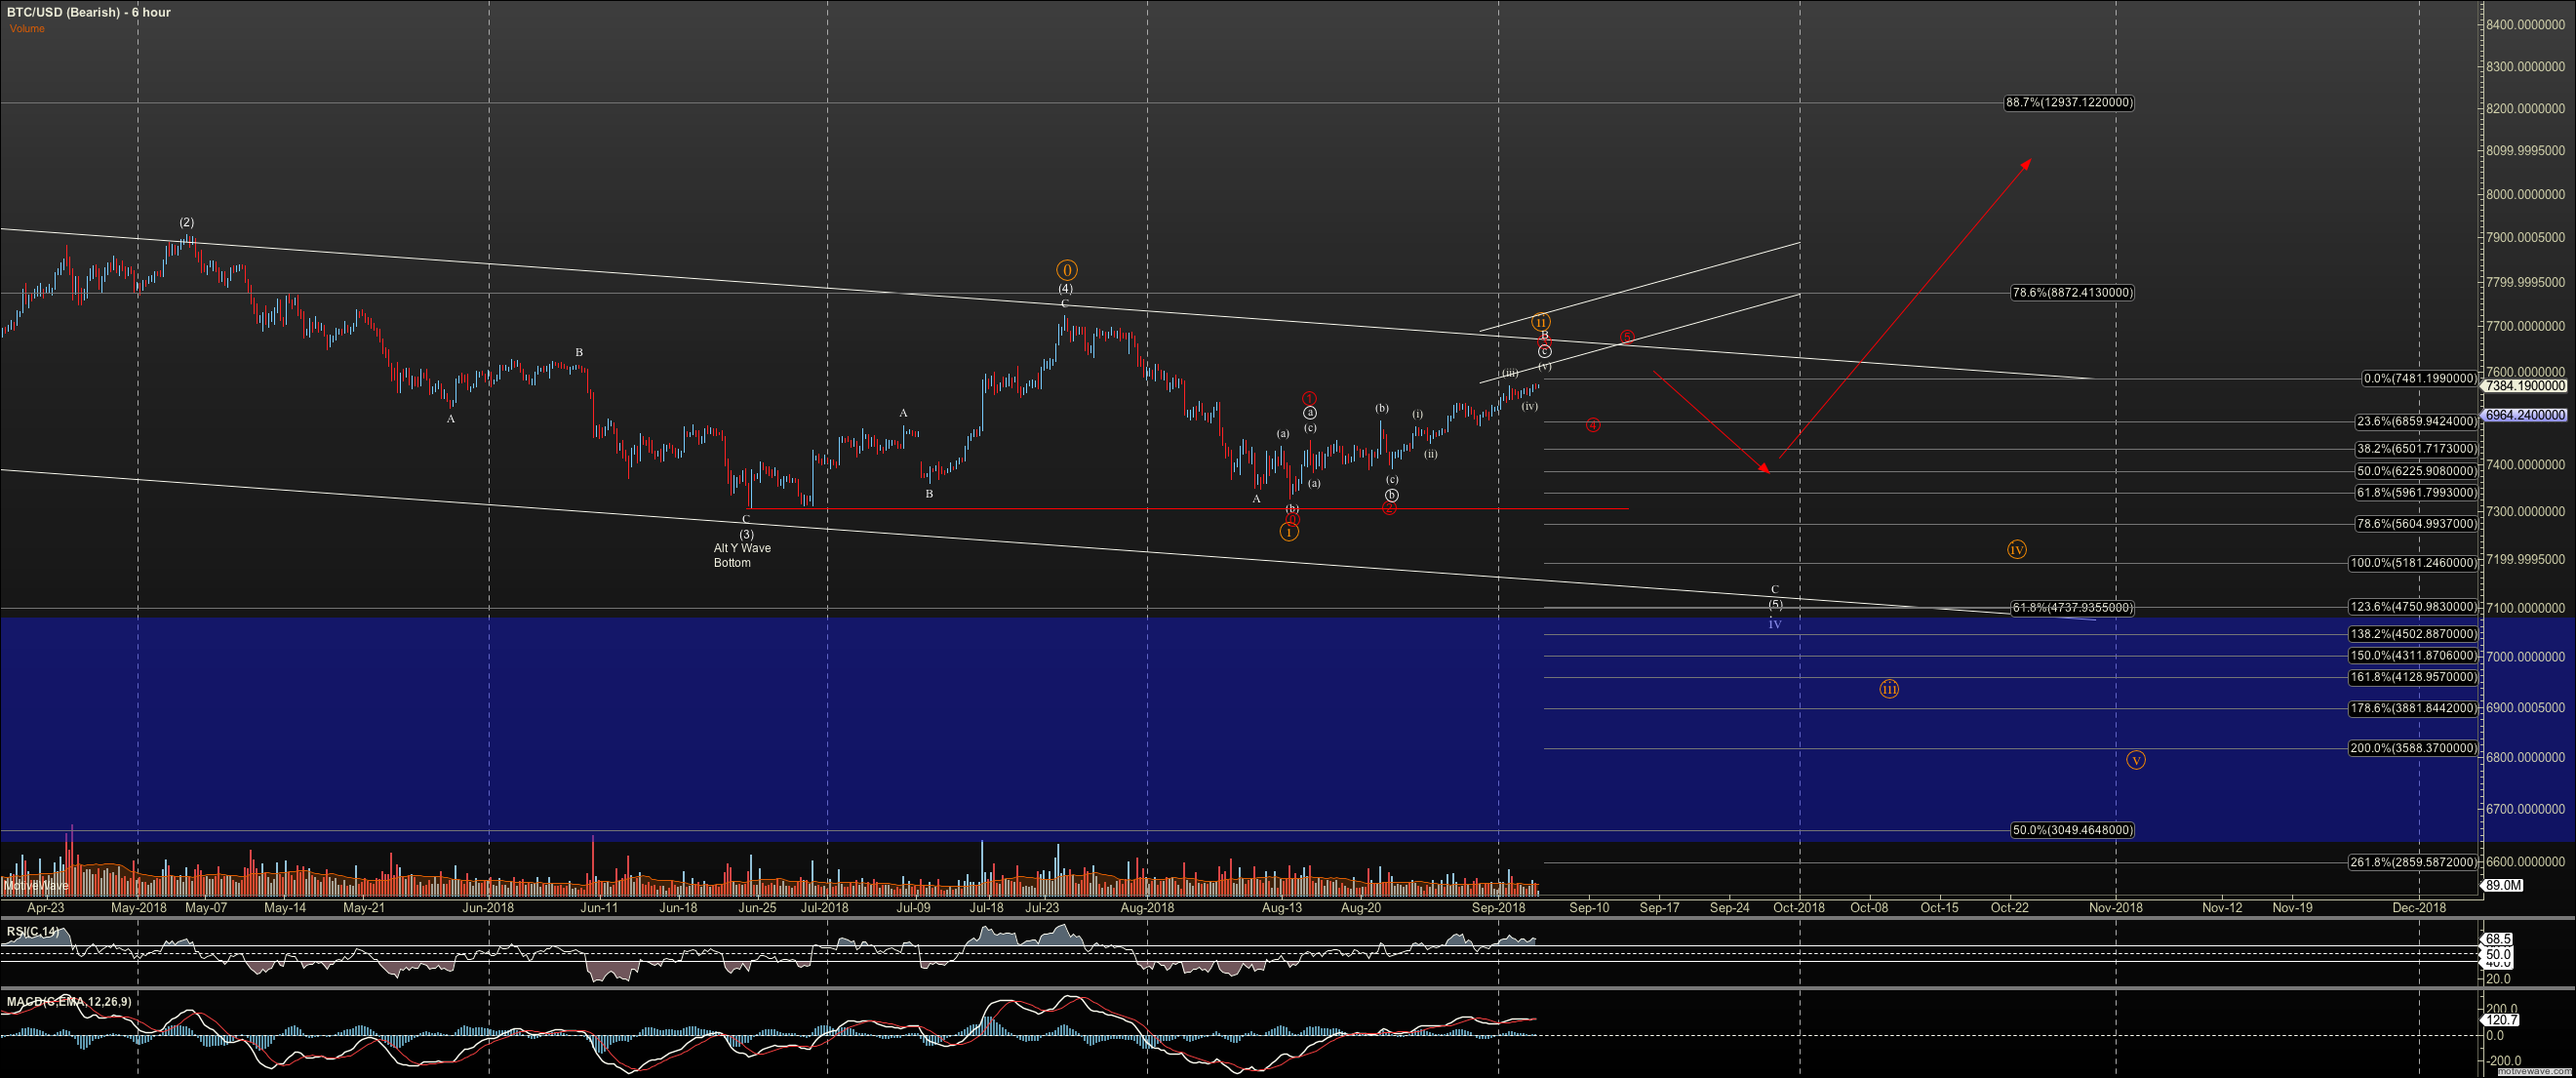
The orthodox view of Bitcoin on the 6 hour chart is that is it completing a large C wave off the February high as an ending diagonal. And, in that view we are in wave B of 5. However, while this setup is ‘normal’ up to resistance at $7800, and not utterly invalid without a break of $8500, it becomes very questionable much over $7400. And, here we stand, where I need to offer some concern for the bearishly positioned, including myself with my short ‘hedge’ I currently carry.
The alternate view is that we had a Y wave bottom back in June. however, with the three wave rally to $8500, we can only be in a weak wave three of a diagonal for that to be true. Certainly this is not impulsive third wave action, no matter how you look at it. Nor, does an impulsive ever third wave come after a three legged wave one.
But as I have described myself, I order fibs or levels ahead of subwave structure, as cryptos tend to exhibit many unorthodox structures, particularly at turn points. So, I will mind $7400 to not press my luck.
Finally we need to consider the deep Y wave option in orange. This is based on a fractal that Bitcoin has exhibited in many corrections, most notably in July 2017. I have affectionately named this potential ‘the waterfall’. However, my experience with such fractals says it will be the one that rips the most short traders to shreds as it pulls them in and spits them out in days if not hours on the return.
So, to summarize, I am primarily looking for one more low into the $4700-4900 region, with the potential of ‘the waterfall’ to $3500 roughly. But if we fill out more subwaves in the red diagonal as shown, and can only retrace correctively, I will need to look up with confirmation of breakout coming over $8500. In micro I need to see 5 waves down below $7000-6900 to give indication the 'flush has started'.
Ethereum
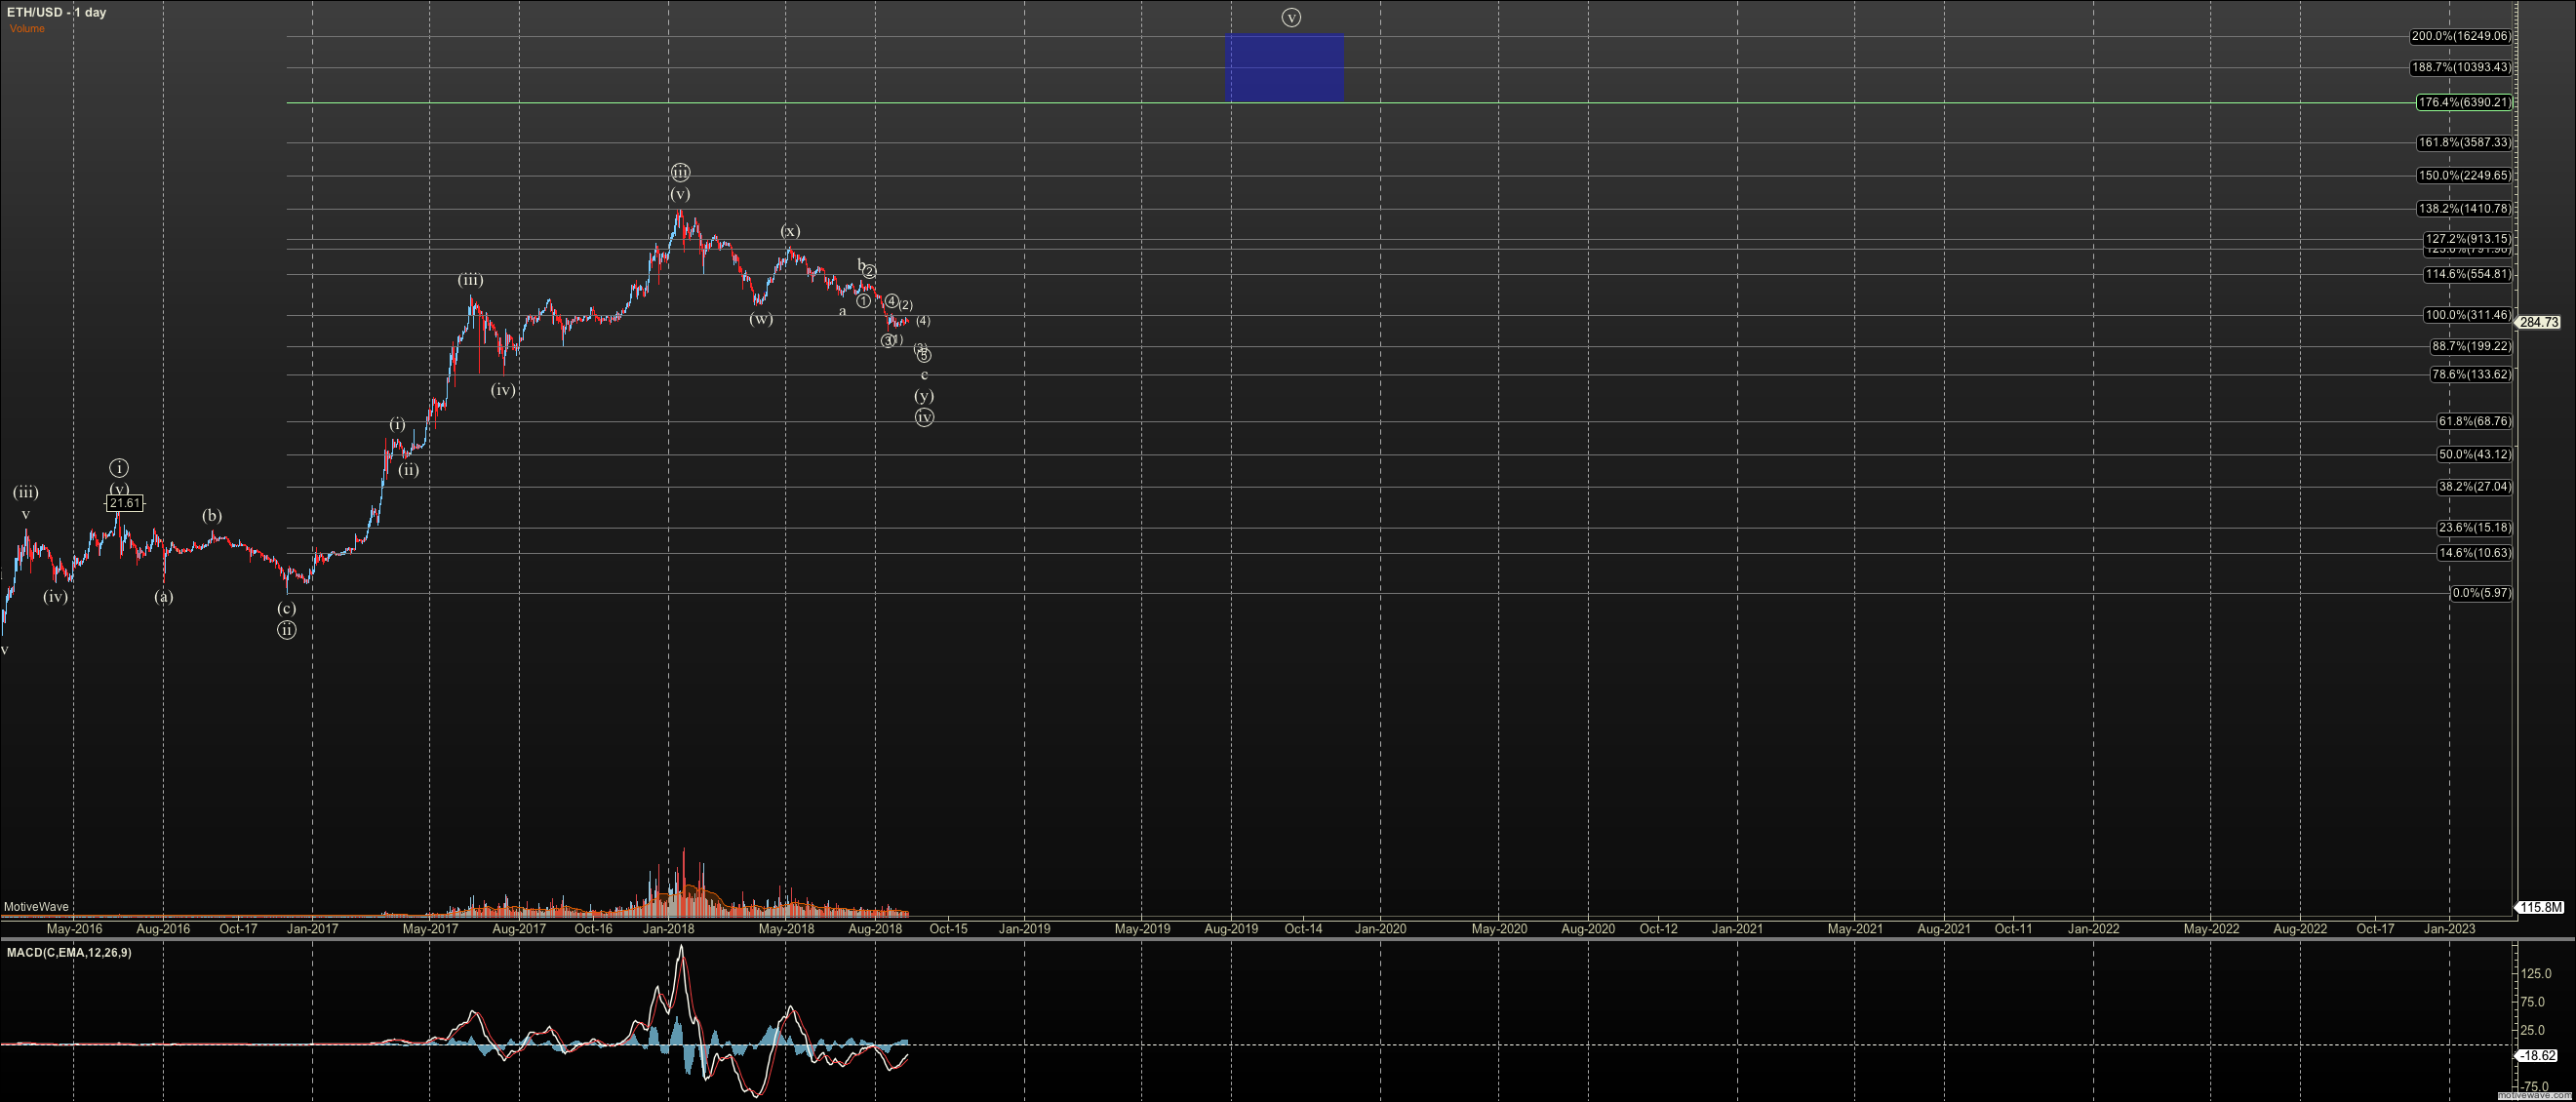
Ether remains much weaker than Bitcoin has a much clearer setup for one more big low. To recap this correction, we had a near direct hit of the 1.382 in January and now find ourselves approaching longterm support. I had already adjusted my long term count once since January when the April low didn’t hold. I now believe that we needed to bottom above $122 in a primary 4, where previously I held this correction as iv of primary 3, until the April low broke. If we break below $122, we do not have a clean impulse off the genesis of Ether, and so will consider that the bull market on the weekly chart in Ether is threatened.
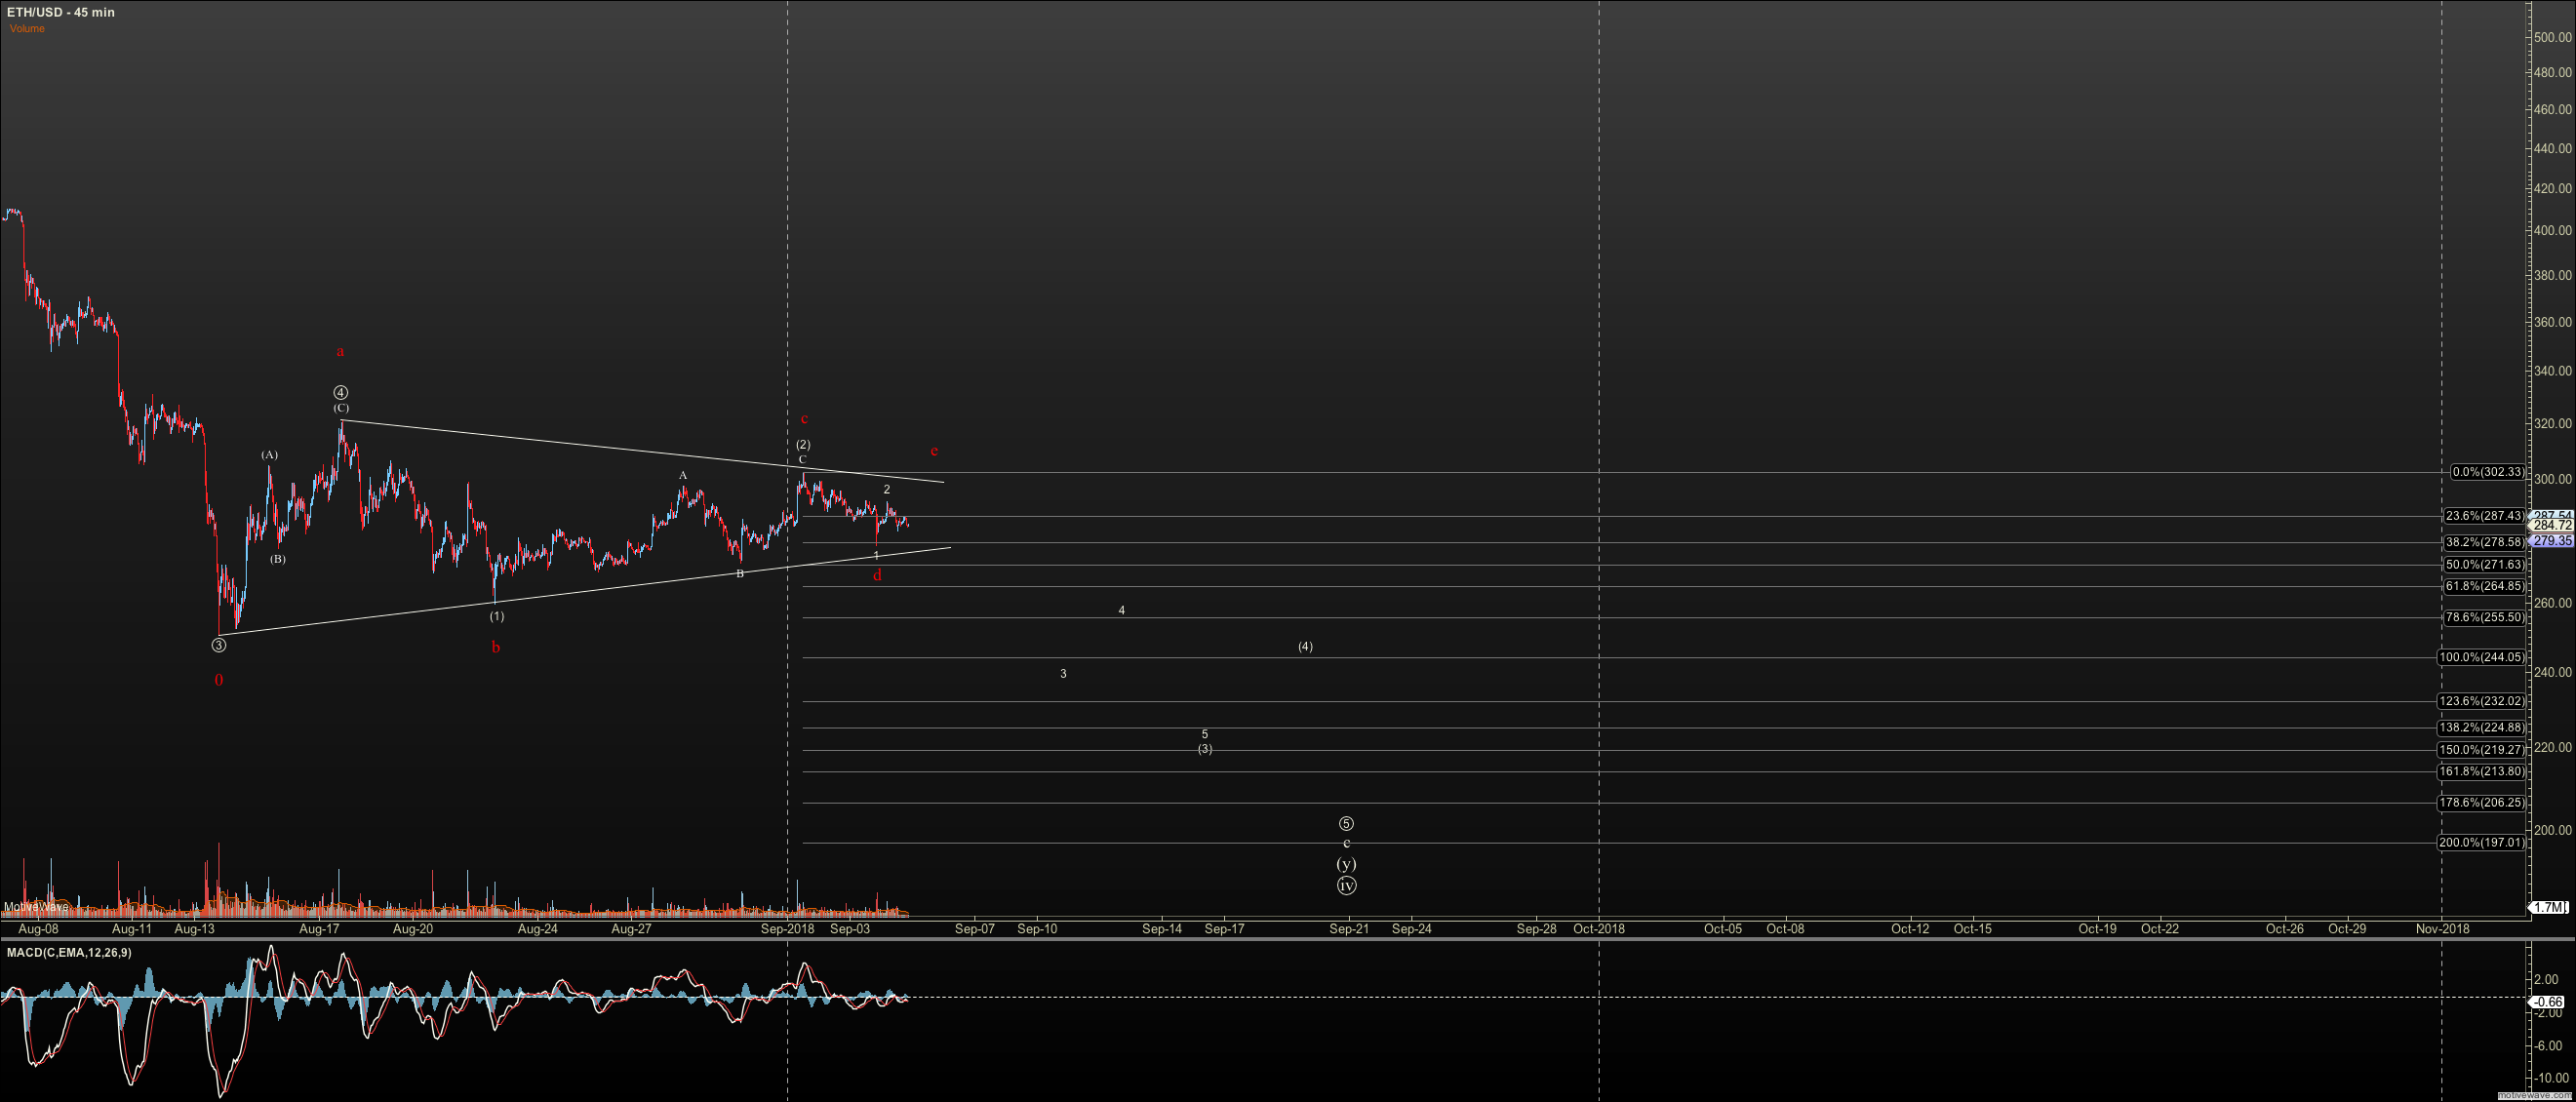
The good news is that we have confluence for a bottom ahead of that level, potentially at $200. Currently have a viable setup as nested 1-2’s, with near perfect fibs, except that it relies on a leading diagonal for wave 1. Price action and technicals are so clearly weaker than Bitcoin and so I have little doubt this setup will ‘fire’.
I can also see on the chart, that Ether may be trying to form a triangle before the final flush to $200. If so, then we need an E wave before it breaks the lower trend of the triangle. There is only a slight difference between the nested setup and this triangle which I’ve marked in red.
With Ether, we are nowhere close to breakout risk, needing $320 to be breached for the immediate setup, and well over $400 for a true breakout. Price has been too weak to make an effort for either level.
In Ethereum I am looking at the neckline of the correction, which also corresponds to the trendline in the triangle as a single the final wave of C has started.
Conclusion
We have reached another key juncture in the crypto market. I personally have expected that final flush to begin in earnest weeks ago but it has fought that view, particularly in Bitcoin. The big crypto rallied right up to ‘comfortable’ resistance and now put it as risk. Will we see breakout or breakdown? Obviously I prefer to see a more complete bottom and therefore down. But the market will makeup its own mind, let’s just hope it does quickly.
