Another Bounce Before Final Lows?
 By
Avi Gilburt
By
Avi Gilburt
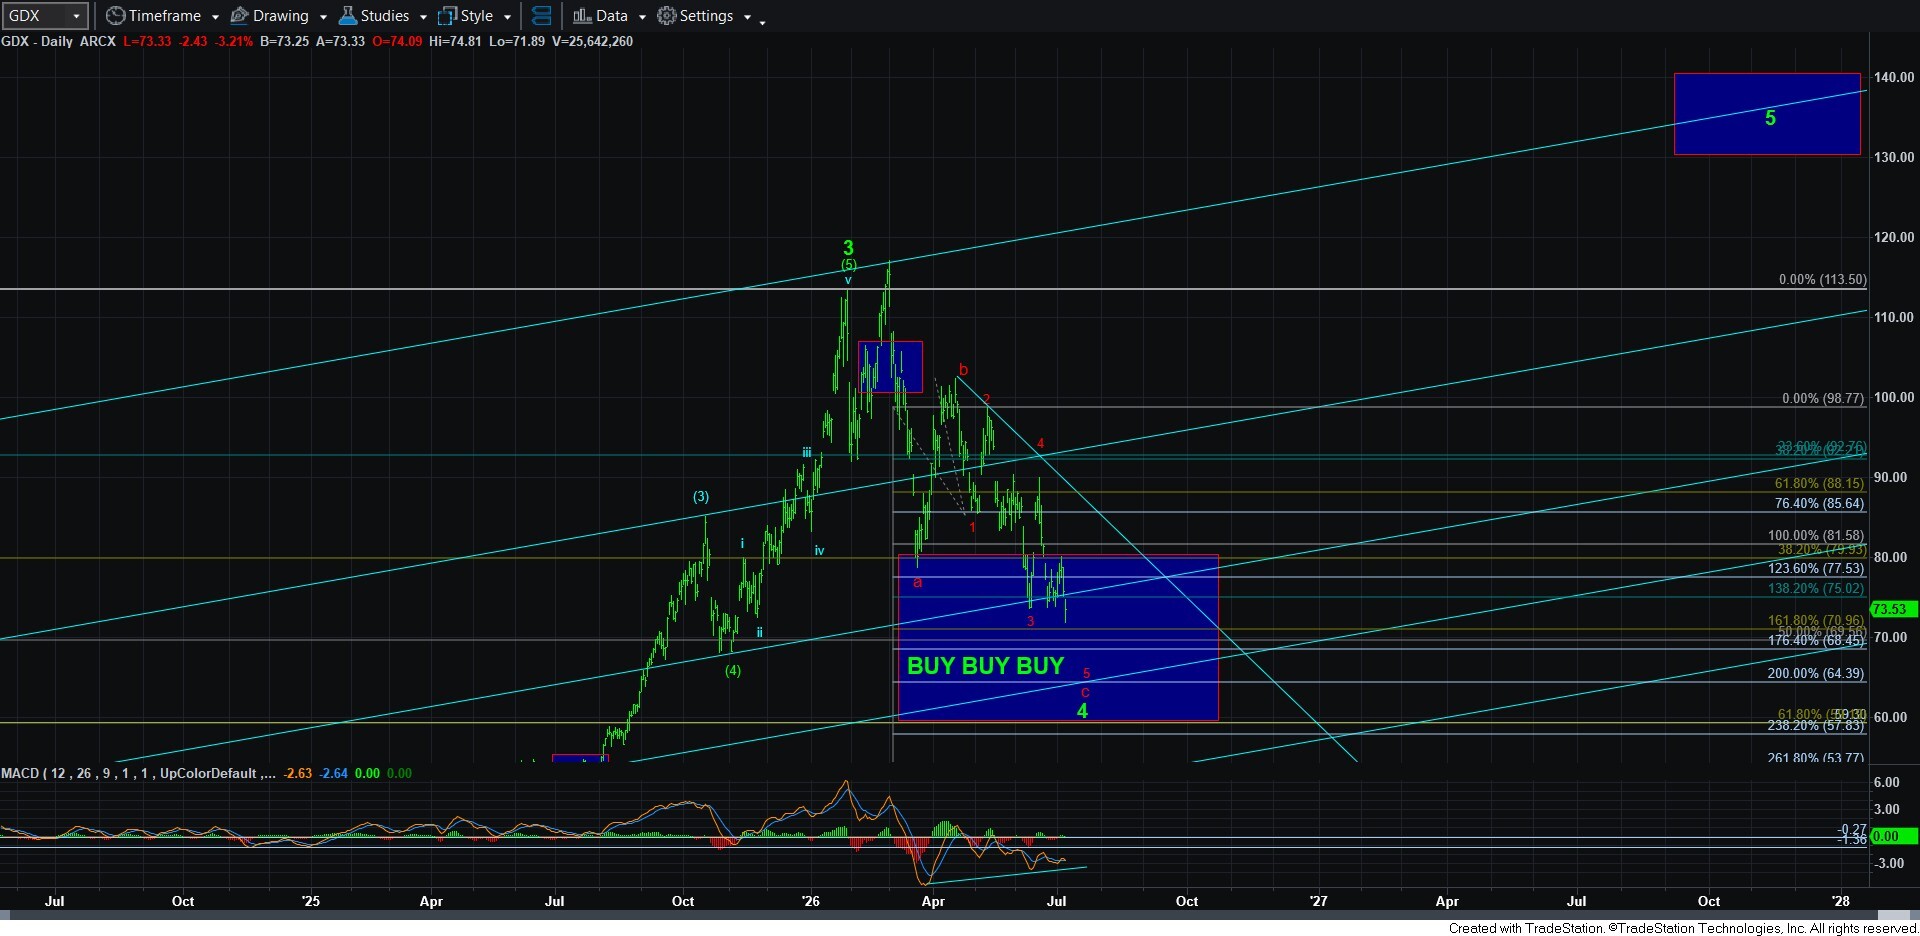
With the downside follow through, and GDX seeing a lower low just under 72, there is some potential that this correction could be completing sooner rather than later. But, for now, I still think we go lower and it could take a bit more time to get there as we could conceivably see one more loop higher before lower lows are struck.
So, let’s look at GDX first. The first point I want to note is that we came within less than a dollar of the ideal 64-71 target in GDX, as the market struck a low of 71.89 on this decline. Moreover, I want to note the very nice positive divergences we are seeing on the daily MACD as well. So, clearly, this could complete sooner rather than later, especially if we maintain below the pre-market high of 80.47, which is also the .382 retracement region of the initial leg lower from the wave 4 high.
Since there are quite a number of miners that do not look like their downside patterns are complete yet, as long as any bounce is corrective and we maintain below 80.47, I am going to expect that we drop deeper into the target zone of 64-71. It would take an impulsive rally through 80.47 to put me on warning that a bottom may be in place.
Now, despite the fact that GDX has made a lower low in this correction, both gold and silver have not yet. They leave the door open to this drop being a b-wave in an a-b-c corrective structure which can point us north of the recent bounce high before heading to lower lows.
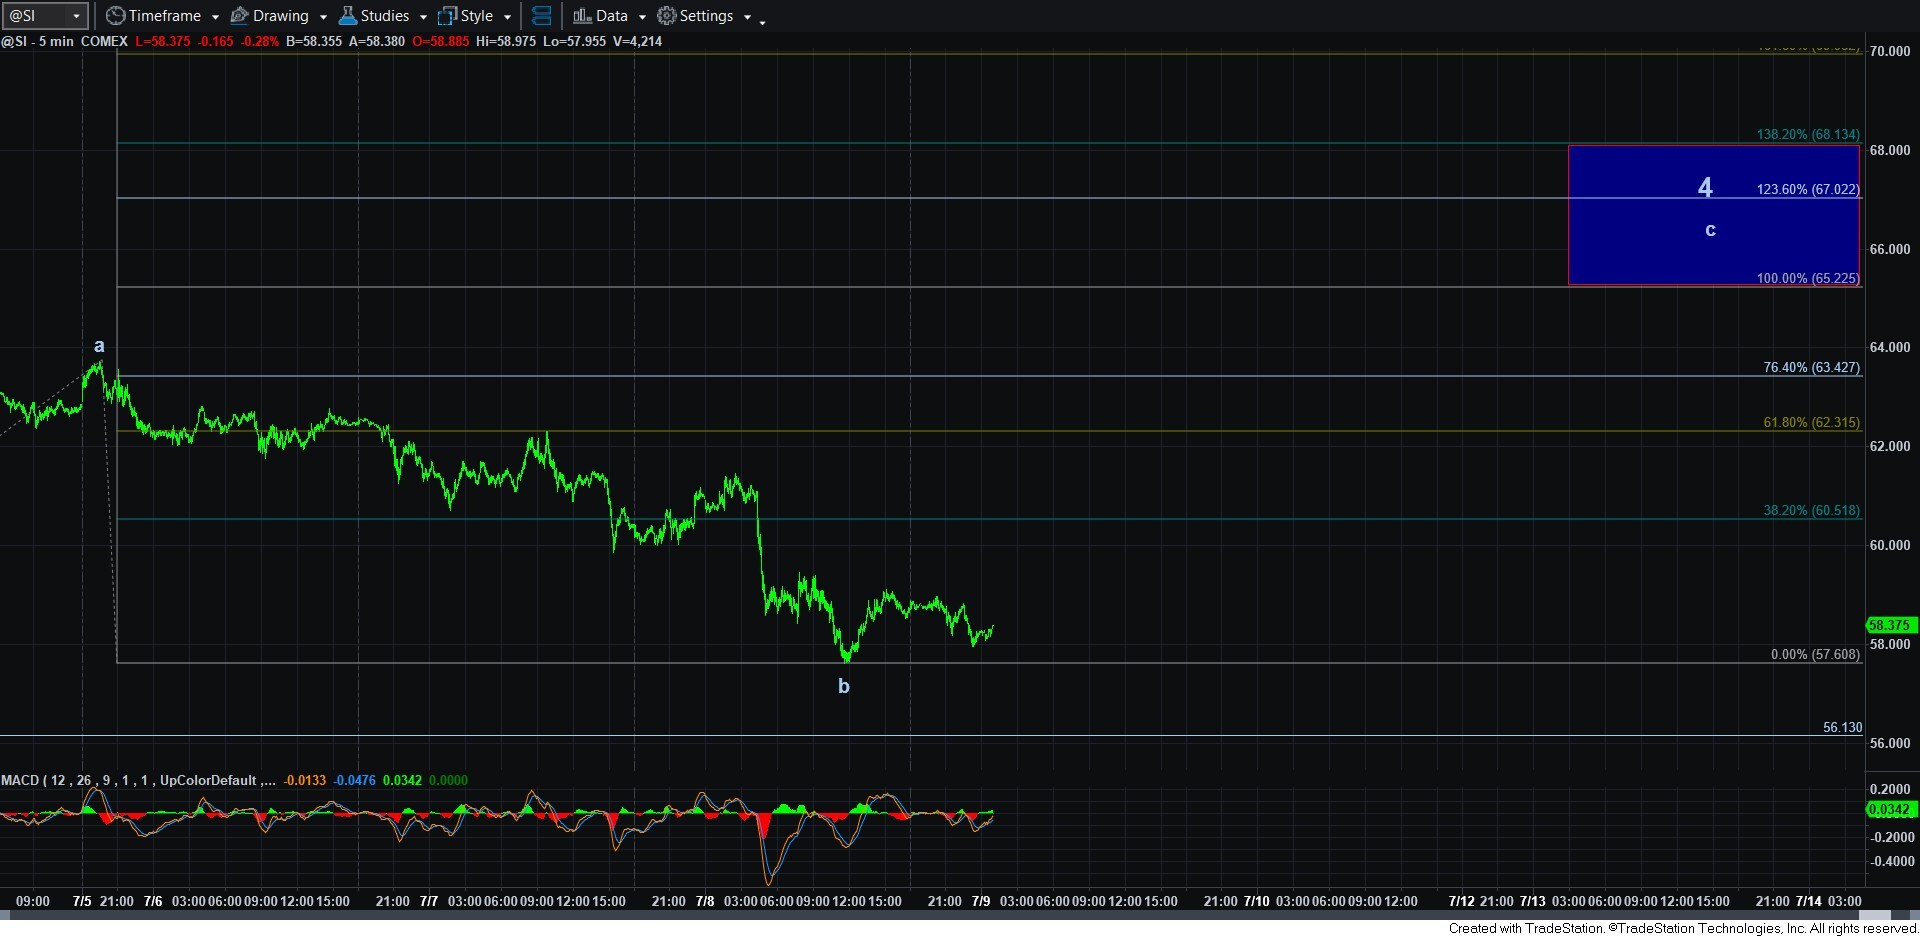
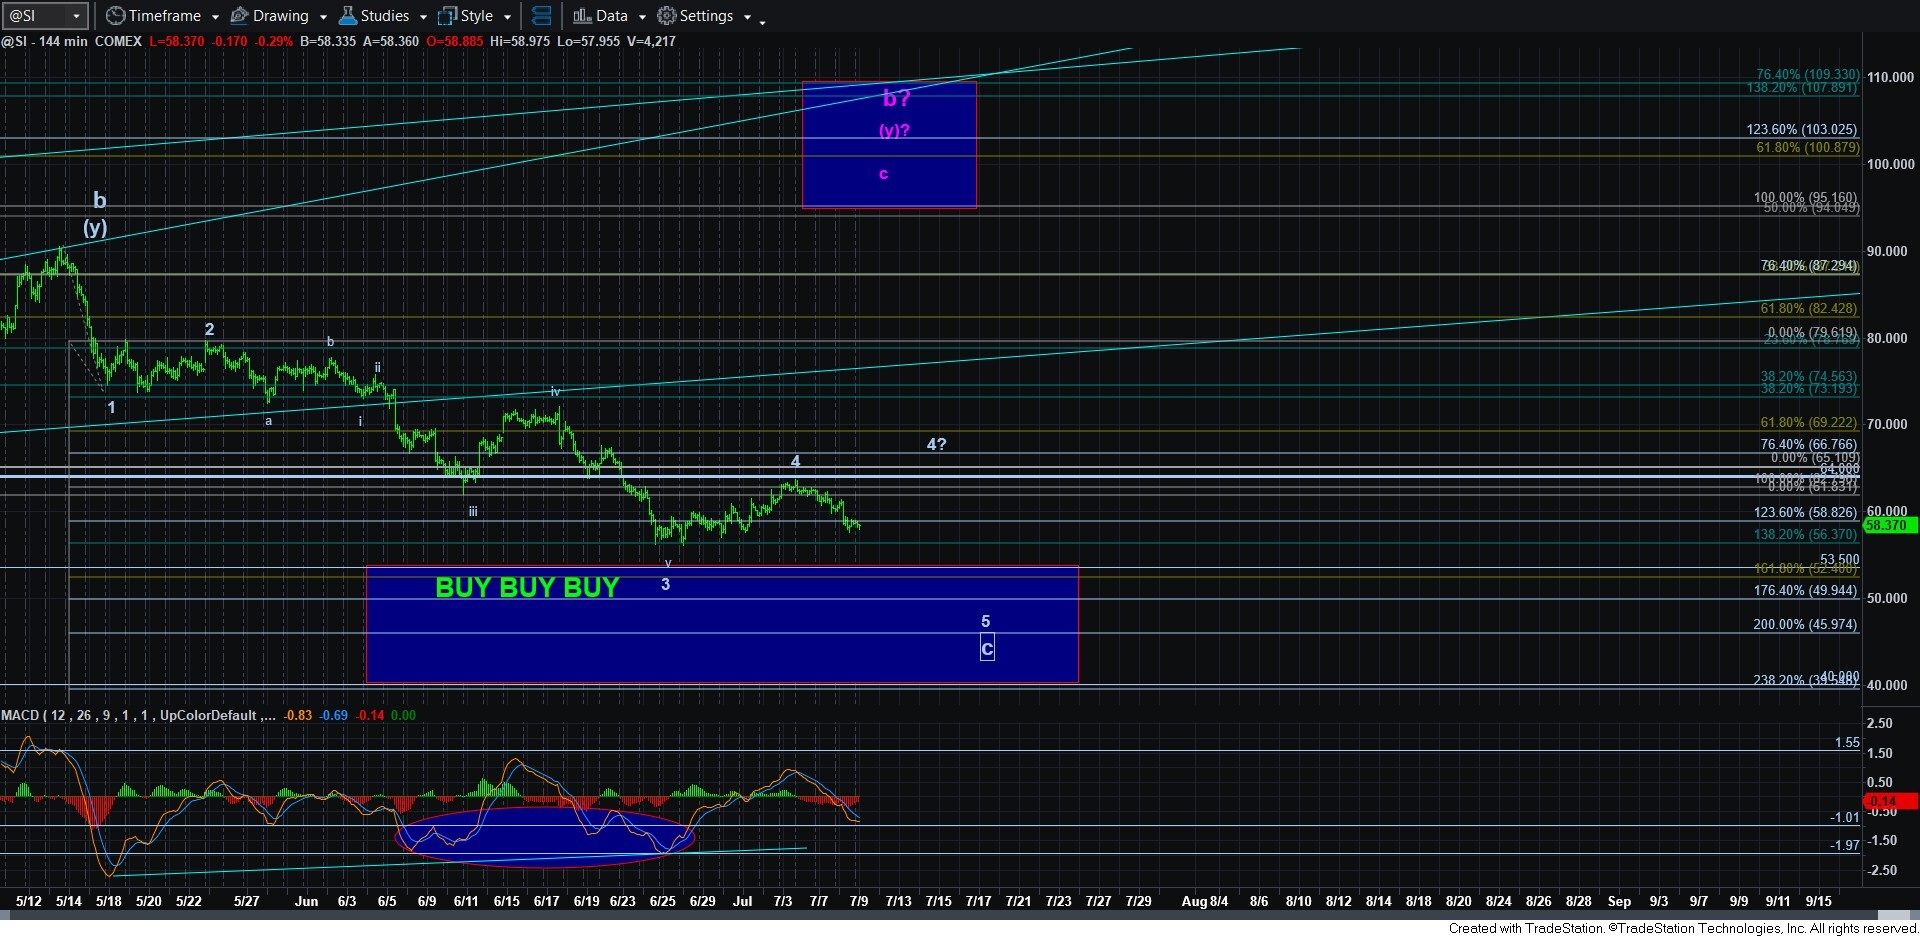
Silver MAY be setting up an a-b-c structure for the wave 4 as shown on the 13-minute chart. We would need a break-out through the top of the resistance box at 68 to increase the potential that silver has a bottom in place.
I want you to also remember that we are unsure as to what the next rally in silver will be. For now, I am expecting a large corrective (b) wave bounce within a much larger corrective structure in silver. However, if the initial rally off the lows is a CLEAR 5-wave structure, it does open the door that silver can take us to higher highs more directly, with 150+ as a potential target. But, again, I suspect that we will simply see a corrective (b) wave bounce for now, but am open to either scenario all based upon the nature of the next bigger rally through the 68 region. Yet, consider that even a (b) wave bounce can take us back to the 95-120 region.
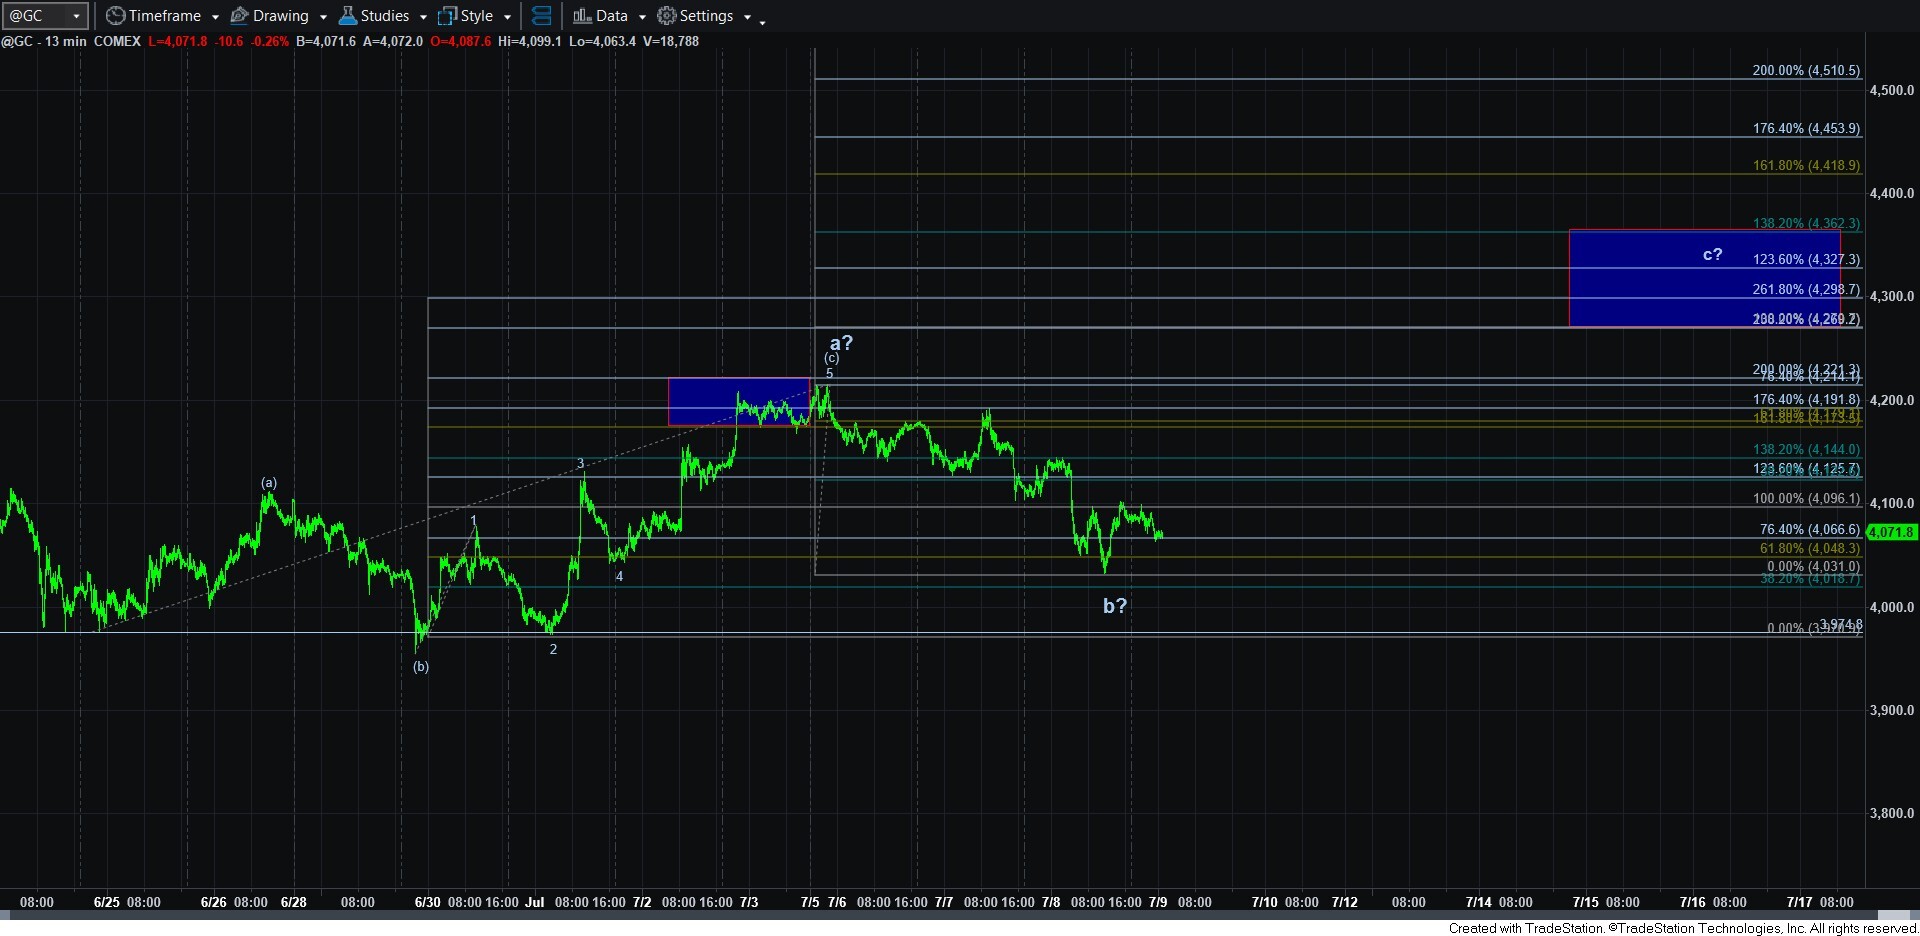
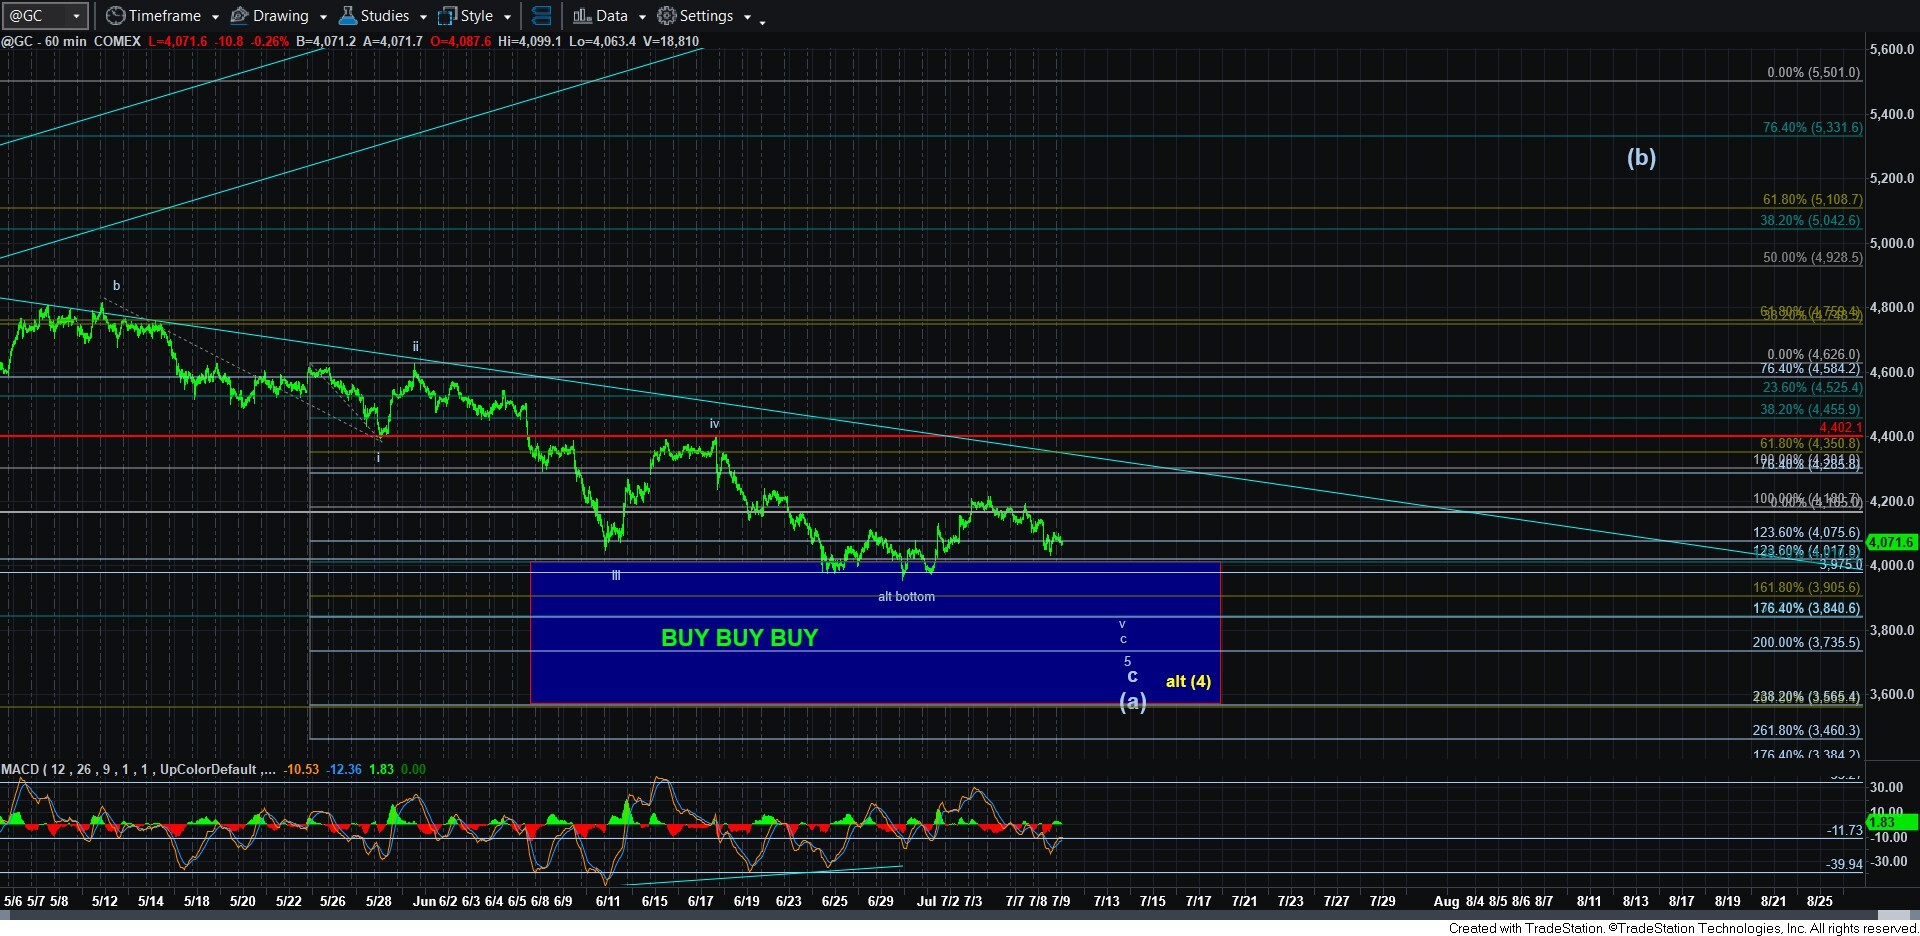
Gold is the one chart wherein I question whether the bottom has already been struck. But, I am maintaining a primary count which expects one more lower low. In the bigger picture, I want to remind you that, similar to silver, gold may only provide us with a bigger corrective (b) wave bounce over the coming months once this bottom has indeed been struck.
In the smaller degree structure, you can see from the attached 13-minute chart that we can also reasonably see an a-b-c structure in gold off the recent lows, which can support one more rally for a c-wave. While that rally can carry us towards the 4400 region, it can either be an a-b-c rally that ultimately sets up one more decline to lower lows, or it can be start of that bigger (b) wave I mentioned above. And, unfortunately, I will not be able to tell the difference for some time.
For now, I am going to at least watch for this bigger a-b-c structure shown on the 13-minute chart, but also keeping options open that we may only see a corrective bounce in the coming days leading us to lower lows in a more direct fashion. From this perspective, gold is really the least clear of the 3 charts for now.
Overall, I cannot say for certain that the bottoms are in place in the various charts, but that I would prefer lower lows across the board. Yet, I do want to also note that the market continues to feel out a bottoming process, and we can see the next rally begin at any time now. For this reason, I continue to layer into positions and added a bit more to my positions on this decline. Ideally, I am still leaving dry powder available for the lower lows I want to see before this segment of the correction finally ends.
Lastly, I want to remind you that the upside notations on my charts are not meant to deal in “time,” as they are just representative of the general targets I expect and are not taking any timing into account. So, please do not use these charts for “timing” purposes if you are using options.