An Important Update On The Energy Sector
 By
Levi
By
Levi
- We share an important update from the fundamental area of our analysis team.
- Then, we take a look back at some of our pivotal calls from January 2021 and May 2022.
- What is the technical setup for some key energy names going forward?
by Levi at StockWaves, produced with Avi Gilburt
We see the energy sector at important inflection point right here right now. It may be that we find ourselves at a similar point as some of our other pivotal calls from the past two years. Let’s have a quick review.
It was back in the Fall of 2020 that we began to focus on several different energy names. We saw the entire sector as entering a moment in time where it would make a substantial low and then see a massive rebound from the depressed prices it was about to strike.
Here is one of the updates that we provided to the Seeking Alpha readership on January 10, 2021:
https://seekingalpha.com/article/4397923-riding-stock-waves-update-on-energy-sector
This was the basic takeaway from the article’s conclusion: “Due to the longer-term potential and the nice dividends on these I am happily sitting in shares but looking for a few more opportunities to add. Many do have very nice liquid options as well allowing for some trading around core positions.”
Now, fast forward to May 27th, 2022. The energy sector had been a sustained upswing. Bullish sentiment was overflowing, gushing even. However, this is exactly when we turned cautious. Note the updated shared with the Seeking Alpha readership here:
Here was the principal warning given: “We have now started to raise awareness for our subscribers that we are heading into thick resistance as the confluence of Fib levels for the targets for most of those moves. There is still room for extensions, but the risk SKEW is no longer very favorable.”
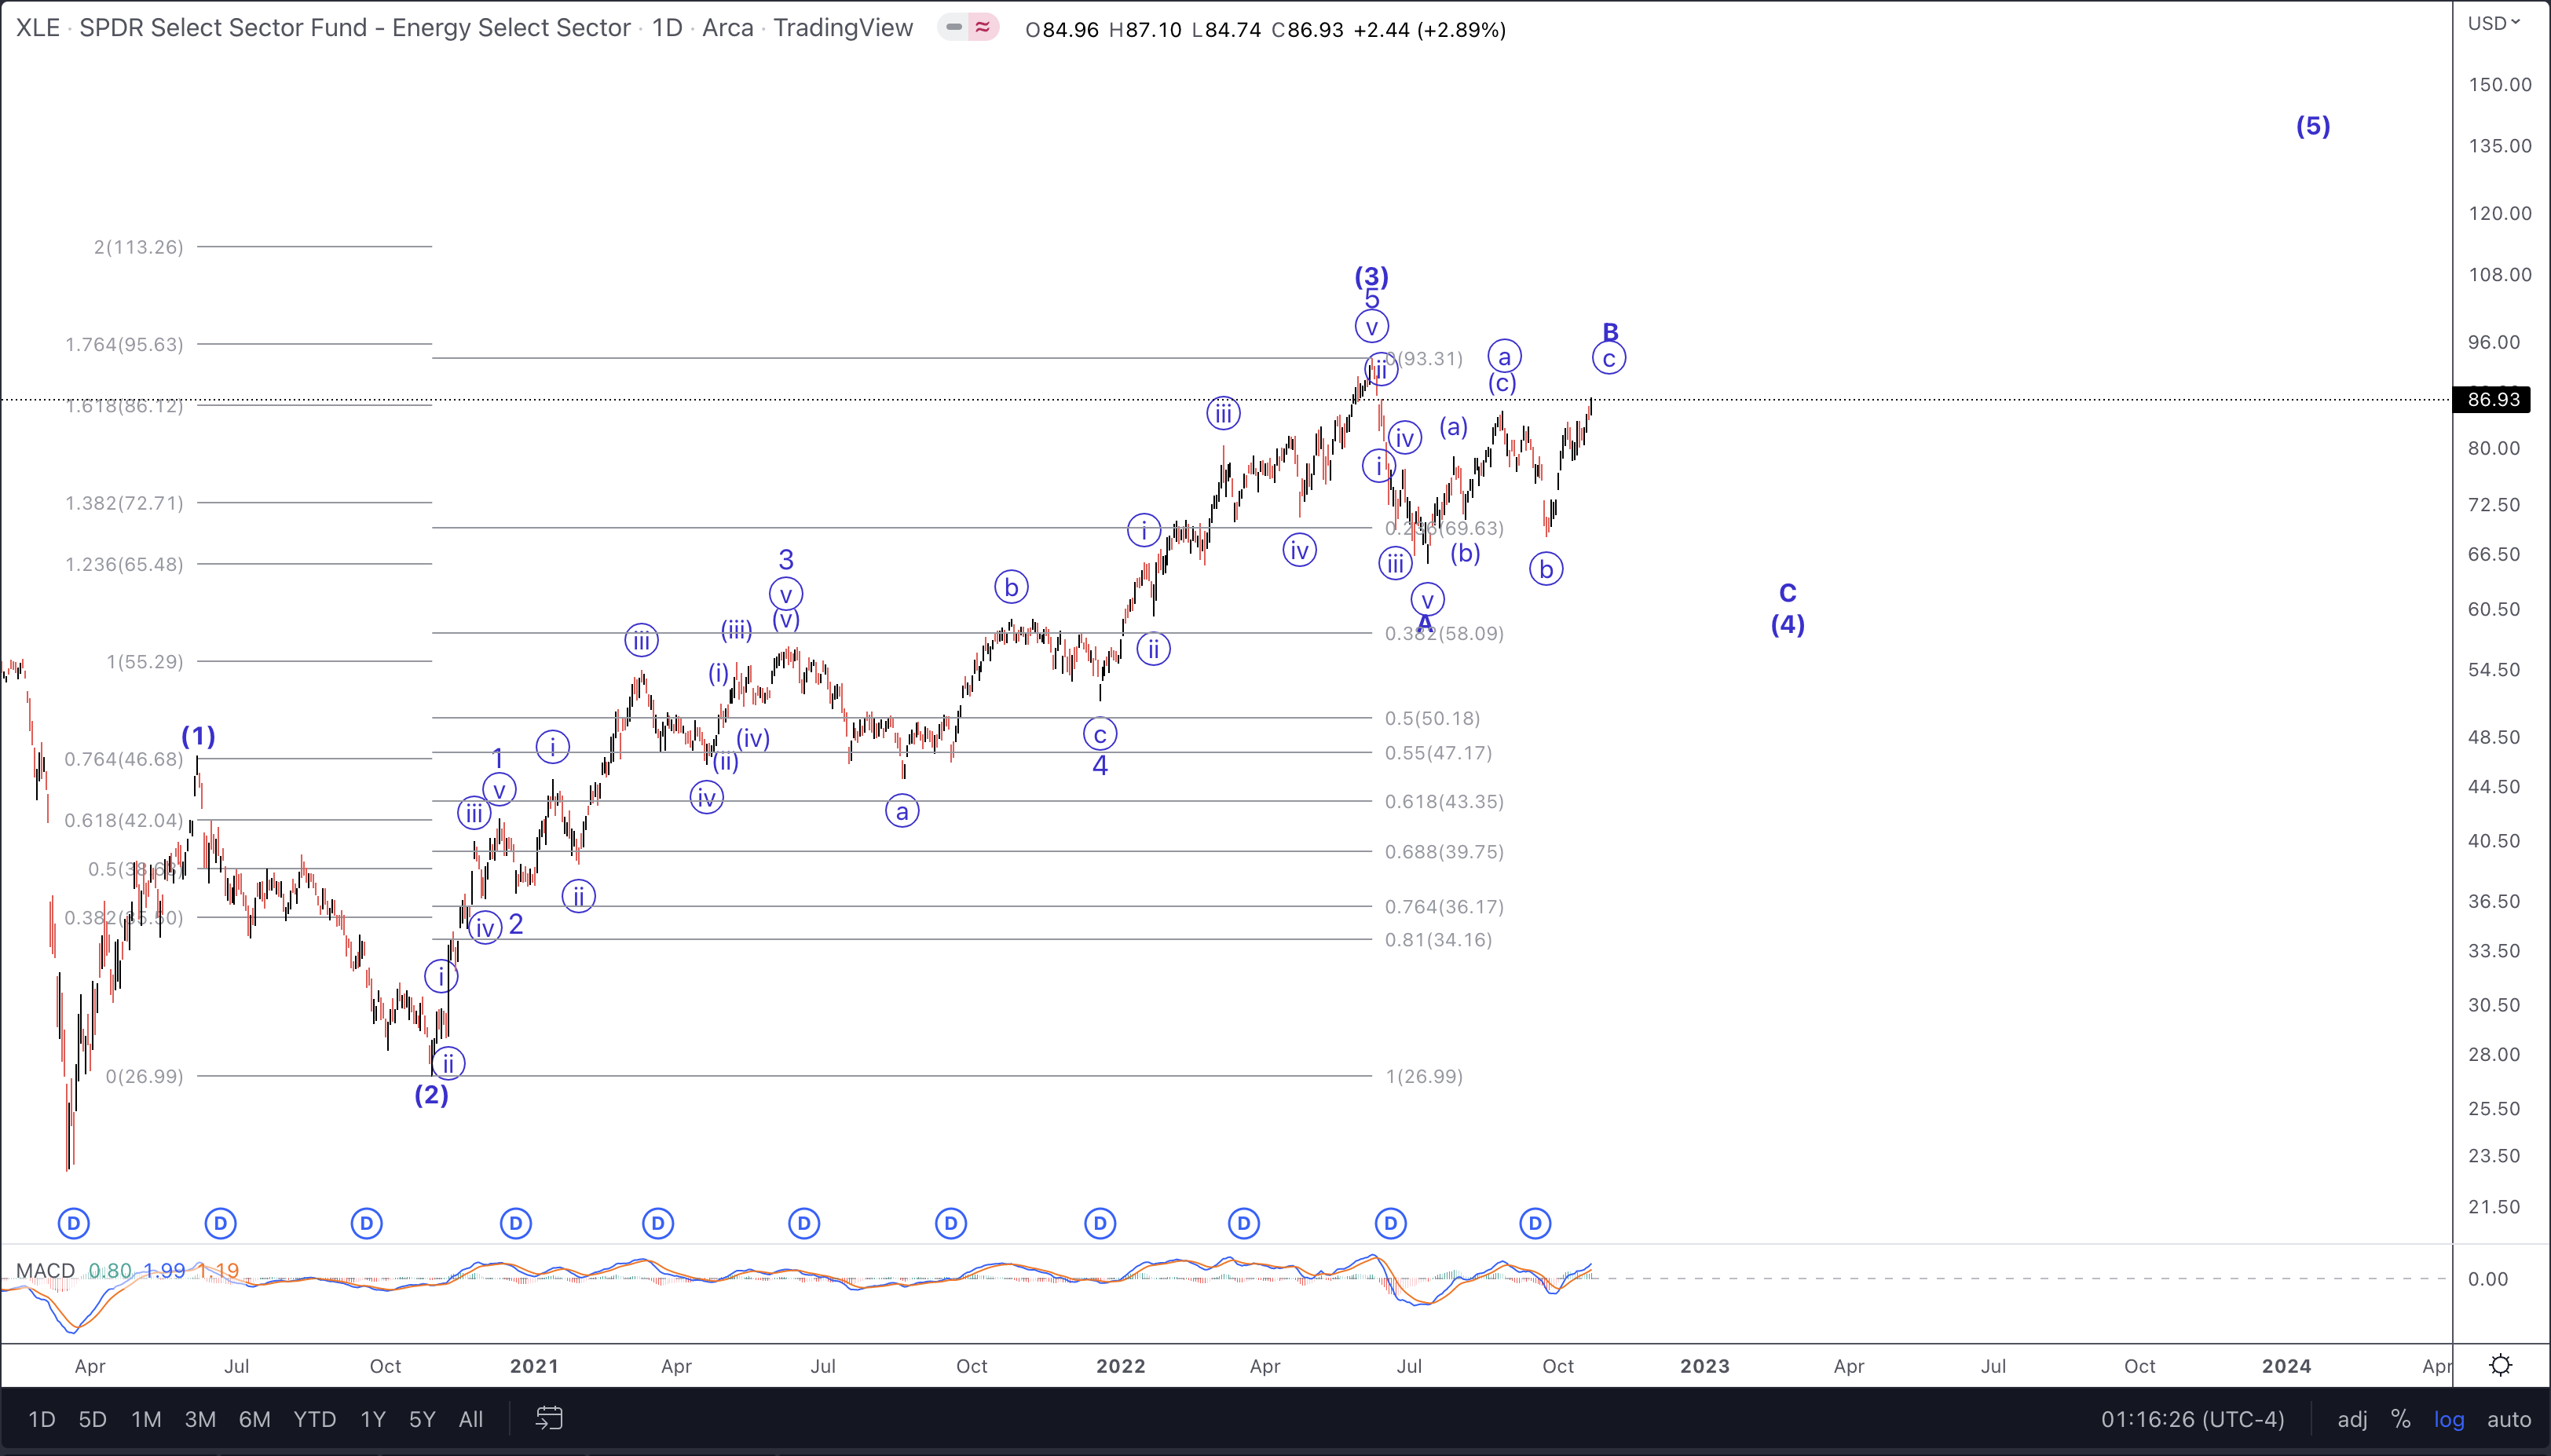
And, in fact, the energy sector found a major swing high on June 8th. Since then we have seen a corrective pattern develop and now should be entering it’s final phase.
We would like to take this opportunity to share Lyn Alden’s recent comments to our membership regarding the energy sector as a whole.
Energy Supply Problems
“As I’ve covered in a number of newsletters and reports this year, the Fed is trying to rein in demand to fight inflation. They are explicitly targeting a higher unemployment rate.
The problem however is that the supply side, particularly for energy, doesn’t have any clear path to resolution in the next few years. In fact, energy producers now have higher costs of capital to deal with on top of their other constraints, when it comes to bringing new oil and gas supply online.
Right now, oil is like a beachball held under water, meaning it structurally wants to head higher but is being held down pretty hard for the time being. We can review some of the supply/demand dynamics.
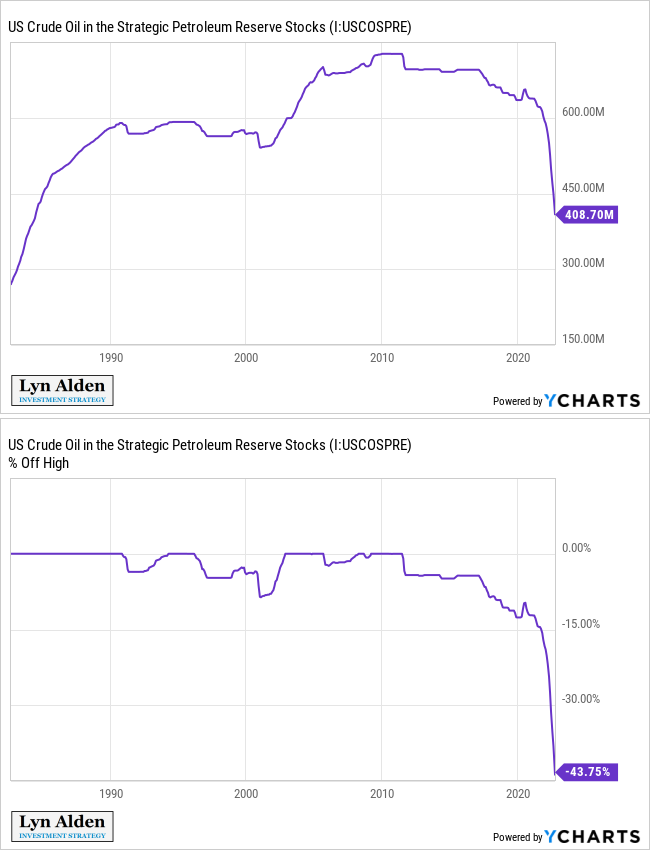
The US continues to draw down its Strategic Petroleum Reserve, which is a temporary supply boost to help stabilize the oil market prior to the midterm elections.”
(see Lyn's SPR Chart)
“The Biden Administration has issued an order of magnitude fewer drilling permits on federal lands than other presidents, measured by the first 19 months of an administration. This was part of his campaign promise to stop drilling on federal lands, but that promise is a lot more complicated now with higher energy prices domestically and for US allies.
The Fed is tightening monetary policy which hardens the dollar, slows the US economy, slows US corporate profits, and slows the economy of a lot of developing countries. This puts some downward pressure on oil demand.
Many European manufacturers have shut down due to extremely high energy prices. This will likely contribute to future inflation and/or shortages of things those manufacturers were making (including fertilizer and metals). Germany was an incredibly efficient machine at turning billions of dollars worth of cheap Russian gas into trillions of dollars of finished products for the world. That machine is now short-circuiting.
China continues to do a policy of “zero-Covid”, despite mounting issues with that. As the virus became more transmissible and less fatal over time, it became increasingly hard to contain. Much of the rest of the world has moved on with reasonable precautions for the most vulnerable populations, whereas China is still performing recurring major lockdowns on large percentages of its population. This removes considerable oil demand for things like jet fuel, gasoline, and certain industrial uses while it continues to persist.
OPEC+ is cutting its production quotas, and already has been failing to even meet their quotas. There is considerable evidence that OPEC+ is nearly at its current production limits. Furthermore, Russia was partly reliant on Western oil major capital and equipment, and with that gone, Russia may have trouble maintaining current production in future years.
There are places like Venezuela, Iran, Nigeria, and Libya that have a lot more oil production potential, but have been unable to get anywhere near their potential due to political or geopolitical problems. So those are unreliable or unpredictable swing variables.
Offshore oil still has a lot of potential but the project lifetimes are very long, with huge upfront capital costs and long payback periods. That is the type of project that companies have been hesitant to take risks on, but that in the coming years I think they’ll be increasingly turning towards out of necessity.
Europe will likely continue to increase LNG imports in the following years, which all else equal will keep prices elevated. North American companies can build more export capacity in the coming years which will likely exert upward pressure on North American gas prices, as the price differential between LNG and onshore gas narrows. This export capacity could be federally blocked, but that would be a big hit to US relationships with its allies and would be opposed by the US energy industry.
Europe will likely continue to substitute to other energy sources, which can include burning oil for electrical power (which is not as ideal as gas in terms of economics or the environment, but is a fallback option). Parts of New England in the US do this because they block the construction of natural gas pipelines from the nearby major Northeastern gas basins. This is often for environmental reasons but the result is higher electricity and heating prices for the region and ironically likely worse environmental outcomes.
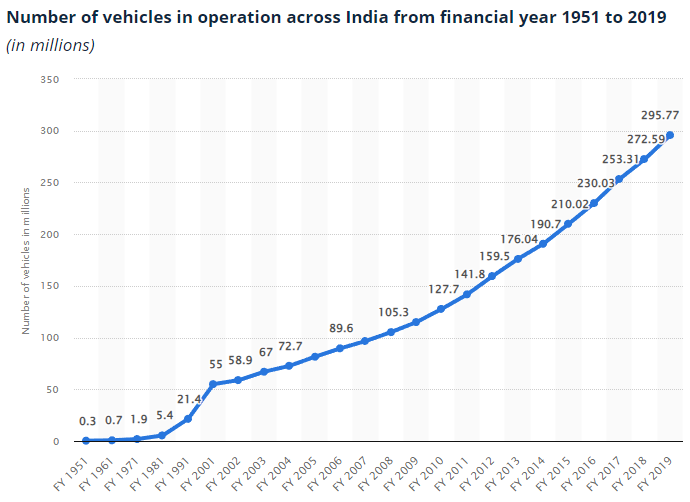
Emerging markets including India continue to consume more hydrocarbons. For example, India still only has around 10% air conditioning penetration, and the chart of the number of operating vehicles in India is up and to the right and still has pretty low penetration.”
(see India chart)
“The combination of all of this is that with global energy usage continuing to grind up slowly over time, when the US ends its SPR drawdowns, and if China ever decides to come out of its lockdowns, that can be a pretty big total swing in terms of oil supply and demand.
I am neutral with no firm view on energy prices over the next 3-6 months due to this aggressive attempt by central banks at demand destruction, but I am bullish for the years going forward.”
The Technical View
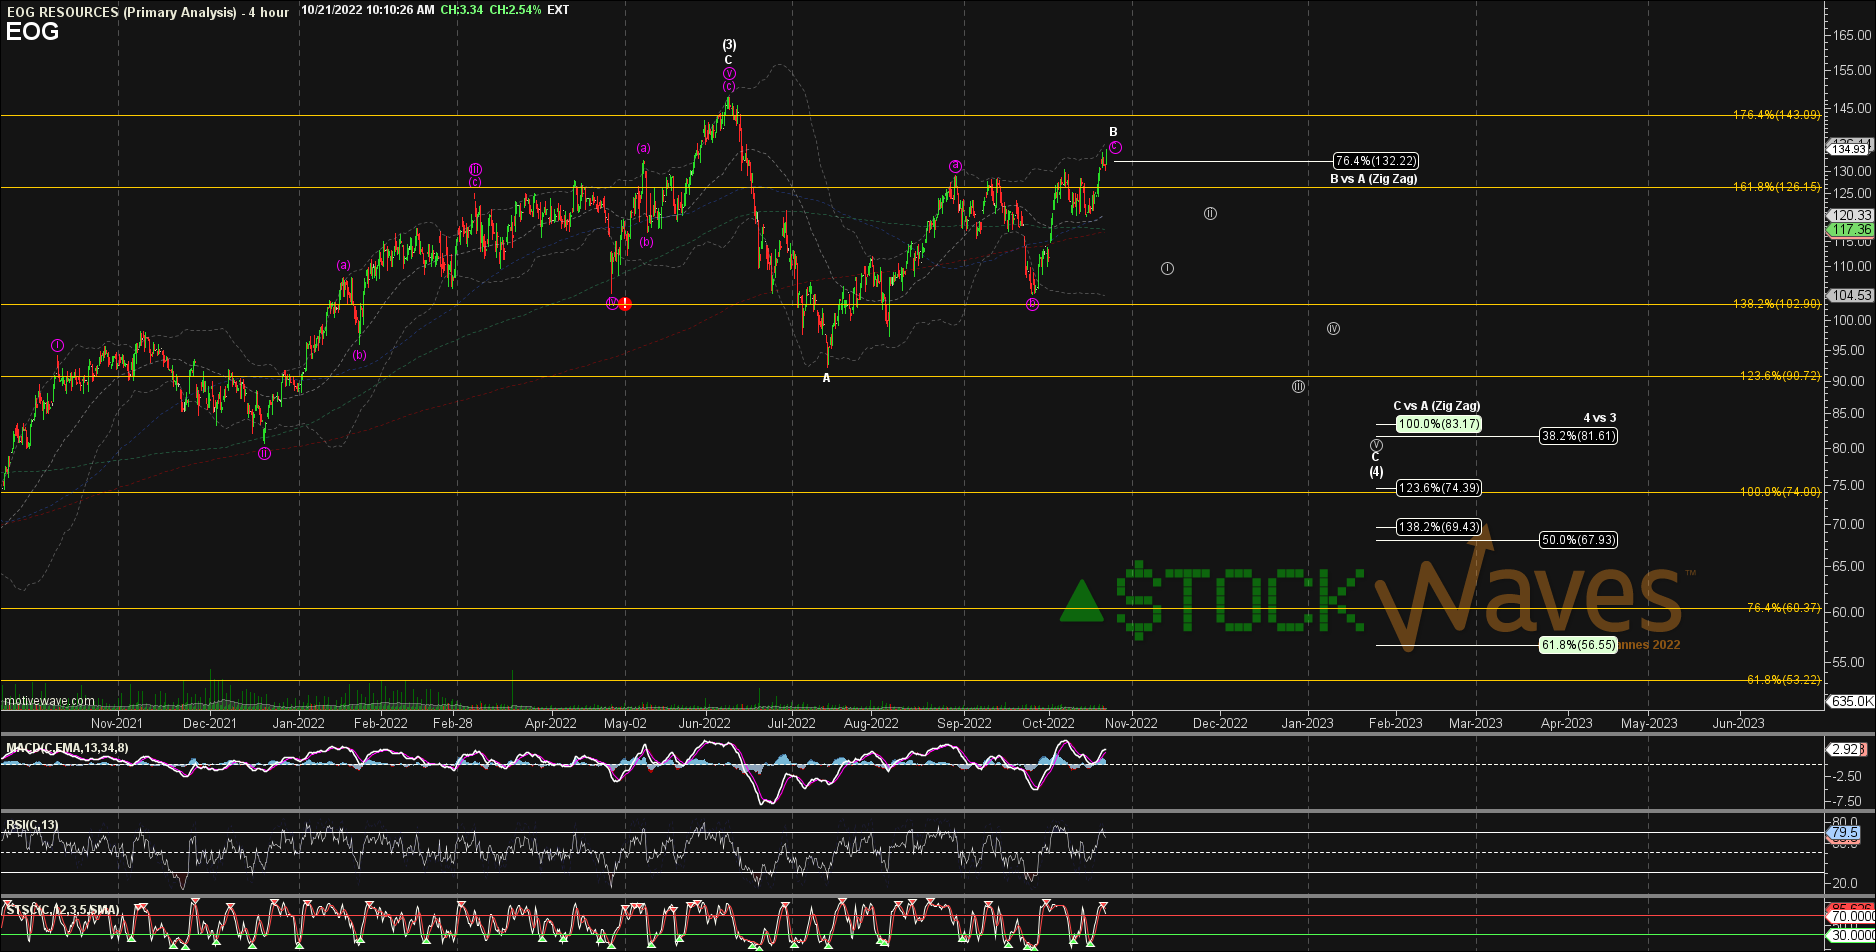
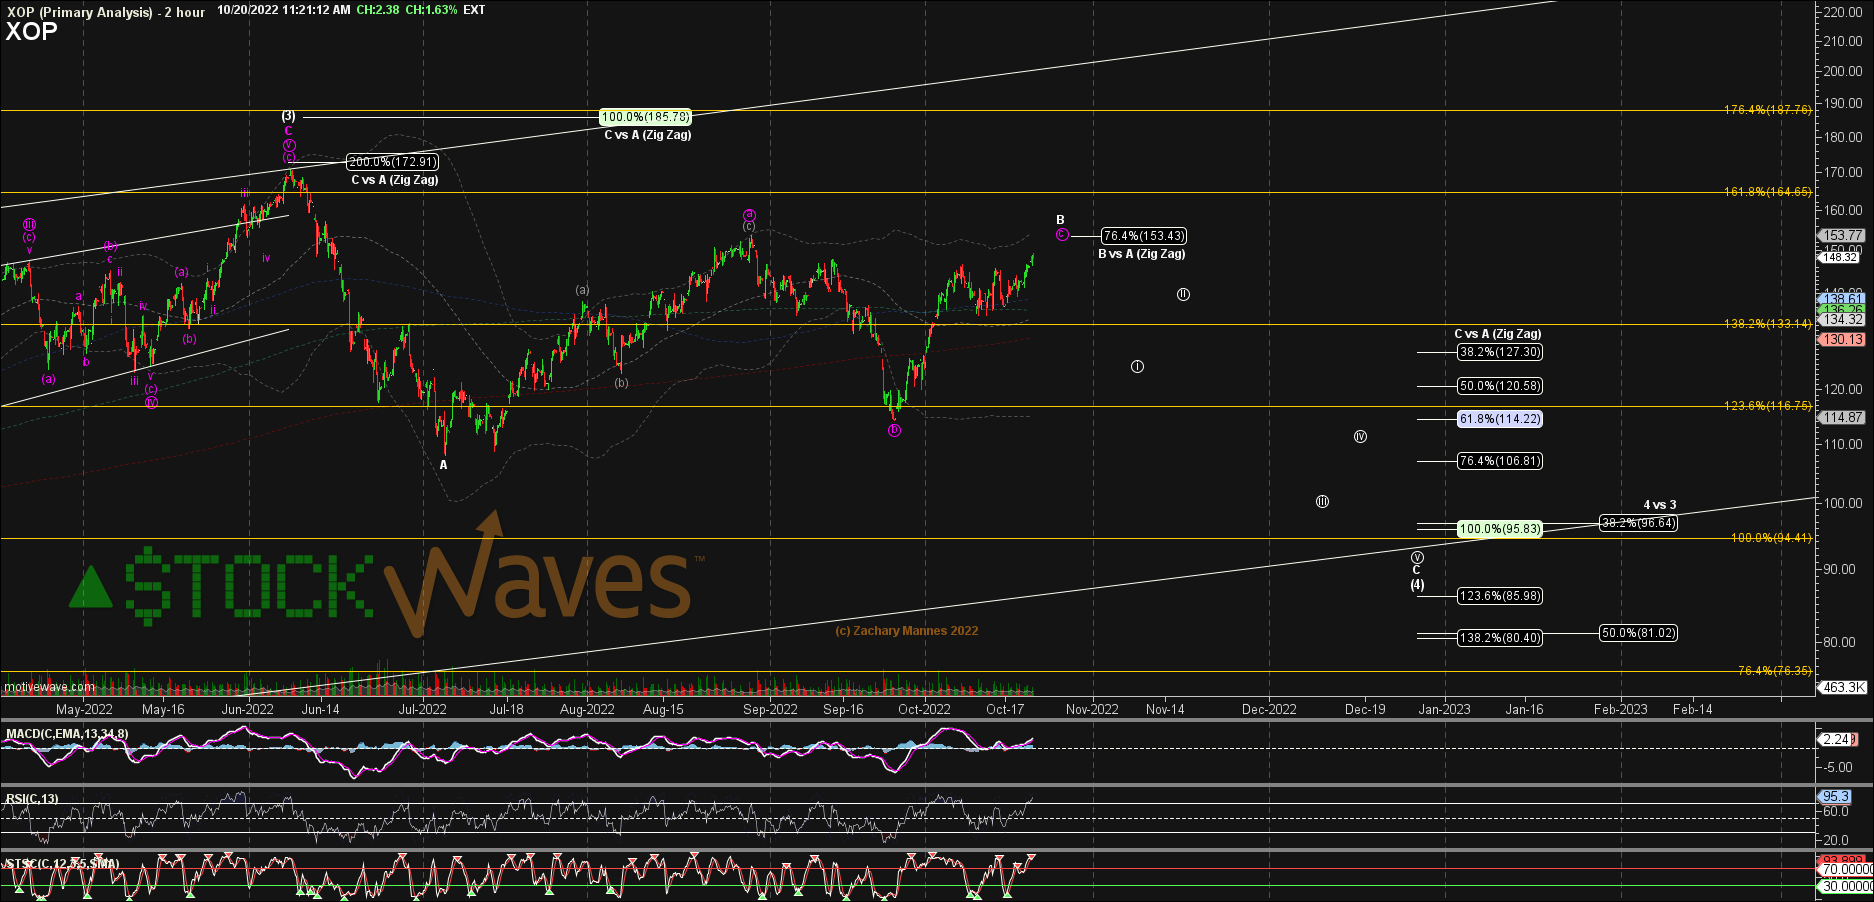
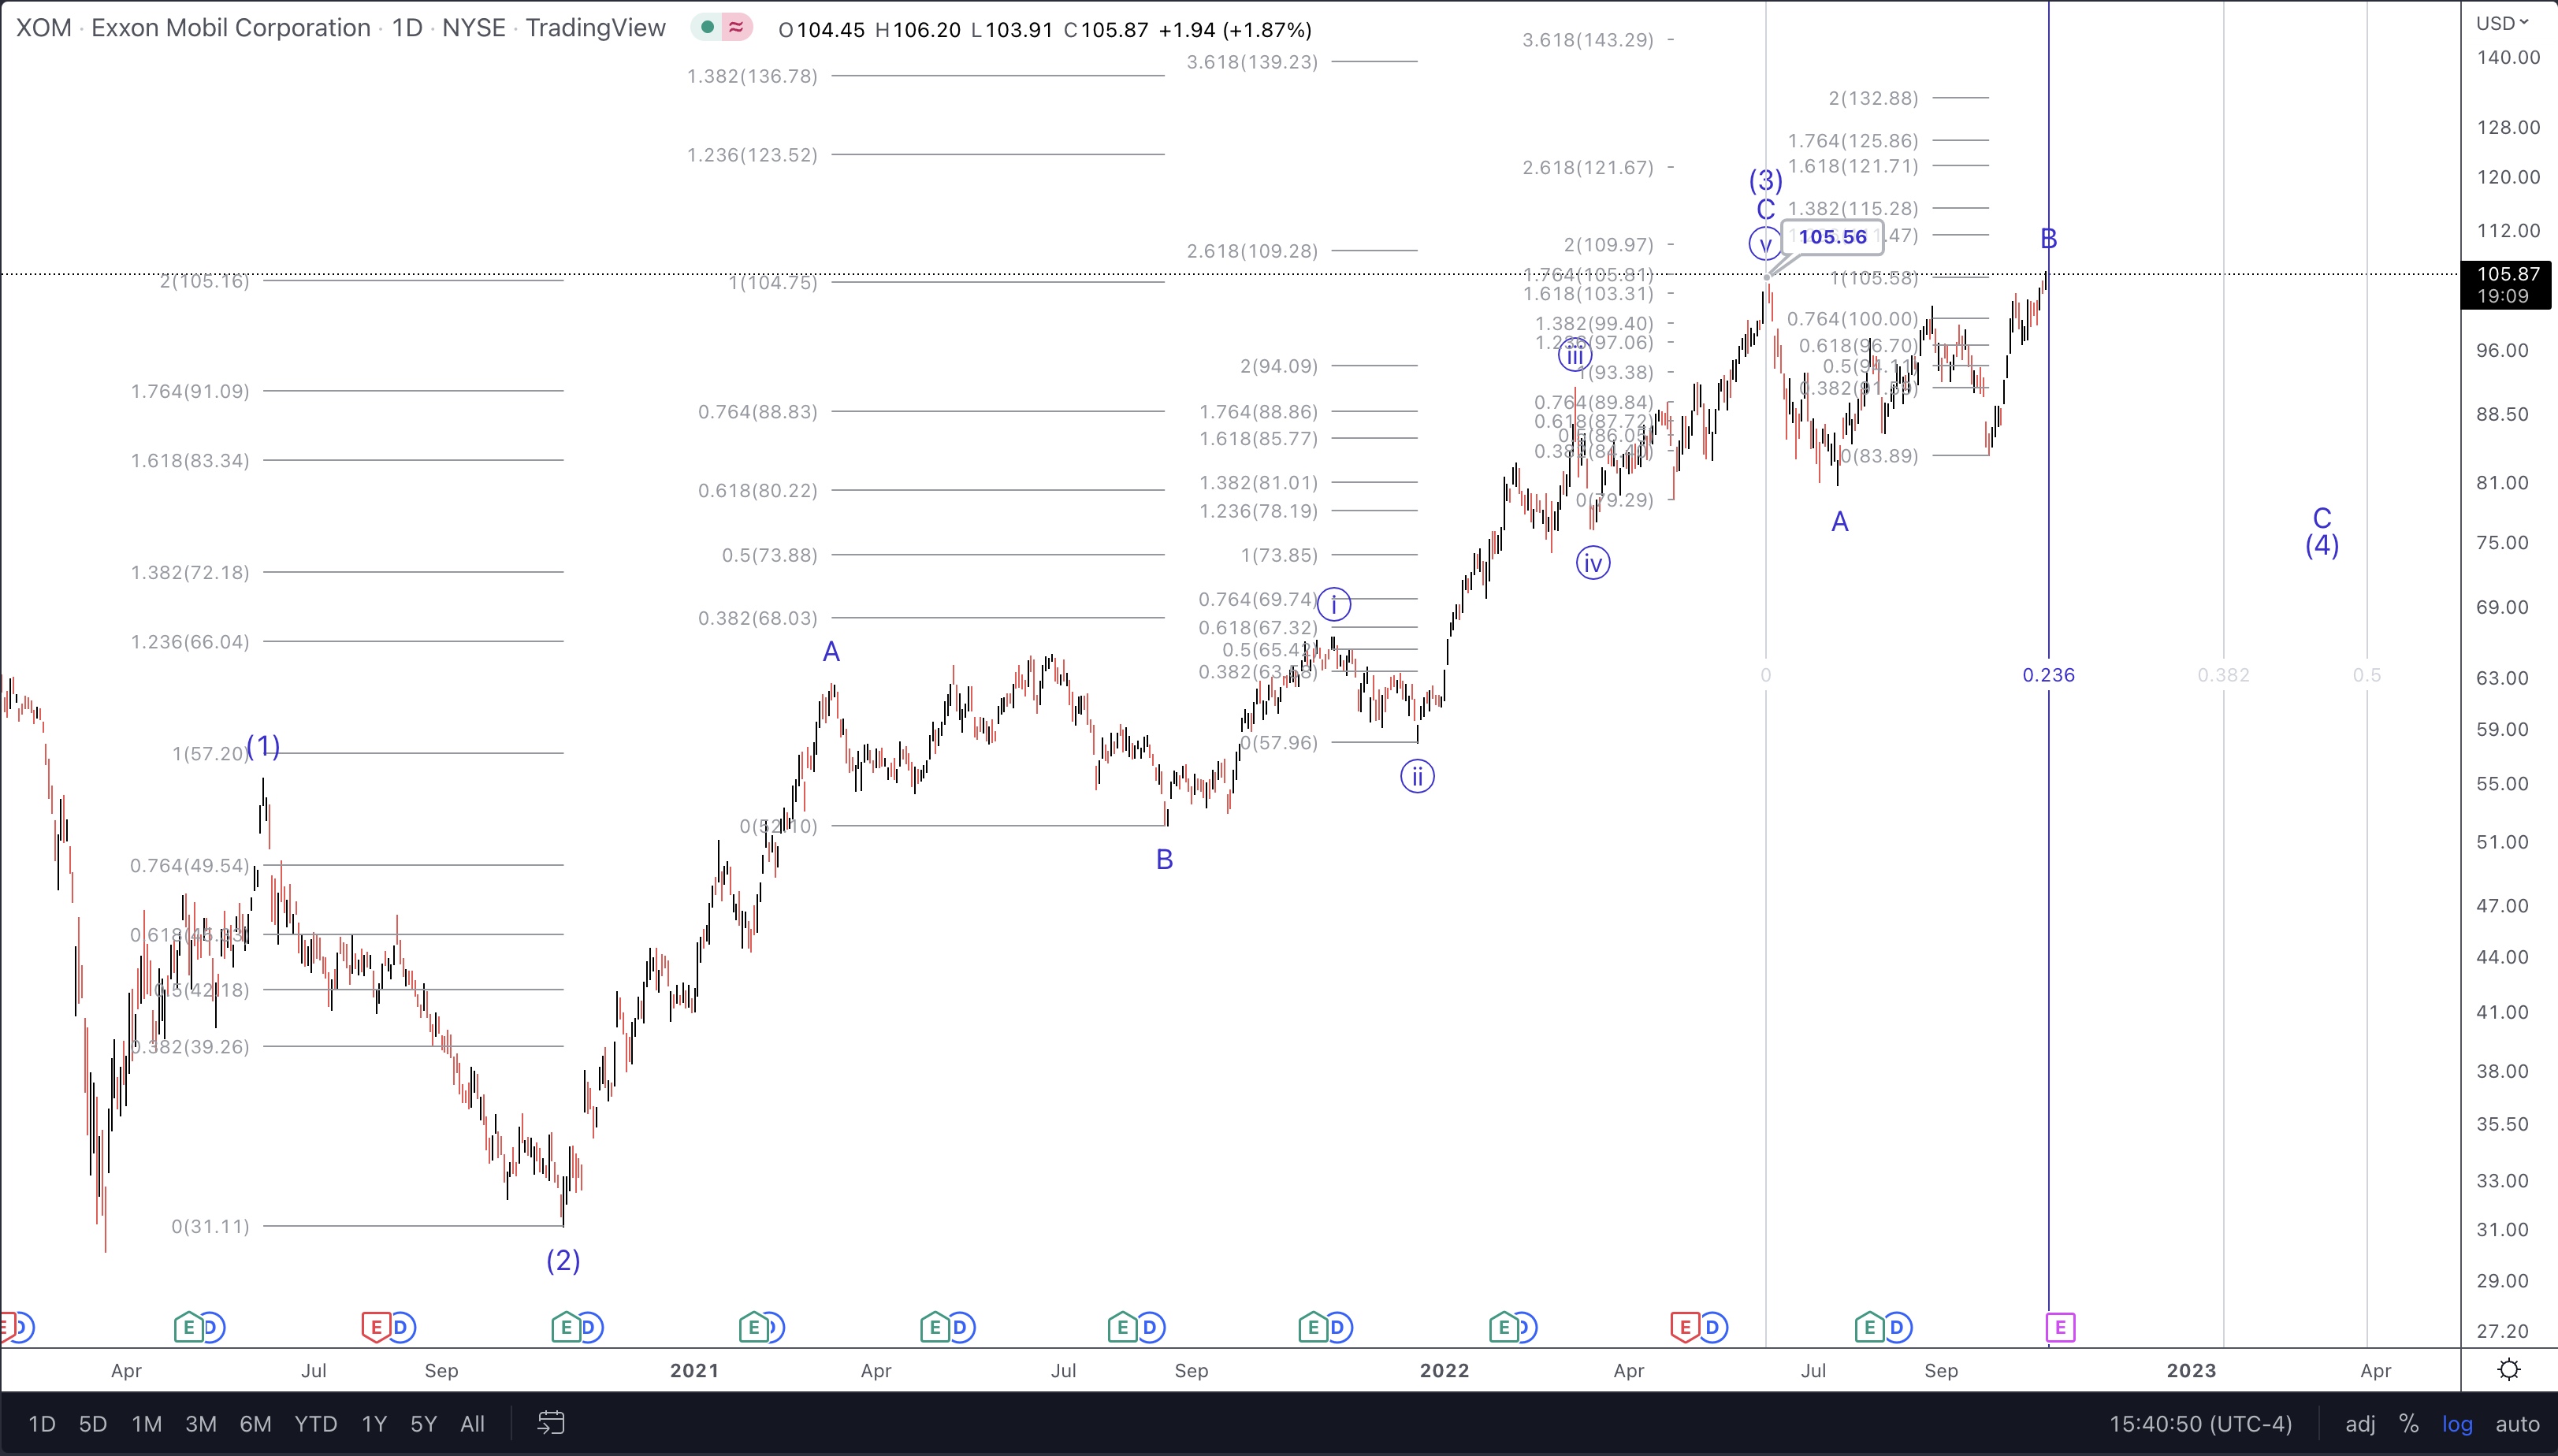
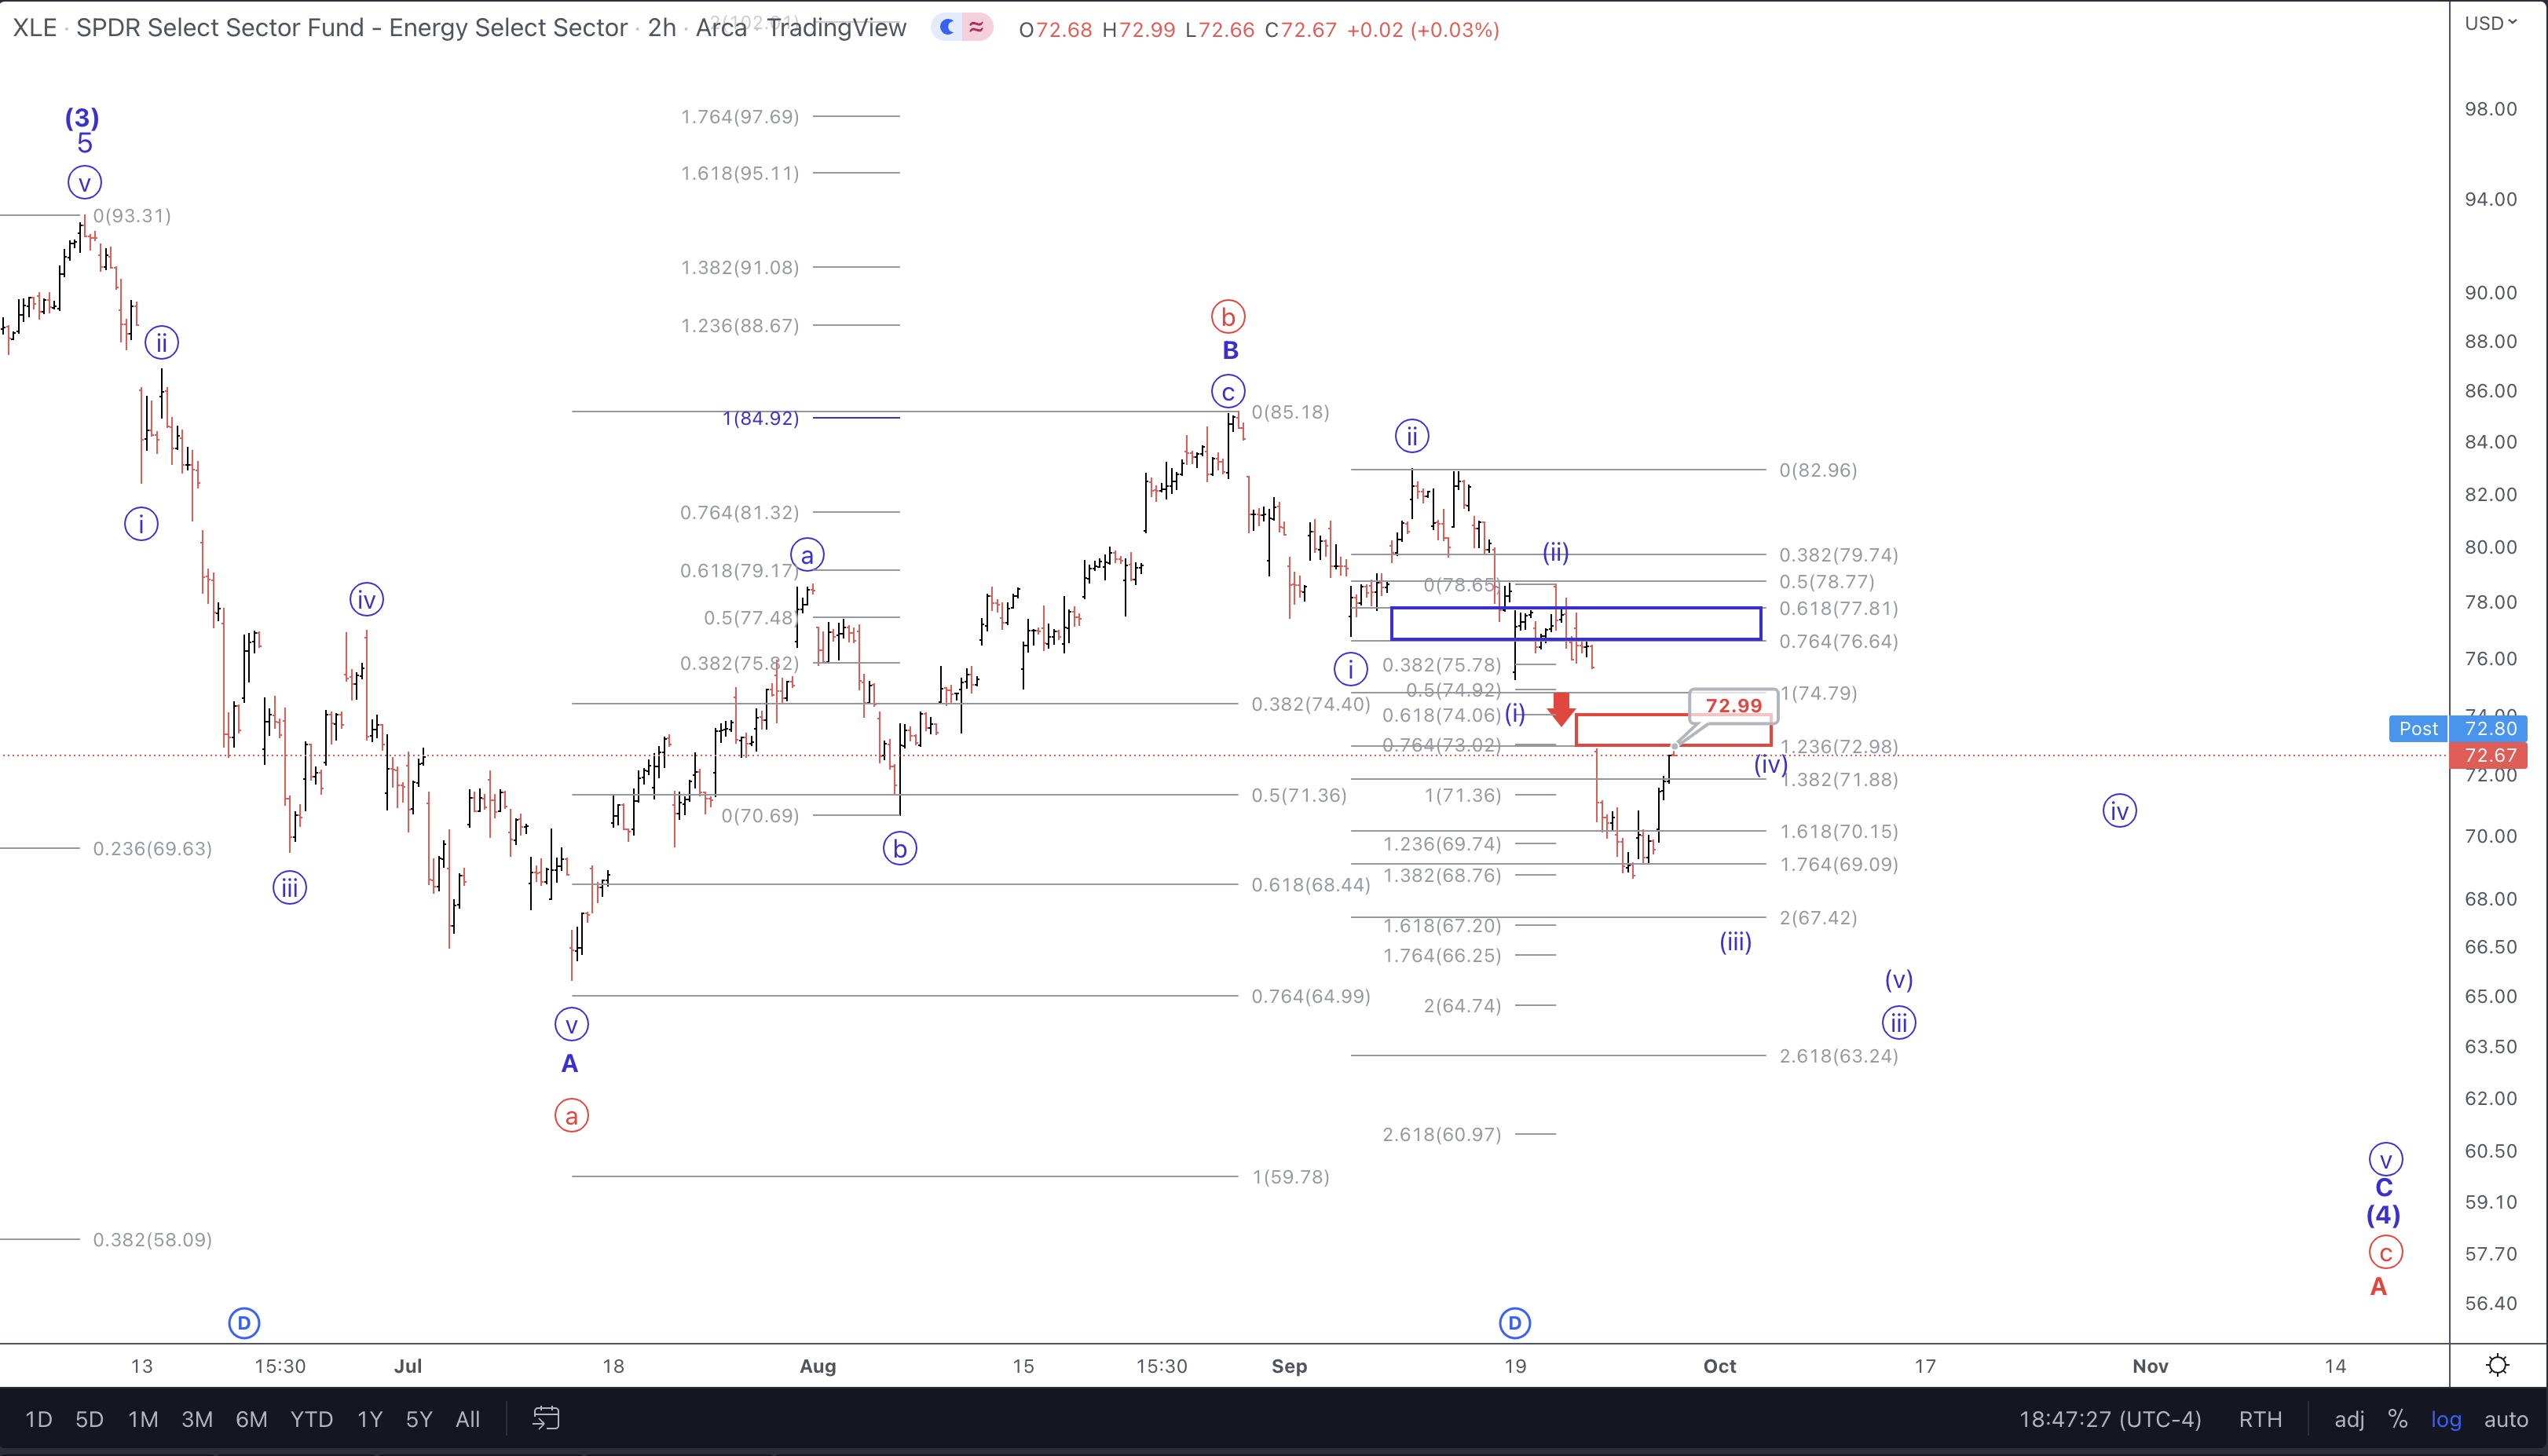
So, where does this leave us? One of the most standout data points from the recent decline is that it was 5 waves down from the June high. What does that mean? I would encourage you to review why we use Elliott Wave with Fibonacci Pinball in our technical analysis methodology.
You can see a 6-part series of articles published here on Seeking Alpha; part 1 is here:
https://seekingalpha.com/article/4198736-this-analysis-will-change-way-you-invest-forever-part-1
The basic premise of a 5 wave decline is that when we see this at the beginning of a corrective structure then the great majority of the times we will see a 3 wave corrective rally and then another 5 wave decline to complete the entire correction.
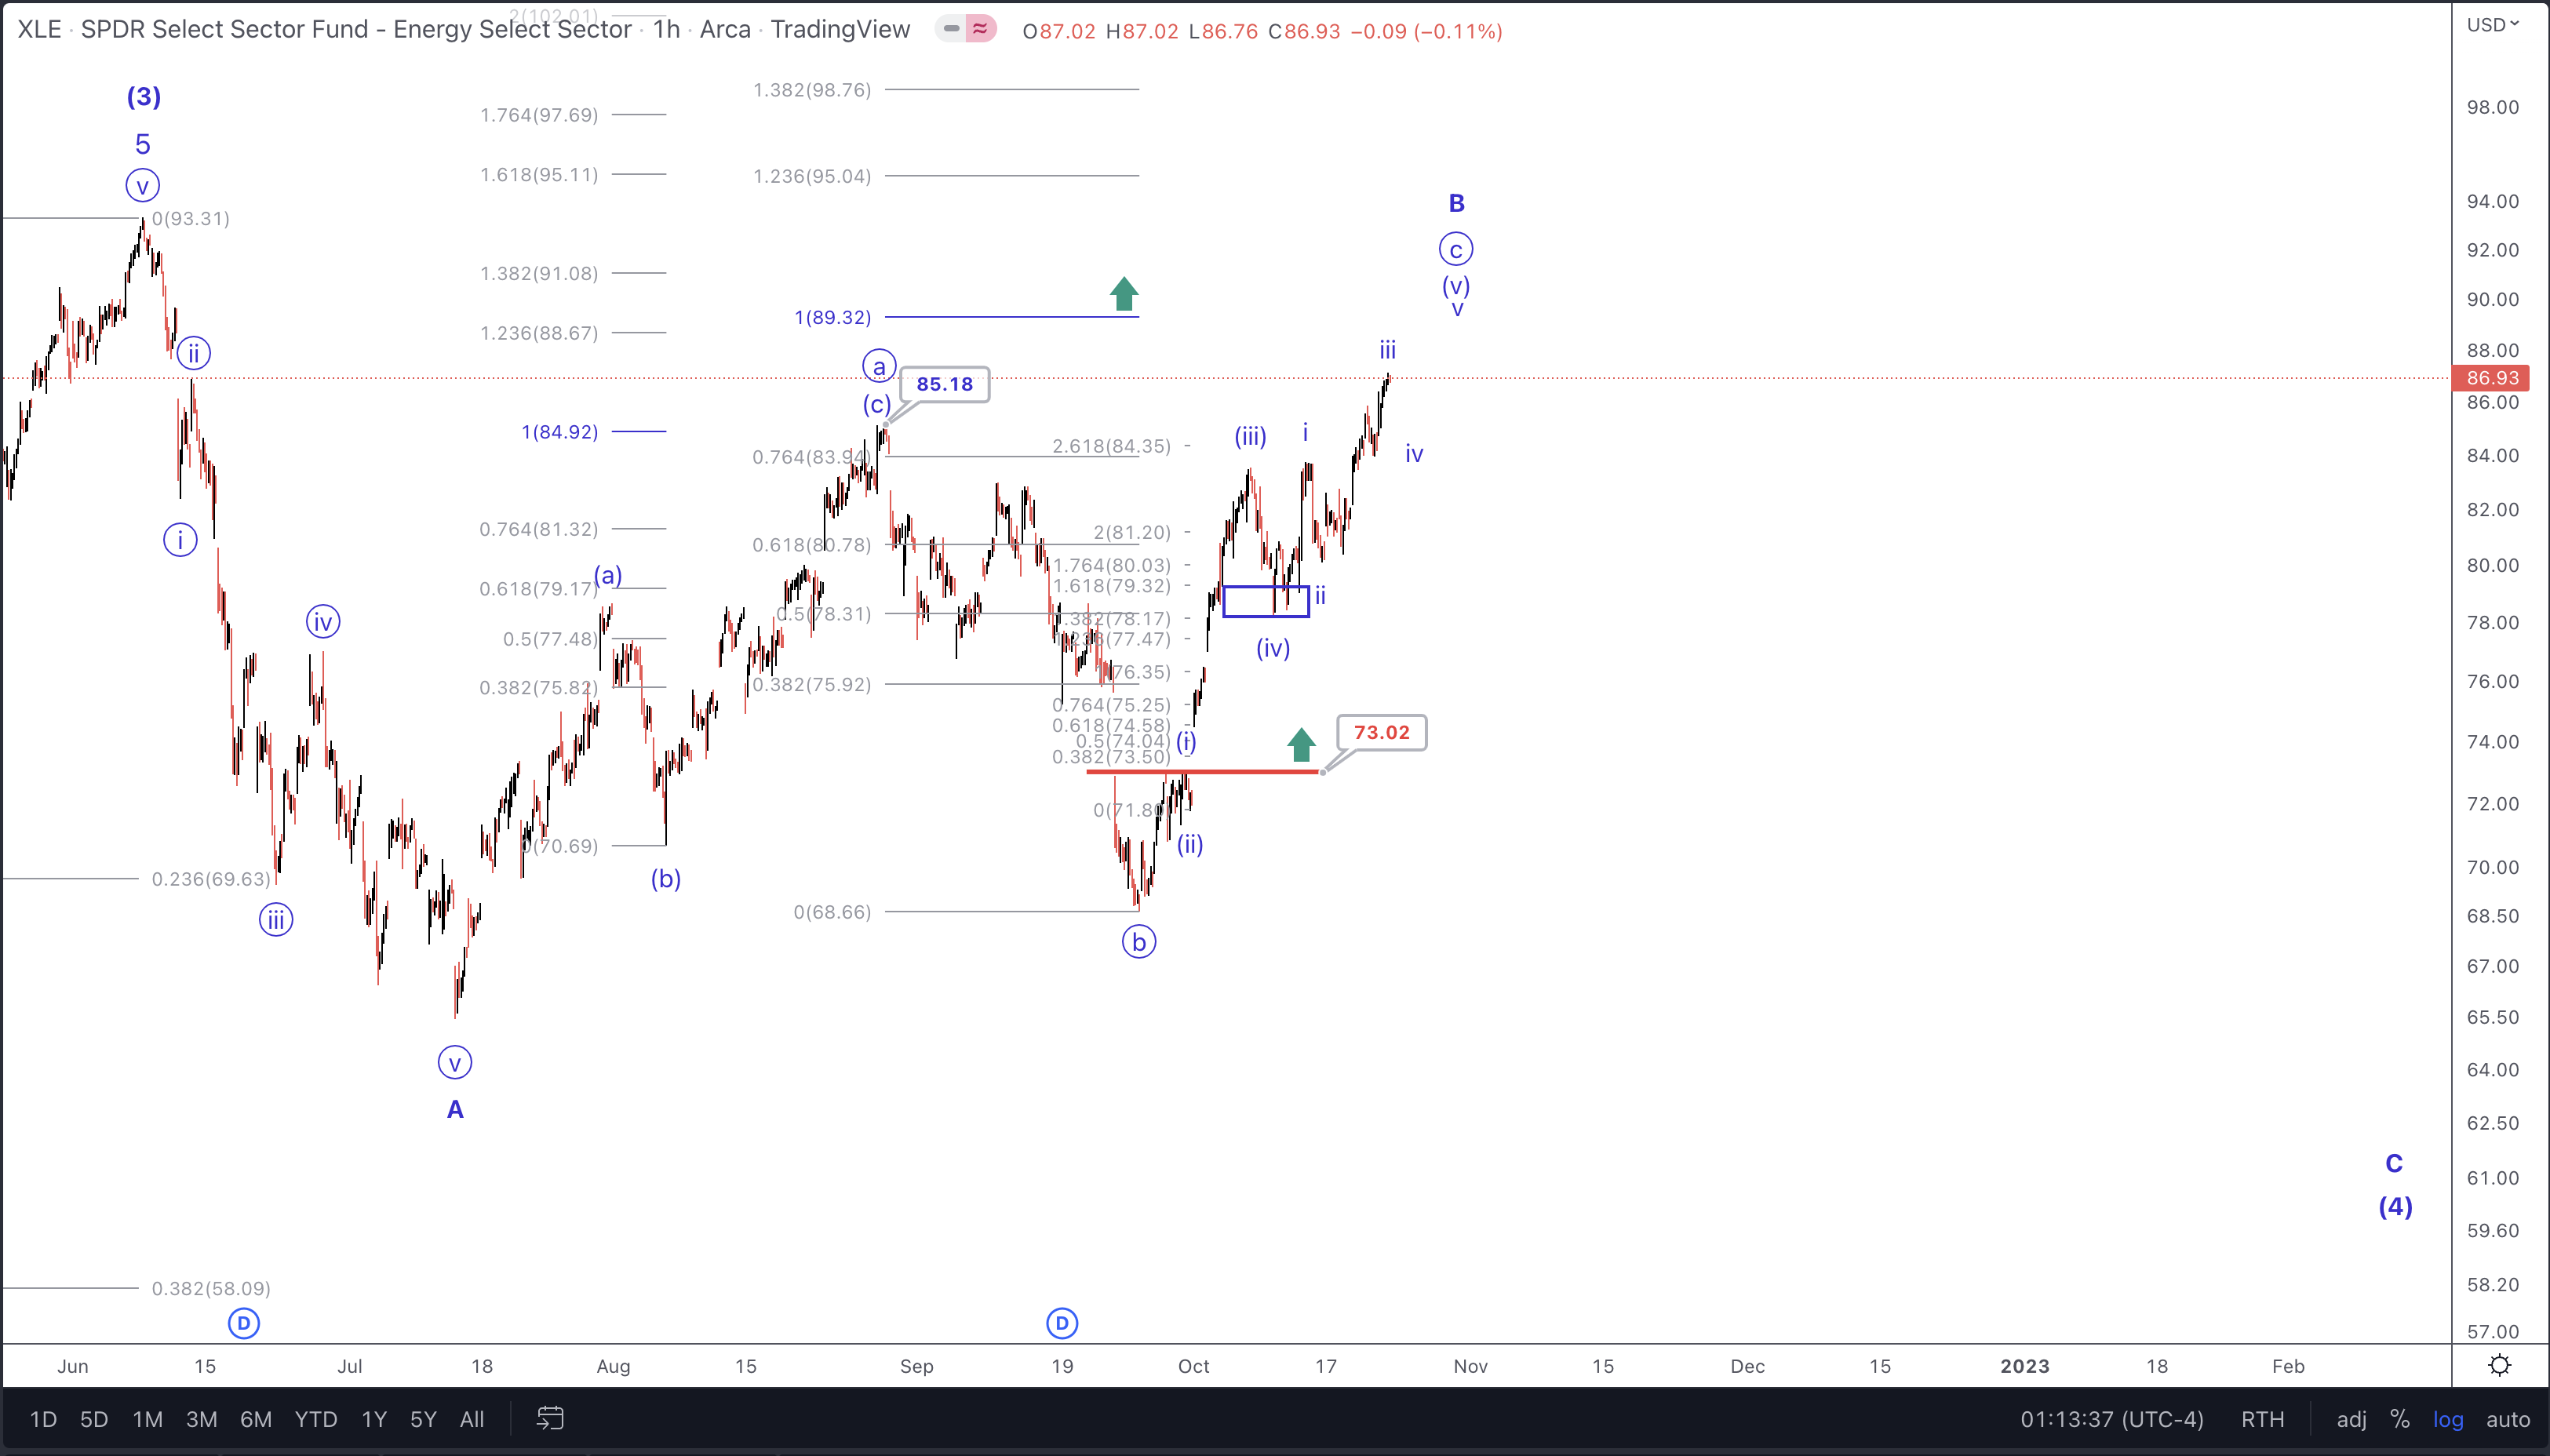
It is our current view that we are nearing the end of that 3 wave corrective rally. This means that we should soon see a 5 wave decline to finish this correction. As well, since the markets are fractal in nature, we should begin this 5 wave decline with a smaller 5 waves down and then a smaller 3 wave bounce. It would be at that point that a potential short position could be initiated with a stop at that high struck just before.
Some traders/investors may choose to hedge at that point. Others may be waiting the completion of the correction to start new long positions or add to existing positions. We view the energy sector as a whole with much more upside in the months and even years to come. That being, once this correction is complete.
Where might these scenarios be wrong?
We always look at where we may be incorrect in our overall assumptions. The possibility exists that the intermediate third wave that we have as a top in June of this year has indeed not yet struck it’s top and the energy sector continues it current rally. We see that as a low probability because of the 5 wave decline that first initiated off the June high.
Conclusion
It is our overarching view that the energy sector is once again reaching a meaningful swing high and that one final corrective leg down will soon begin. Once that next low is in place, the following rally should be extended in time and price, perhaps even into 2024 or beyond.
I would like to take this opportunity to remind you that we provide our perspective by ranking probabilistic market movements based upon the structure of the market price action. And if we maintain a certain primary perspective as to how the market will move next, and the market breaks that pattern, it clearly tells us that we were wrong in our initial assessment. But here's the most important part of the analysis: We also provide you with an alternative perspective at the same time we provide you with our primary expectation, and let you know when to adopt that alternative perspective before it happens.
There are many ways to analyze and track stocks and the market they form. Some are more consistent than others. For us, this method has proved the most reliable and keeps us on the right side of the trade much more often than not. Nothing is perfect in this world, but for those looking to open their eyes to a new universe of trading and investing, why not consider studying this further? It may just be one of the most illuminating projects you undertake.