Amazon: Using Price-To-Sales As A Technical Oscillator (Video)
 By
Zac Mannes
By
Zac Mannes
Summary
-Elliott Wave tracks investor sentiment through price action with little concern for fundamentals.
-A chart of a stock's P/S ratio can function as a technical oscillator.
-P/S ratios on AMZN and others show divergences and setups for lower levels.
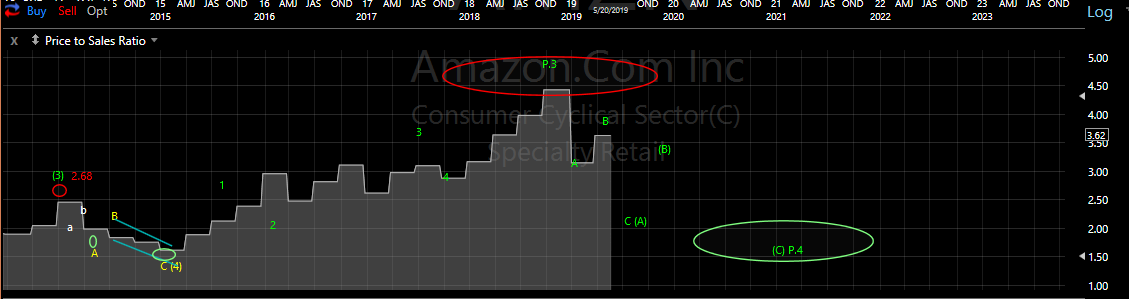
We have tracked Amazon (AMZN) closely since the early days of StockWaves. In this video we take a detailed look at the Elliott Wave count, but also reexamine the use of the Price to Sales ratio (P/S) as an additional technical analysis tool. Back in our first Seeking Alpha article in August 2013 we started looking at the P/S as an oscillator signaling extremes. Since then we also began to start looking for EW patterns (though non-linear) and treating it like other oscillators used for technical analysis looking for divergences or other bottoming or topping signs like we with Stochastics or MACD.
While the recent "B" wave bounce off the December low has taken price back up very close to the 2018 high on AMZN, P/S is significantly lagging. Ideal targets for the larger Primary wave 4 are in the 1000 or 725 regions. P/S could fade back toward the 2.00 region, down from an extreme in the 4.50 region, before AMZN is favorable as a long term buy. The next Fibonacci target for the long-term Primary wave 5 of cycle wave III, the 161.8% extension, targets a very lofty $7,350. We will want to use every tool in our arsenal to catch that swing low, and watching the P/S for clues can help.
We thought now would be a good opportunity to look at the P/S in a few other names to see if it is starting to show confirmation of larger corrections on anything else. Microsoft (MSFT) at nearly 11% of the NASDAQ shares a very similar chart pattern to AMZN. The sub-waves are a bit different, but it too is due for a larger Primary degree wave 4 consolidation. On MSFT the ideal target for the fourth wave is 70 region. Smaller degree support is 119/118 region for a final extension of the 5th toward 147. While the range for P/S is much broader on MSFT than that of AMZN it is showing divergence with the recent higher high made by price. Additionally since the EW structure in P/S can count as a "Diagonal" the fourth can get much deeper at least down toward the 5.00 region before showing signs of a bottom.
The next chart I wanted to look using this technical P/S methodology was Advanced Micro Devices (AMD). AMD has a very different chart than AMZN & MSFT, and by extension much of the market. Its correction off the 2000 peak did not complete until the 2015 low. 15 years spent in a giant abc flat consolidation. After a double bottom with the 2008 low AMD took off like an over-clocked chip, soaring over 2000% into the 2018 high. This move up counts perfectly as a 5-wave EW impulse, and we are anticipating that it is only the Primary degree wave 1 of a much larger bull run starting.
While AMD has a very different count it too is due for a larger correction at Primary degree. Unlike most stocks that are getting fourth waves though, AMD is getting its Primary 2, but should follow a similar path. The ideal Fibonacci support levels for the wave 2 are approximately 10.60, 7.40, and 5.20. Here too looking at P/S we can see potential for a fade back toward the 2.00-1.00 region that would be the bottoming zone for the oscillator on this chart.
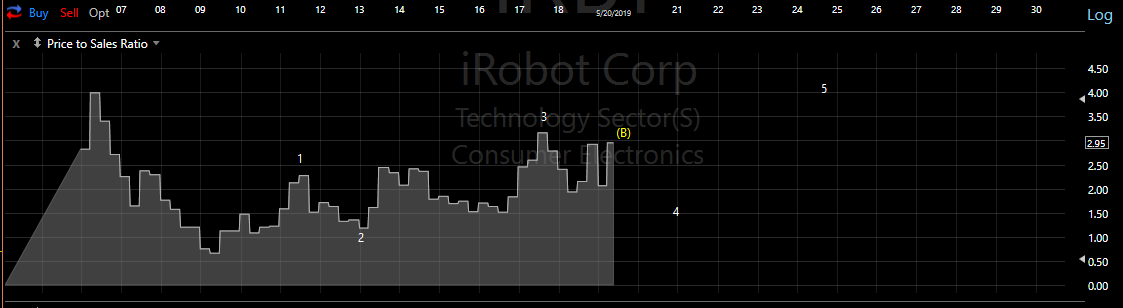
Lastly we chose to use our P/S oscillator study on iRobot (IRBT). What stood out most here was that, looking at the structure of the P/S, slightly altered how we were viewing the sub-waves for the alternative pattern we were maintaining. All scenarios are due for more downside as part of fourth waves, either intermediate (4) of Primary 3 in an impulse or the Primary 4 of a Diagonal. Not only does the clear corrective structure of the P/S favor counting the top of yellow Primary 3 at the 2017 high and the more recent higher high a "(B)" wave at Intermediate degree, but it even favors that count over the white impulse. The strong drop is easily wave 1 of the yellow "(C)" wave, and that should complete as five waves down towards the 50-45 region. At the same time we should see P/S fall toward 2.00-1.50 to signify a possible bottom.
It's also interesting to note that back in August 2013 I was remarking how most articles seemed bearish on AMZN fundamentally and angry that it seemed to defy rational for its gains. Now ahead of a larger correction the few bearish leaning articles are largely ignored (or trolled).
