Altria Group: Value, Yield, And The Psychology Of A Turn
 By
Levi
By
Levi
We have two well-founded points on which to build our investment thesis for this one. First, we’ll check in with Lyn Alden and look at the fundamental snapshot. From there, it’s the structure of price — the behavior of the crowd itself — that forms our second pillar of support. The synergy between these two methods of analysis provides us with a high-probability setup with specific parameters. These will either further confirm our theory or will tell us when it needs modification.
In a recent post, Lyn shared this updated point of view with members:
“MO had dipped down to extreme undervalue territory, and has since bounced back to fair value territory. It continues to be in a position to provide solid long-term returns.
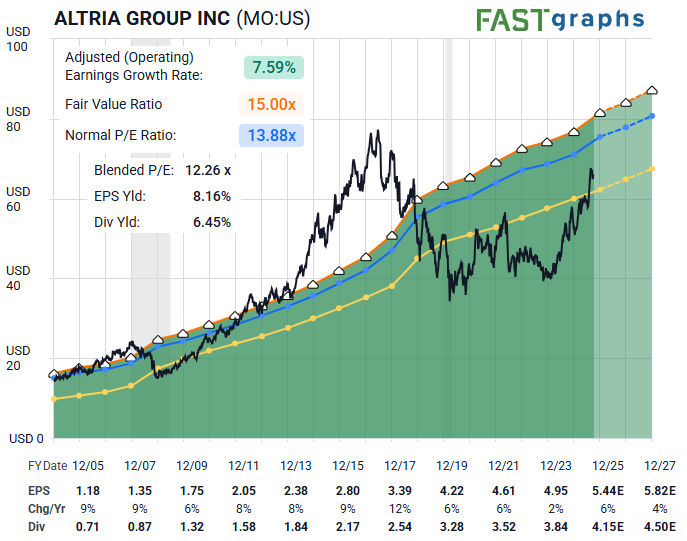
Specifically, in a world of perpetual fiat debasement, MO is short currency (via debt) and long products with substantial pricing power. They provide a 6%+ dividend yield that also grows slowly each year, which should outpace bonds with a reasonable equity risk premium.” - Lyn Alden
So how can we now marry this with what human behavior patterns are telling us on the chart? This is where our study of crowd psychology comes into play via the structure of price. One key insight sets the stage for what may become the next major advance.
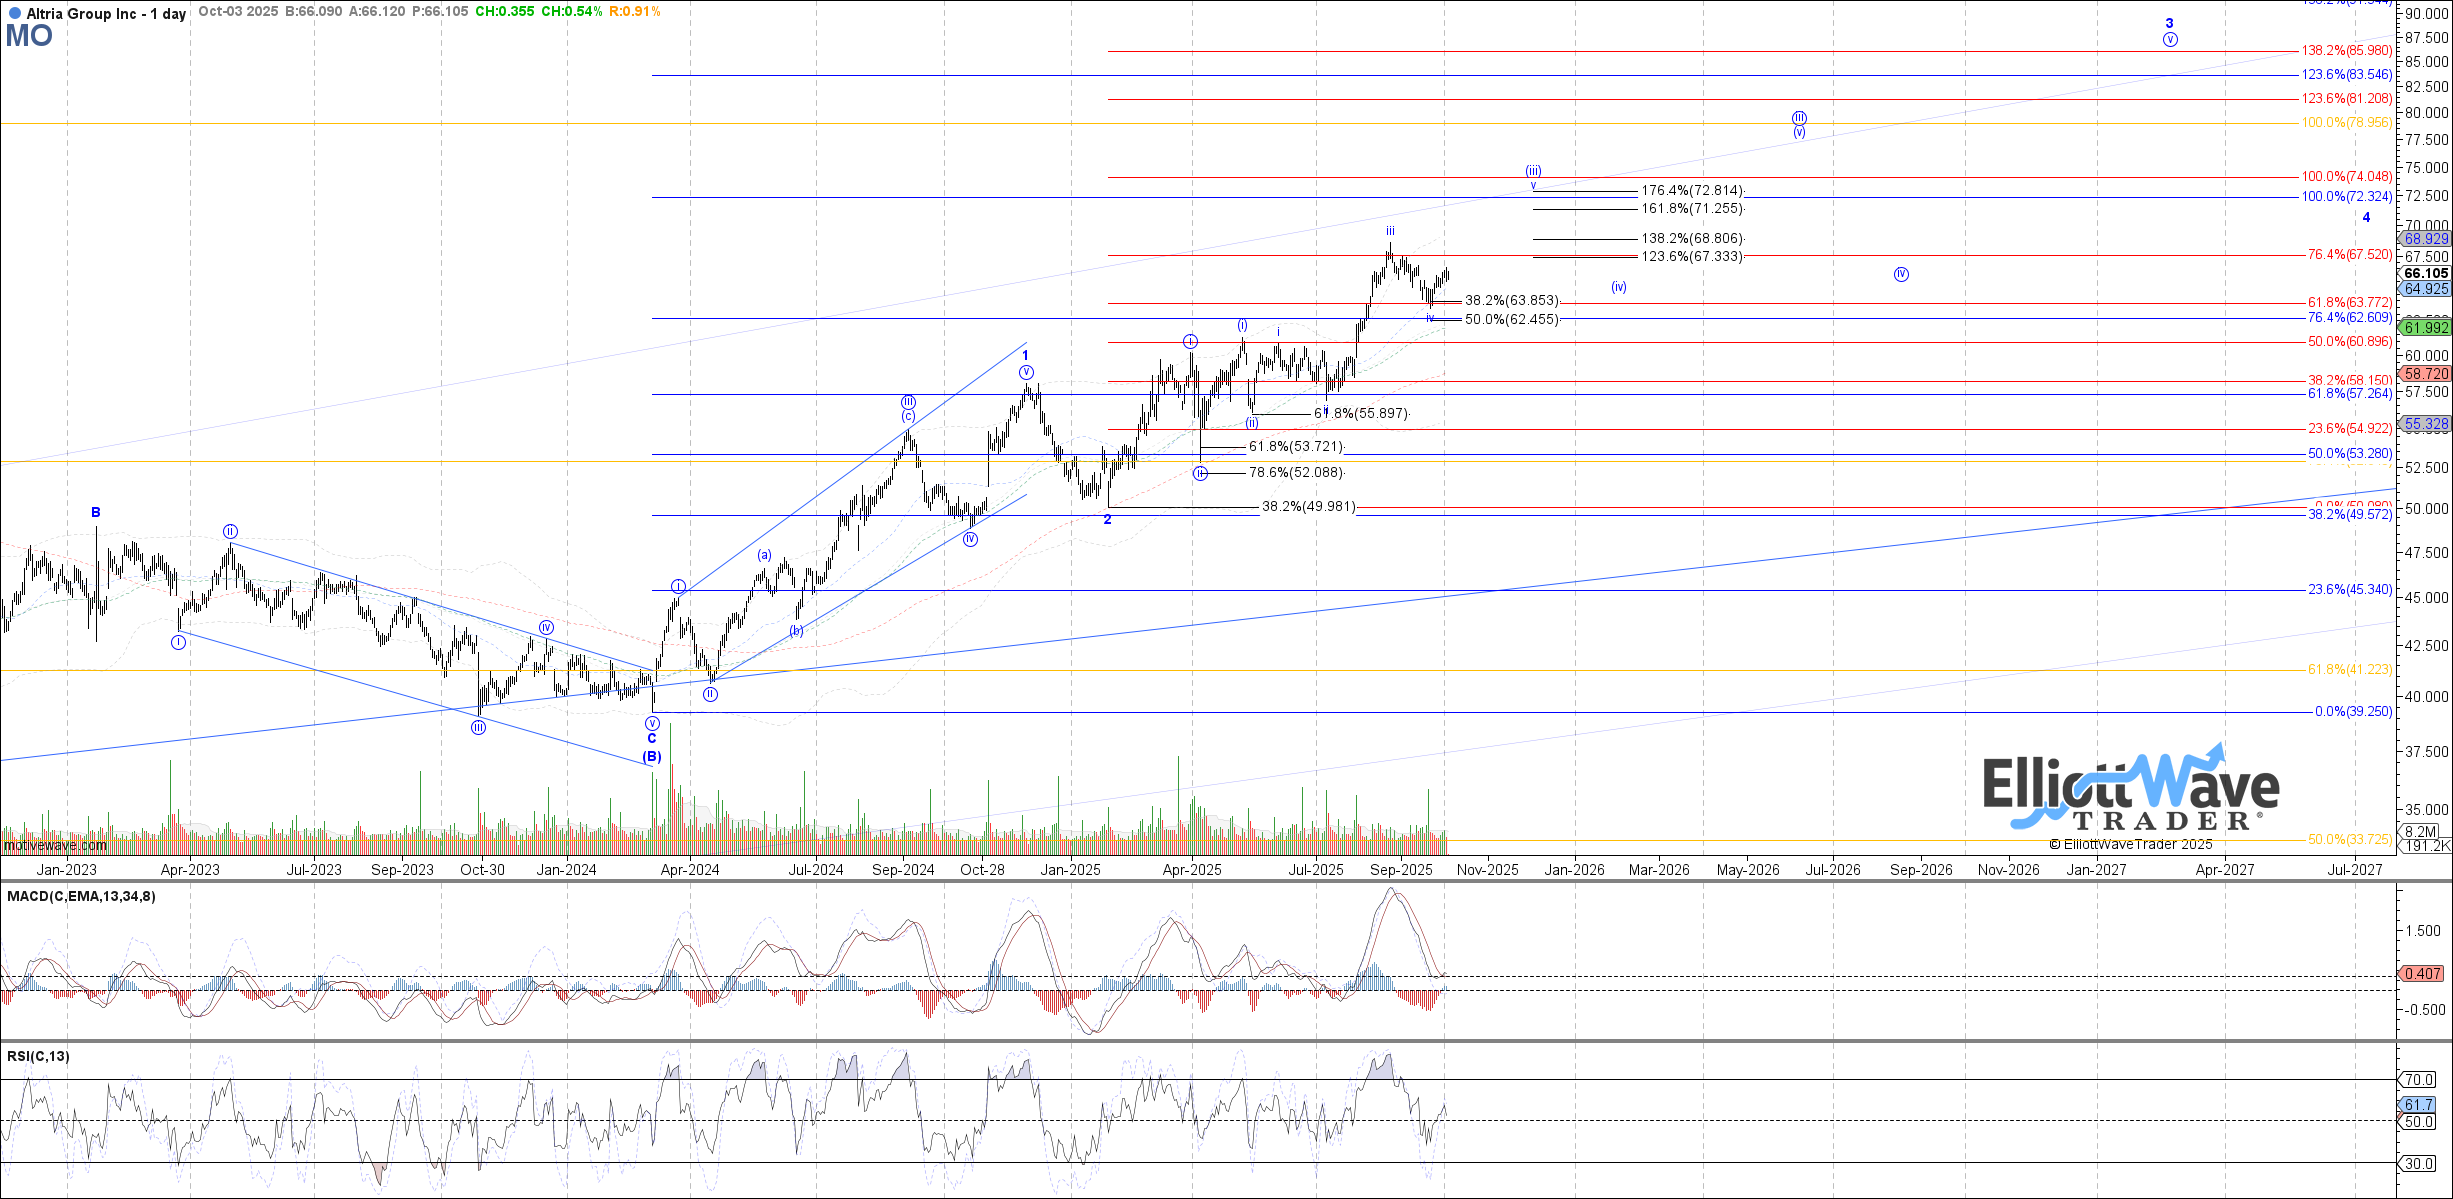
An important low was anticipated back in the spring of last year, and indeed that is what took place. From that pivotal moment, we now have what can be counted as five waves up for wave 1 of the larger (C) wave higher. If you look closely at the subwaves, you’ll note that they are formed as a non-overlapping leading diagonal. This tells us the trend has turned upward from that (B) wave low.
By mid-January of this year, we had a corrective wave 2 in place with a low at the $50 area. It is from that point that we then were projecting the next lesser degree circle wave ‘i’ advance. Once wave ‘ii’ was in place, that gave us a favorable setup for much higher thereafter. What’s more, risk could be defined either at the wave ‘ii’ low or at the larger wave 2 low.
Where do we find ourselves now? The stock is currently yielding about 6.4% with a stable dividend payout. For as long as price remains above roughly $56—or higher—we should see it advance over time to as high as the $86 area, corresponding to wave 3 of (C).
Of course, not all of these setups will perform as drawn up. However, when we follow probabilities and likelihoods with defined risk versus reward, it gives us a clear investment plan with exits and entries via Elliott Wave with Fibonacci Pinball. When fundamentals and sentiment align, the result often speaks for itself — and Altria looks ready to make itself heard.
