Additional BIG Metals Update This Week
Today marked a very important point for me, so I needed to update you on my thoughts. With NEM moving through resistance, I do not have a clear pattern pointing to a lower low at this time in NEM or GDX. That means the market is “forcing” my hand to adopt the more bullish count sooner rather than later.
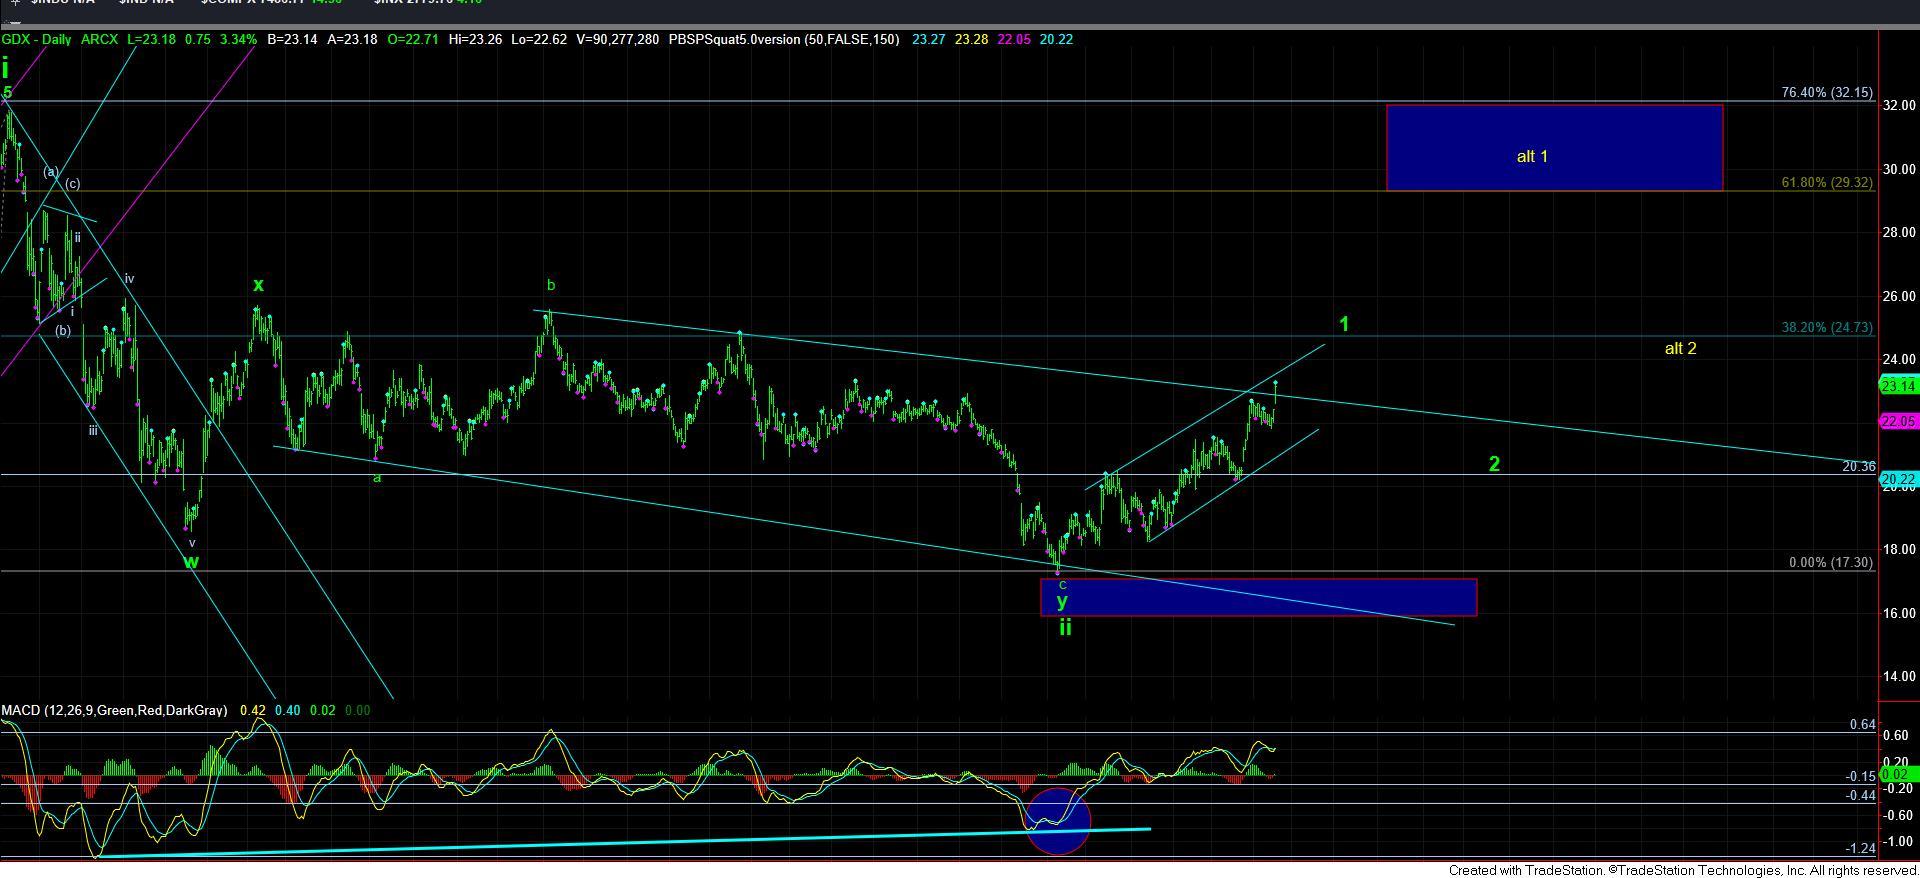
While those that have followed me know I am quite bullish this complex in the bigger perspective, especially since we caught the bottom back at the end of 2015 and early 2016, I have been struggling while attempting to identify a bottom to the wave ii pullback in GDX and other miners.
In fact, the main reason I have been still looking for a lower low in wave ii is due to two reasons, which I have enumerated many times in the past. First, the downside pattern has been unorthodox as a completed pattern, which is why I have not adopted it as the final bottom until the market forced me to do so. And, second, the rally off the GDX and several of the “weaker” stocks like NEM have been quite overlapping, which look more corrective than a confirmation that a bottom has been struck. I have outlined my thinking on this for quite some time, and have tried to be as transparent as possible when it comes to my thought process on this matter. But, today has forced me to change that perspective.
I have also noted for many months that the market looked quite bifurcated with charts like silver and ABX/GOLD having likely struck their lows exactly where we called for them at the end of last year, but with stocks like NEM and the overall GDX chart still not looking likely that a bottom has been struck in them until today – at least for me.
For these reasons, I have been unable to consider that the entire complex has bottomed. And, it was for these reasons that I was also using the weaker stocks as my hedge to protect my account if further weakness was to be seen. As of today, I have taken off those hedges that were intended to see lower levels.
But, please also recognize that the market still remains bifurcated, and there are some smaller “weaker” stocks which may still get lower lows. Yet, I think the majority of the market likely has the lows in place. Also, please recognize that this does not mean we will necessarily be rallying in the heart of the 3rd wave just yet. Rather, it simply means I cannot maintain a primary expectation of lower lows in various charts and I think we have to move into more of a “buy-the-pullback” mind set rather than playing the short side in this complex.
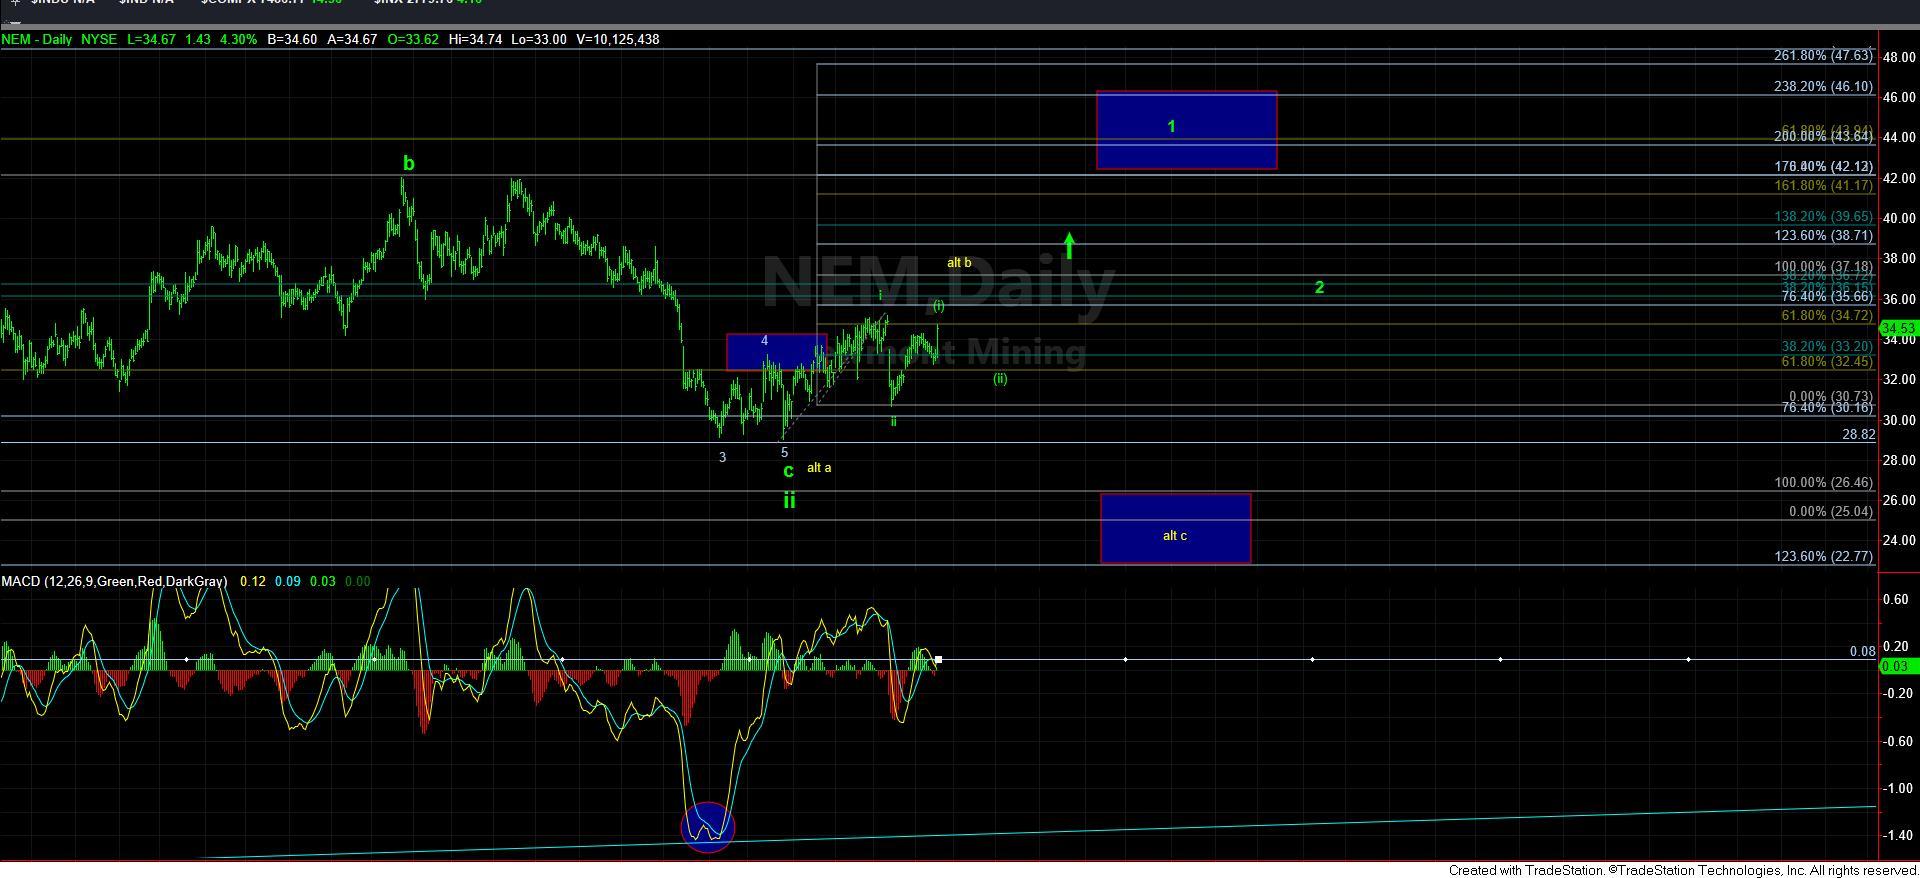
I am going to take a moment, and review my perspective in the NEM so you can understand my thought process and progression in more depth.
First, if you look back many months ago, you would have seen that the ideal target for me on my NEM charts at that time was originally the .764-1.00 extension, wherein c=.764*a at the 30 region, and the a=c at the 26.50 region. Moreover, I wanted to see a full 5-wave c-wave structure into those lows before I was confident a bottom had been struck.
But, as you can see from the chart, the NEM bottomed in its wave 3 of the c-wave just below the .764 extension, and into our initial target region, but it did not complete 5 waves. For that reason, I had to look lower to the 1.00 extension, and modified my bottoming target. Moreover, as the market moved higher in what seemed to be a corrective fashion, the most reasonable perspective for me was that it was a corrective 4th wave rally, setting up for that final 5th wave lower into the a=c target.
Therefore, in order for me to even consider it having bottomed at the 29 region, not only would I have to accept it falling short of the ideal a=c target, but I would have had to accept a truncated 5th wave to complete the c-wave. Again, these facts suggested that it was more likely, based upon historical standards of how these patterns play out, that we would be heading lower just one more time before this pattern completed. And, while I had always considered an alternative that we have bottomed in such an unusual and unorthodox fashion (as I had presented in the alt-yellow count before), the market was going to have to prove it to me.
When the market dropped down strongly into mid-January, I was assuming it began its drop to lower levels for that final low. However, with today’s action, it has provided us with a nice 5-wave structure off that low, which suggests that the probabilities have now shifted to the low being in place in the NEM despite how distasteful of a bottoming structure we have to adopt.
Again, this does not mean we will certainly be breaking out directly now, as the best count across the market seems to be that we are topping out in wave (i) of wave iii of wave 1, as shown on my daily NEM chart. But, it is not something I want to short any longer after today’s action. Rather, I would be buying dips now, and if it did make a lower low at any point now, I would simply view it as a gift. However, today’s action has now placed a much more bullish spin on the chart, since drops have now been in 3’s, with rallies now being in 5’s.
If you do not understand why my thinking is now forced to shift, do not hesitate to ask. But, if the market was indeed headed directly lower, then this rally should have been a corrective 3-waves, rather than what counts best as 5 waves off the mid-January low.
So, I have now had to adjust my primary expectation that the lows are “likely” in. But, that is not the same as saying that the market is ready to break out in the heart of the 3rd. In other words, there is still downside risk, but it is lesser risk than it was before for lower lows. Rather, any further downside is likely going to be a pullback/consolidation in a 2nd wave in most charts.
The best example to show is the silver chart, so I want to use that to explain my perspective. As it stands now, we have enough waves in place to consider all of wave (i) as having completed. In fact, for those of you that have followed our work from last year, you would remember that I strongly noted that silver had likely bottomed back in November as we were completing that downside because the “downside pattern was extremely full.” Therefore, I was looking for this 5-wave rally to confirm that potential, and move us into a buy-the-dip perspective in silver. That still remains my primary expectation and perspective.
However, there is still some potential to see silver make a higher high in a 5th wave, as highlighted in the alternative, which I am now presenting in yellow. But, that still just keeps us within a wave (i) off the lows, as long we hold below that 16.80 region. That also means that I still expect more pullback/downside consolidation in the coming weeks or months, depending on whether silver sees that 5th wave higher or not.
At the end of the day, the greater majority of the charts are now showing more impulsive structures off their lows, which means we have to move into a buy-the-dip mentality, rather than expecting that one more lower low. Should we see a lower low, I would view it as a gift, but I am now seeing that potential as much lesser likelihood. Yet, at the same time, it does not look like we are ready to truly break out in a big way, as it would seem we need more of a 2nd wave across the complex before that heart of the 3rd wave is going to begin in earnest.
If my perspective is not clear after this write up, please do not hesitate to ask questions below. Have a good evening.