APD: A Moat, A Reset, And A Potential Runway Ahead
 By
Levi
By
Levi
Now that is an intriguing combination. Let’s examine the fundamental foundation, and then see how crowd behavior may determine the pathway ahead.
Lyn Alden recently shared this snapshot regarding APD:
“APD has a wide economic moat and a strong balance sheet in a key industry. Over the past 5-6 years, it became rather richly valued, and the stock price ended up consolidating sideways while fundamentals kept inching higher, relieving that rich valuation. The stock is now trading at approximately its 20-year average valuation.
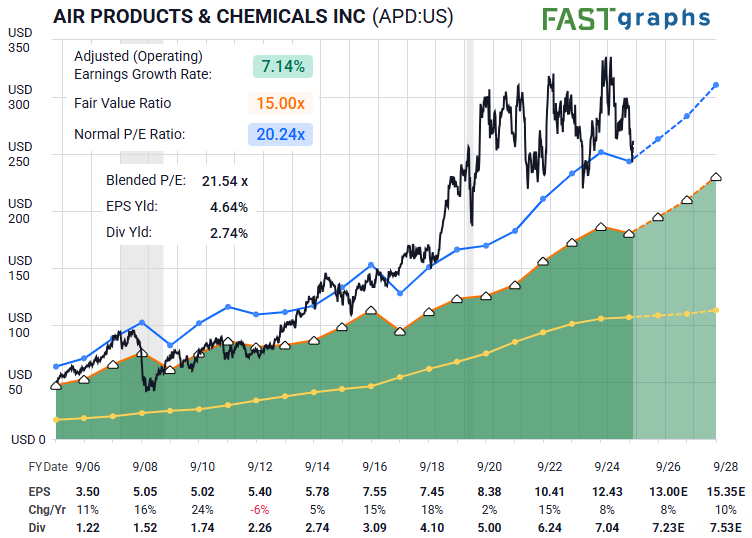
Going forward, I'm moderately bullish on the company, but the key risk is around growth. Earnings and dividends have had rather slow growth lately, and that could demand a somewhat lower valuation than its historical average. So there is certainly some downside risk, but I think corrections and dips represent interesting opportunities for this high quality name.” — Lyn Alden
A Wide Economic Moat
That phrase always catches our eye. It implies protection — an asset base, competitive advantage, or pricing power that others simply do not possess. Combined with a strong balance sheet, it forms a durable foundation for an investment thesis.
But one ingredient remains essential: risk versus reward.
A thesis may be strong, but without defined risk, even a fortress can crumble under the pressure of crowd sentiment. So let’s examine what behavioral patterns are telling us now through the structure of price on the APD chart.
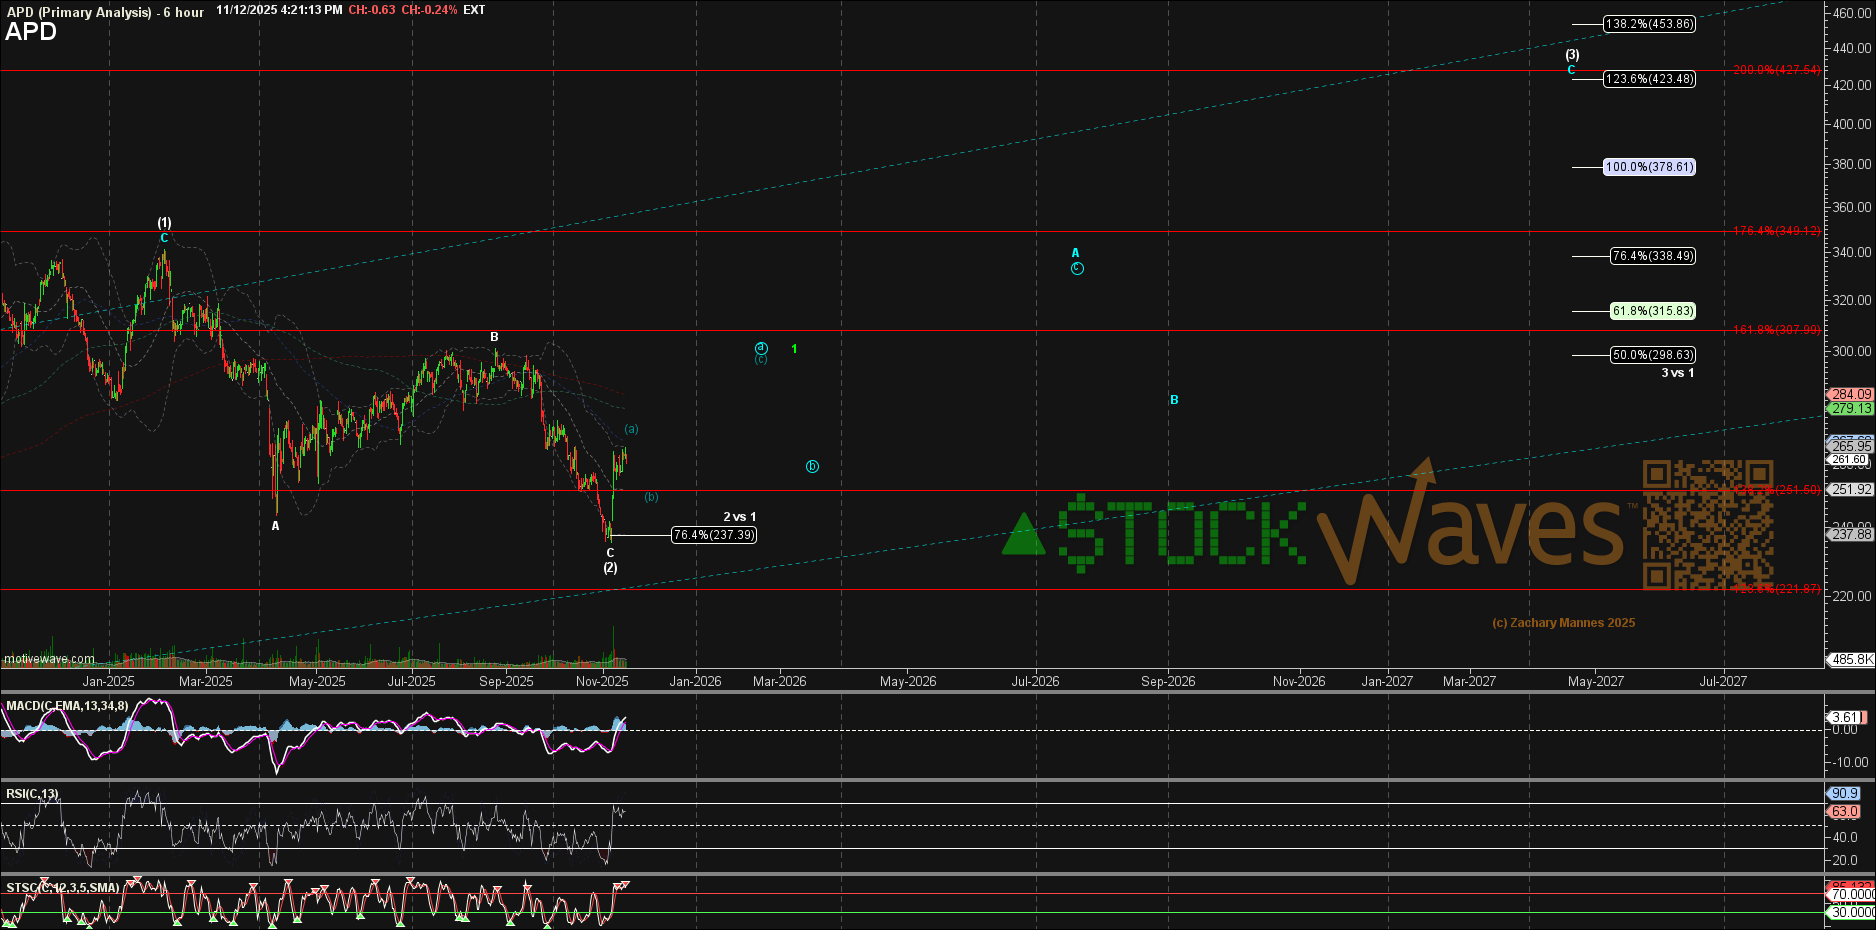
You can readily see that price appears to have bottomed in a wave (2) correction at the November low. What follows is the next lesser-degree wave 1–2. Once complete, this would set the stage for the most powerful portion of the anticipated rally ahead — the heart of a third wave.
But it’s too early to declare that outright. So what must occur first?
The segment unfolding in the days ahead should take shape as either the circle ‘a’ wave designated in cyan, or potentially the wave 1 of (3) shown in green. After that, a corrective pullback should hold above the wave (2) low — typically retracing 38% to 62% of either wave 1 or ‘a’.
This is where the risk-versus-reward sharpens.
Defined risk sits at the wave (2) low, and once price begins to rally again from the wave 2 or ‘b’ low, stops can be tightened accordingly.
A typical target area for this setup sits in the 1.236–1.382 extension zone of waves (1)–(2), or roughly $423–$453. As the smaller subwaves fill in over the coming days and weeks, we will refine these levels further.
When the Moat Meets the Crowd
Look again at the FAST graph Lyn shared. Price has now reconnected with its long-term normal P/E range — historically an ideal region for reassessment and potential turning points.
But fundamentals alone do not move price.
The crowd does.
We now have:
- A strong business with a wide moat
- A valuation reset back to long-term norms
- A developing Elliott Wave structure with defined risk
- A bullish pathway that could accelerate if momentum carries
This creates a reasonable thesis with a favorable risk-versus-reward profile — and from here, the crowd will vote its will.
