ANT: No Single Ant Knows the Plan
 By
Levi
A line of ants is a fascinating thing to watch. Although there can appear to be some slight chaos among the ranks, overall it moves along in orderly fashion. There have been studies done that show why this happens, but sufficient for our discussion here is the image of the ant train making its way from one destination to the next.
Would you conclude that each ant knows the plan of the colony? Is each one thinking the plan all the way through, from start to finish? Or are they following signals of the collective?
Much of the price action, and how the sausage is made, happens behind closed doors in a private company, hidden from public eyes. We can, though, plot the major funding rounds and use those as price anchors in a Fibonacci structure. Might it be that, even unknowingly, these private funding rounds are all part of the greater crowd behavior? Unbeknownst to the players, they and we are all ants.
Anthropic, set to list on Nasdaq as ANT, may be the next colony to test that idea in public. If the pattern holds, its private rounds have already laid four waves, and the crowd’s fifth points to a zone between $148 and $157 a share.
Where This Started
A company doesn’t suddenly acquire investor sentiment when it goes public. That sentiment has been developing, and finding expression in valuations, for years. Perhaps we’ve been looking at IPO charts from the wrong starting point.
The remarkable possibility is that private and institutional investors establish much of the wave structure, while the public provides the enthusiasm necessary to complete it. That is characteristic of a fifth wave in an impulse.
Avi Gilburt and Zac Mannes have long shared the view that an IPO is really an expression of a fifth wave of sorts, in a larger structure that came before the public became involved. From a crowd psychology point of view, it makes a lot of sense. But then I asked myself, If there is a fifth wave, then there have to be waves one through four, right? What if we could plot those and then target where the fifth might terminate?
What would we use to plot the structure? The closest thing we have to crowd behavior is what private and institutional players pay to create a pre-IPO valuation. Those price anchors could serve as waypoints. Then waves 2 and 4 might not be corrections via price; rather, they happen via time. A correction is a cooling off and resetting of sentiment. Sometimes price does this quickly. Time accomplishes the same, it can just take longer. Wave 5 is supplied by the public - retail, as is typically the case for fifth waves in an Elliott Wave structure.
That was the experiment with SpaceX. Before SPCX traded a single share, the structure pointed to $225 to $240. The stock opened above its $135 offer price, and the initial rally pointed overhead to that exact zone. The possibility existed for the upper range of $240 to be struck, but once near-term support was broken we began to look for a deeper pullback, as is typical after the IPO hype fades. We published along the way that $225 was key and that a pullback to the $110 to $112 area was the likely target. $105 ended up being the low, and then price rallied to $175.
I’m not surprised that Fibonacci Pinball provided reliable targets, support, resistance and confirmation levels. It has been in use for years now and continues to be an impressive price overlay tool. What still gives me pause is where the anchors came from: prices negotiated in private, months apart, and yet the math treated them like any other chart. I wanted to see if the model would repeat. ANT was the most likely next candidate for study.
Nothing New Under the Sun
I am not claiming to have stumbled on some new sort of methodology. These tools were presented to me, and I am only using them to fill in what is already there.
Leonardo of Pisa didn’t invent the sequence that carries his nickname. Scholars in India had counted it out in the rhythms of Sanskrit poetry centuries earlier; he met it in a puzzle about breeding rabbits, one that runs 1, 1, 2, 3, 5, 8, 13 and onward. Ralph Nelson Elliott didn’t invent crowd behavior either. He found it in some 75 years of market records he studied in the early 1930s, while a long illness kept him from working. The pattern was there before either of them wrote it down. Observers is what we are.
If there’s a picture for my part in this, it’s a student borrowing the teacher’s telescope and pointing it at a different patch of sky. The sky was always there. There is nothing new under the sun.
The model worked for SPCX. Will it work for ANT? Could it continue to work going forward? It would take a company with heavily participated funding rounds, enough of a crowd to leave anchor points worth plotting.
The Trail Was Laid in Private
Elliott Wave impulses move in five waves: three rally waves and two corrections. Waves 1 and 2 project where waves 3 and 5 will likely terminate, and the depth of wave 4 also helps target wave 5.
Take the prior funding rounds and plot them using the five-wave structure. Wave 1 is the initial conceptual funding round. Some companies never make it past this. Proof of concept is what will trigger the wave 3 big players to pony up massive capital outlays. Wave 4 is the roadshow, hyping up wave 5 to retail so that everyone before can either mark up their investments or distribute to the crowd.
For Anthropic, the prospectus lays the rounds out in plain view, with the price investors paid in each one. Adjusted for the company’s 10-for-1 split in September, the Series E paid $5.61 a share in early 2025 and the Series F paid $14.10 that August and September. That’s wave 1. Anthropic raised earlier rounds, but the count starts at the Series E, where the concept first drew a crowd.
Then the price sat. In October 2025 the company resold shares at exactly the Series F price. Time provided proof of valuation.
Wave 3 came with the biggest checks: the Series G at $25.91 in early 2026, then the Series H at $58.90 that May and June. Even inside that run there was a pause, as the company kept selling Series G shares at the same price through May. Wave 4 is now: the prospectus, the roadshow, the waiting. None of the investors in those rounds set out to draw a wave.
The chart below covers January 2025 through early 2027. It plots the price investors paid per share in each private round, Series E through Series H, on a log scale, with the Fibonacci Pinball extensions of wave 1 measured from the wave 2 shelf. Blue is the primary path, and the dashed blue line is the projected fifth wave.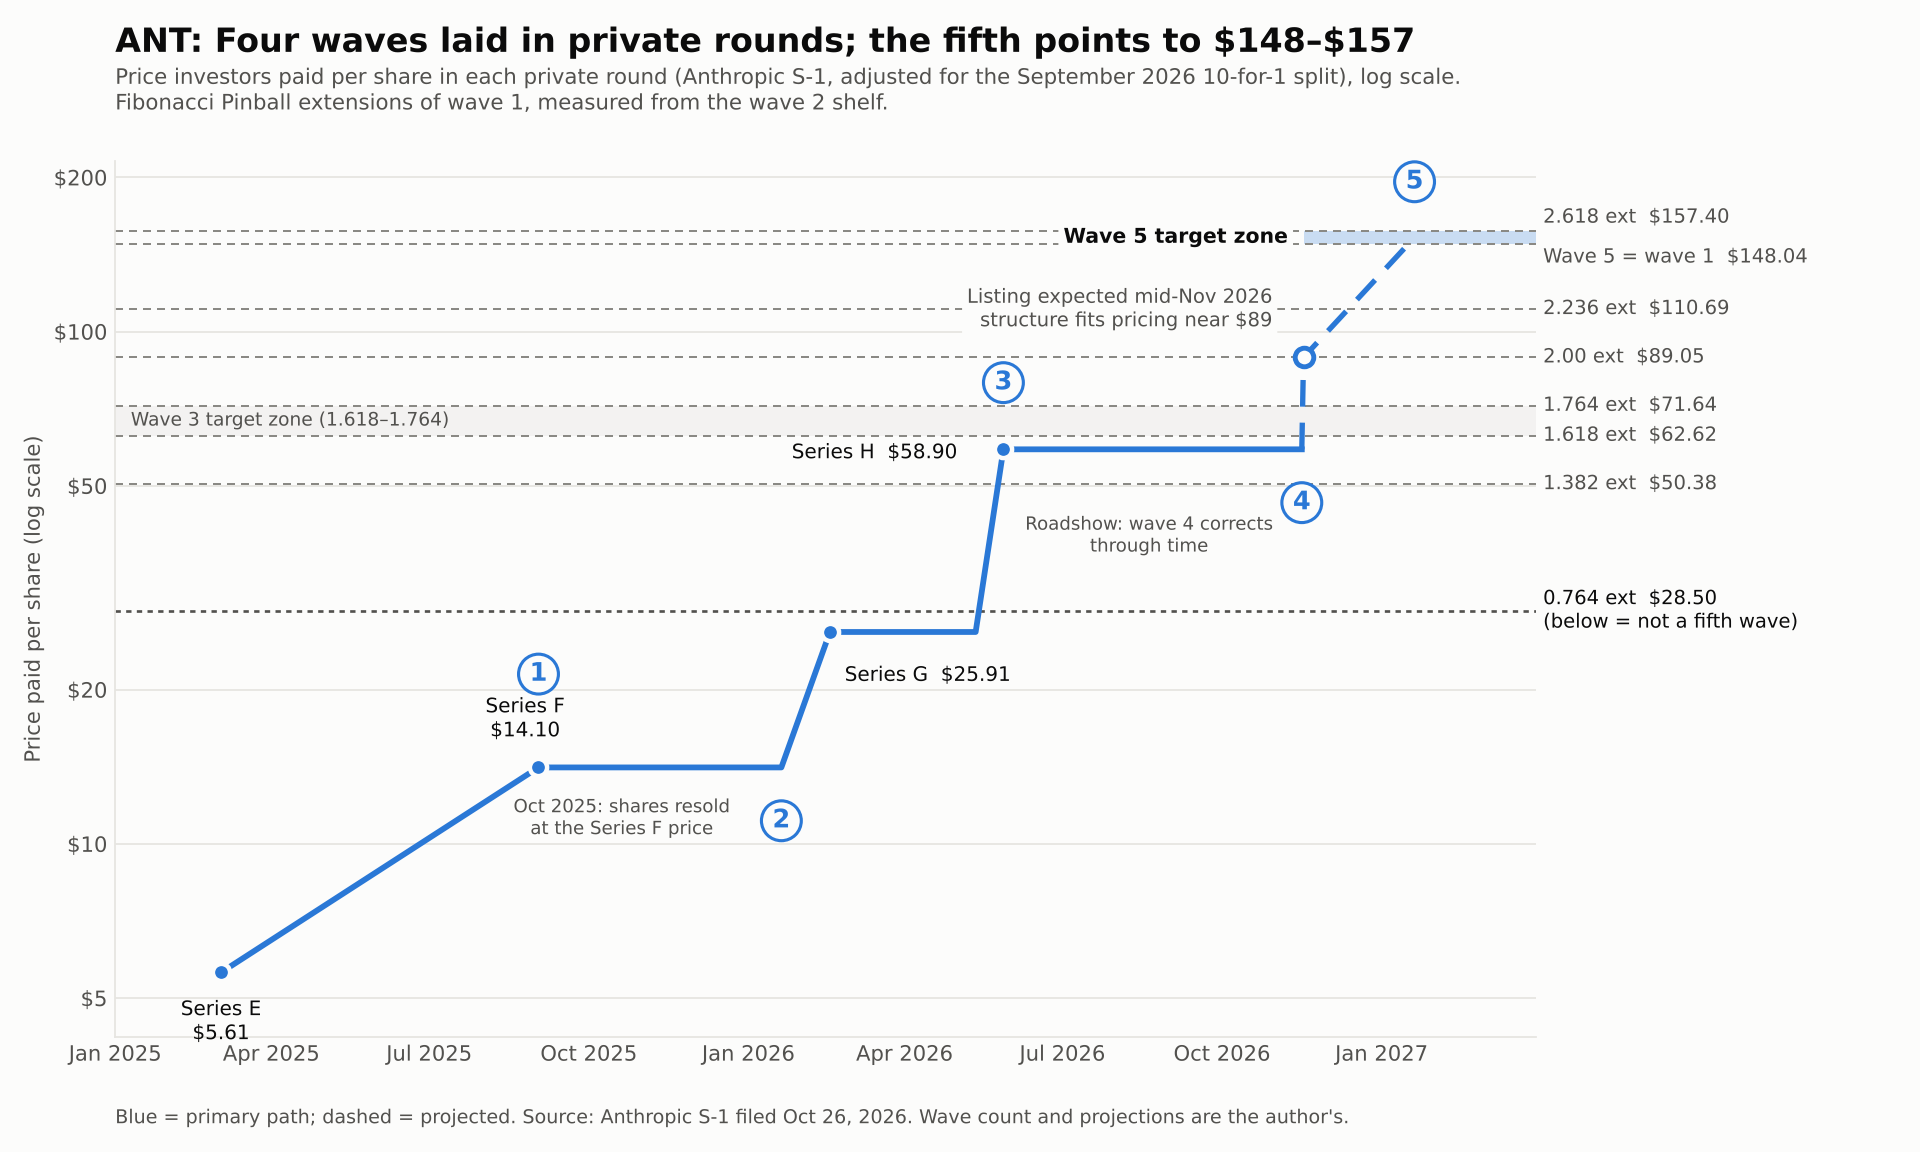
Having the actual prices paid makes the calculations even clearer and presents us with invalidation points for the thesis. When I lined ANT up against SPCX, the two were entirely similar, just as a Fibonacci Pinball structure would dictate. This is likely because Fibonacci math is everywhere, whether we recognize it or not.
Where the Fifth May Finish
In a standard Fibonacci Pinball structure, wave 3 strikes the 1.618 - 1.764 extension zone of waves 1-2. In some cases, price can strike the 2.00 extension in wave 3. Then wave 4 pulls back. In the case of a pre-IPO, our working supposition is that wave 3 is struck in the last main round of funding by the biggest participants. For ANT, the Series H landed just shy of the 1.618. Wave 4 is the pre-IPO roadshow and prospectus shopping.
We look for Fibonacci price confluences to suggest key zones, as either targets or support and resistance. This is the case for ANT. Two separate measurements point to the same area: the 2.618 extension, and a fifth wave equal in size to the first. They meet because the private market corrected through time instead of price. That puts the fifth-wave target between $148 and $157 a share.
The structure would be comfortable with IPO pricing near $89, the 2.00 extension. There can be some last-minute shuffling and adjusting given demand, or lack thereof. For now, I will use these levels as examples, suppositions if you will, and adjust as needed. Share price is just the result of shares issued and market cap computed. It’s the market cap that counts, not the per-share price pre-IPO. At the expected share count, $148 to $157 works out to roughly $2.5 to $2.8 trillion. From $89, that zone sits about 66% higher; SPCX ran 67% from its $135 offer to its top.
I’m confident that the subwaves of the larger fifth wave will help narrow down a target zone once shares begin to trade. This was the case in SPCX as well.
Whimper or Starburst
Fifth waves can either end with a whimper, if the third was extremely extended, or they can extend themselves into a near-euphoric starburst. ANT’s third wave stopped short of extreme. A starburst may be in order here.
The subwaves will almost always dictate the turns. Lockups are an interesting study to overlay onto a chart, but I would rather rely on what the crowd is doing.
It may be that the individual ants believe they are thinking their way through this journey. But we are all part of a collective. The crowd will ultimately determine where this goes. Keep present, though, that much of what has taken place has already projected where this will go. Waves 1-4 are likely in place. Wave 5 of the ants is incoming.
My best projection is that price will seek close to the 2.618 extension of the larger framework already set. Watch for the IPO to price at $89 and for the fifth wave to carry shares to $144, perhaps even to the $157 level. Ants, march.
