AMZN: Let It Flow
 By
Levi
By
Levi
We take a brief glimpse into our “When Fundamentals Meet Technicals” articles and where AMZN finds itself in the current macro environment.
Follow along as our lead fundamental analyst, Lyn Alden, discusses Amazon’s valuation at the moment.
How can technicals aid in identifying high probability setups for both a swing trade and for long-term investors?
by Levi at StockWaves, produced with Avi Gilburt
When Fundamentals Meet Technicals
To some this may seem like oil and water or even vinegar and baking soda. If you’ve ever mixed the latter then you know the result. Purists from both sides will argue their case ad nauseam but with little results as far as convincing their “opponent” of their logic and reasoning. Why fight about this? Why not use both?
Here is a brief snippet from some of Lyn Alden’s comments to our membership a few weeks back:
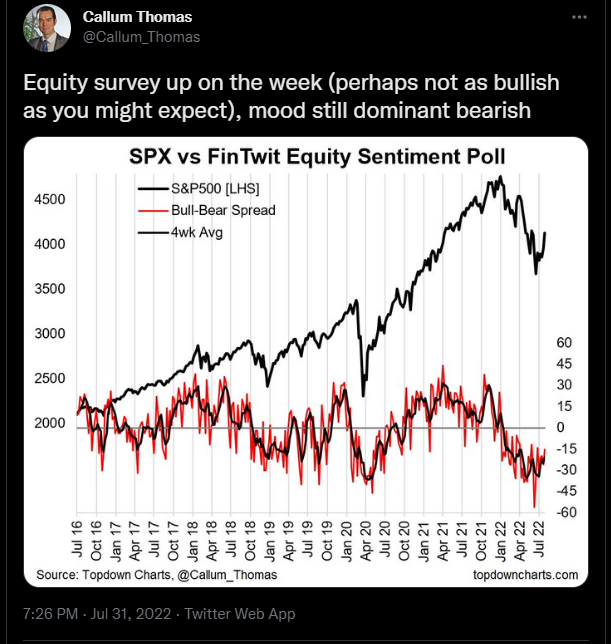
“This remains a challenging macro environment. Economic indicators continue to show clear signs of economic deceleration, likely pointing to weak corporate earnings in the quarters ahead. Meanwhile, the Federal Reserve is tightening monetary policy into that deceleration, which historically is a very bad mix for asset prices. However, sentiment already reached very bearish levels. We can see that among the recent spike in small trader puts as well as sentiment polls like this one that I like to track from Twitter's financial community or ‘FinTwit’.”
(see FinTwit chart)
“During truly cataclysmic bear markets, the market sometimes falls sharply even during historically low sentiment. For example, back in 2008 sentiment was very weak, but then the market crashed anyway because the entirety of that bad sentiment was warranted, without exaggeration. However, outside of those situations, negative sentiment is usually at least an intermediate-term contrarian indicator.”
The Current Fundamental View Of AMZN
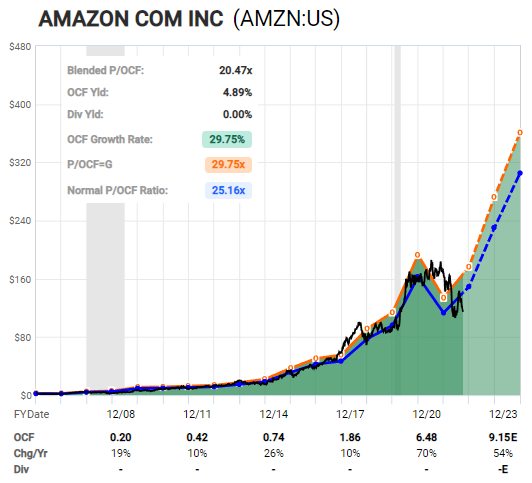
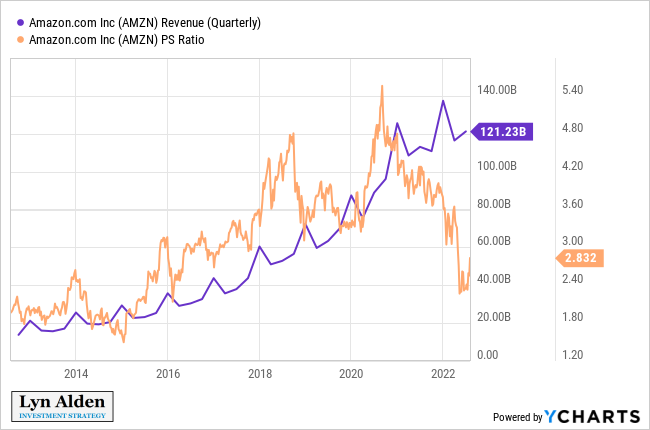
Lyn recently posted this: “(AMZN) had a growth spurt in the early months of the pandemic and stimulus, but since has been on a slowing trend as excess liquidity and stimulus is withdrawn from the market. During this time, the company is slowing down its pace of new logistics locations, as it re-assesses its supply chain plans and puts a break on growth to play some defense. Meanwhile, the market has lowed its valuation on the company, to under 3x sales.”
(see AMZN PS chart)
“Amazon is currently trading at a moderately below average price to cash flow ratio. After a massive increase in 2020, Amazon's cash flows faced a pullback in 2021. Consensus Wall St. analysts are expecting a major boost in operating cash flow in the next few years, as their revenue continues upward and their capex stabilizes.”
(see AMZN FastGraph)
“Overall, I view Amazon as being one of the better big tech companies out there. The bull case for what investors are really buying is the company’s profit center (Amazon Web Services) and fast-growing advertising business, while the more complex retail side is more of a rider at this point.”
I have a moderately bullish view on Amazon, where I expect stabilization in cash flows and valuation. I'm less bullish than analyst consensus expectations because I think there is a significant possibility of a US recession in the 2023 timeframe, but after two years of sideways and down price action, valuations are reasonable. It's challenging to see long-duration Treasury yields rising notably from here, and those serve as a key reference point for valuing equities. Therefore, I think Amazon at current price levels can play a role in a diversified portfolio. I would look towards technical analysis and stop loss points for overall risk management, to avoid buying into a falling price action.”
The Technical View
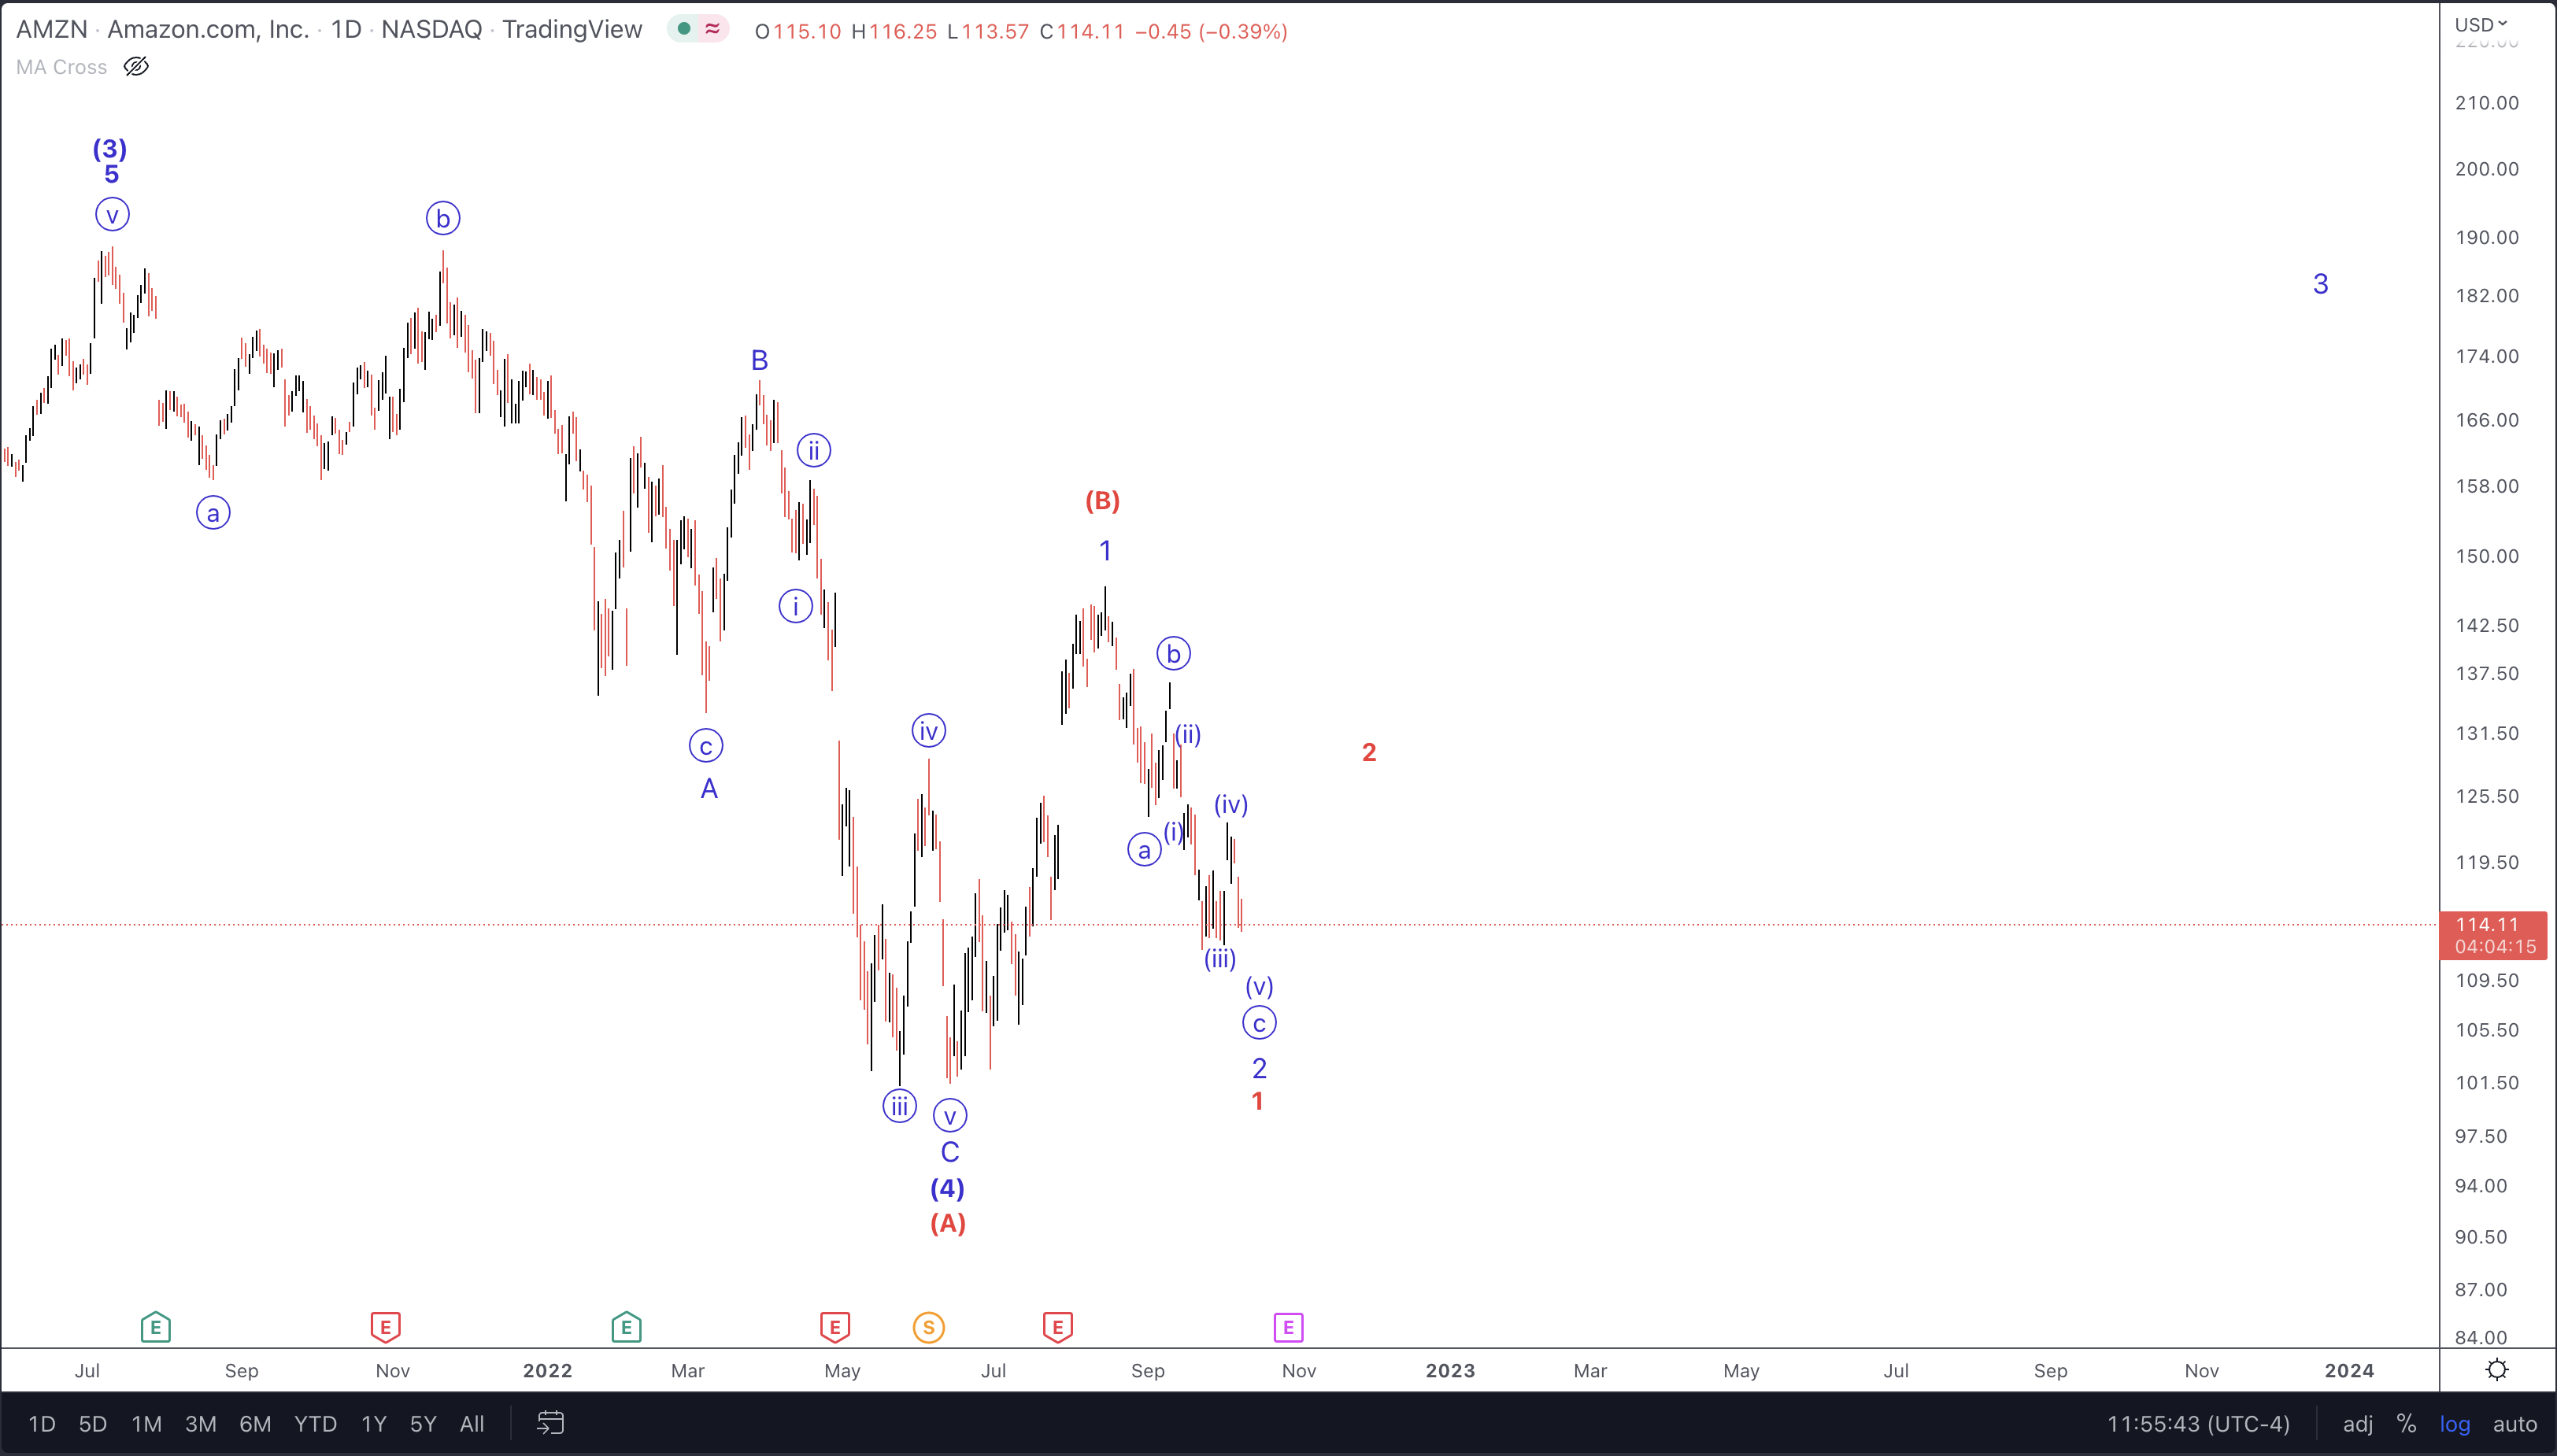
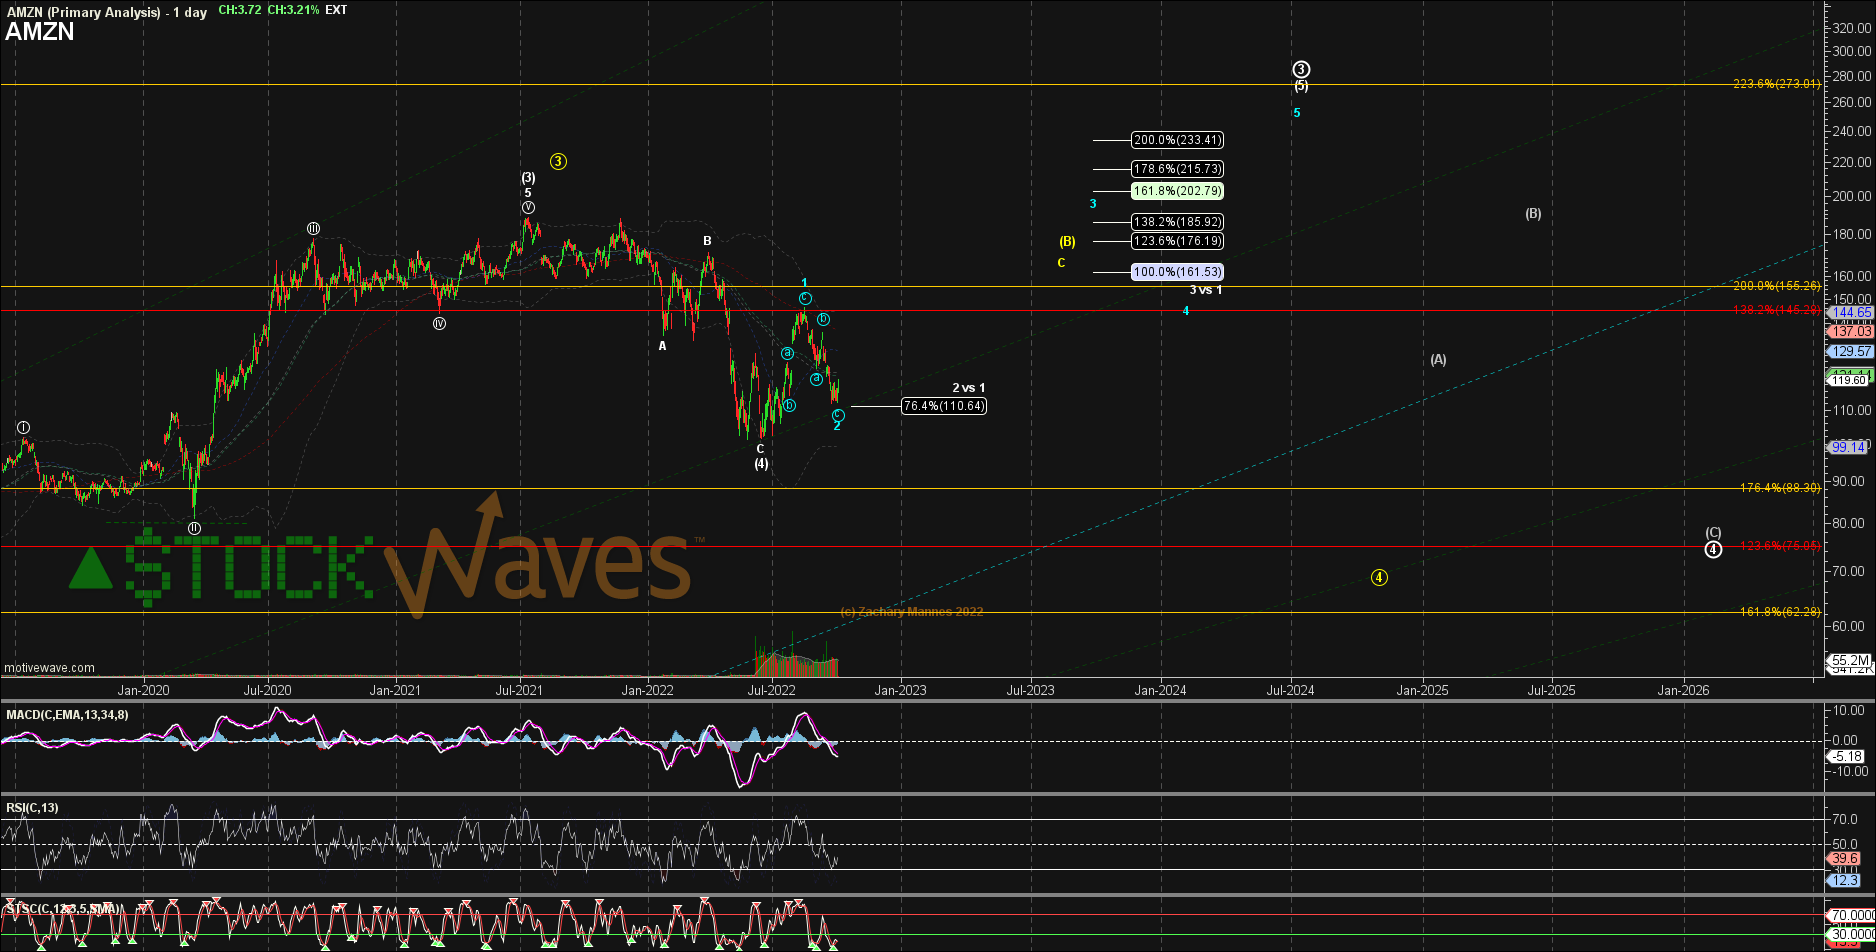
At StockWaves we see this current action as corrective in nature with another major high yet to come. Here’s the setup for a potential swing trade long into 2023.
(see AMZN chart)
Note that the high seen in the summer of 2021 was a third wave of intermediate degree. Now, one year later, the stock has seen what we are viewing as a fourth wave low in place. Since that low there is now a minor degree 1-2 forming.
Nerd Alert!
Zac Mannes is our lead analyst in StockWaves. Although we take our work quite seriously, there is still some fun to be had. Zac recently posted this deep dive into the potential structure of price going forward:
(see Zac AMZN chart)
“AMZN is valid as both a potential 1-2 of an ED for (5) of P.3 or an A-B of (B) already inside P.4. As long as the recent 110.64 low as the 76.4% retrace holds AMZN should head to 161.50+ as either C or a bit higher for 3 possibly to 186+.
Here is the Nerdy bit: Since the "more bullish" potential is 3 of an ED that move should be an abc move where as the C of (B) should be 5up. That means that a more bullish looking 5up3down to the 130s would count better as i-ii of C and a corrective (a)-(b)-(c) up to 140 or 148 would be the more bullish a of 3.”
We actually requested that he distill that down a bit. Here’s the result:
“I am saying that the target region for a yellow C and a blue 3 are not much different off the same support.”
Why Elliott Wave?
Part of the explanation and studies revealed in these articles is this explanation of what truly moves markets:
In a paper entitled “Large Financial Crashes,” published in 1997 in Physica A., a publication of the European Physical Society, the authors, within their conclusions, present a nice summation for the overall herding phenomena within financial markets:
“Stock markets are fascinating structures with analogies to what is arguably the most complex dynamical system found in natural sciences, i.e., the human mind. Instead of the usual interpretation of the Efficient Market Hypothesis in which traders extract and incorporate consciously (by their action) all information contained in market prices, we propose that the market as a whole can exhibit an “emergent” behavior not shared by any of its constituents. In other words, we have in mind the process of the emergence of intelligent behavior at a macroscopic scale that individuals at the microscopic scales have no idea of. This process has been discussed in biology for instance in the animal populations such as ant colonies or in connection with the emergence of consciousness.”
Fundamentals Vs. Technicals? Or, Something Else?
Avi Gilburt has frequently shared this view with our membership:
“Remember that market sentiment is the primary driver when we are dealing with investment products wherein mass sentiment is evident. However, this is not an absolute perspective. Rather, it is based upon a continuum of sentiment.”
“You see, while the SPY is an example of an investment product that presents us with the ultimate in mass sentiment, a microcap biotechnology company may be on the opposite end of that continuum of sentiment. Within the example of the microcap, sentiment can be a factor, but the fundamentals of the company are going to be the primary driver of this stock. And, all products run somewhere within that continuum. The greater the mass sentiment being evident within the buying and selling of that product, the greater probability that sentiment will be the driver of price. And the reverse is true.”
This is one of the main reasons why we use both fundamentals and technicals in our analysis at StockWaves. Now, specifically regarding AMZN, this would fall on the sentiment side of the continuum. It is one of the most broadly owned and traded stocks in the world. That means that the stock price will be more greatly affected by sentiment than fundamentals, but not entirely so.
Risks And Our Conclusion
This is one of the most challenging macro backdrops the market has faced in some time. And yet, we can still find high probability setups by using Fundamentals and Technicals together. AMZN presents a favorable entry here with support at the $109 - $110 region with a stop at or just below the recent low of $101.
As you can see on the charts we have included here, there is a risk that the wave ‘3’ high in the summer of 2021 was one degree higher and that there will be new lows into 2023. However, even in this case, there would still be a bounce from current levels in the red ‘2’ shown on that same chart.
So, will it be Fundamentals or Technicals? Can’t we have both?