AMD: Approaching A Critical Juncture
 By
Levi
By
Levi
By Levi at Elliott Wave Trader; Produced with Avi Gilburt
Human behavior is a fascinating creature. Individuals typically are more rational, perhaps even thinking in their actions. But put this reasoned deportment into a crowd and something else emerges. An entirely new type of doings and ways that a person may look at and wonder at how it is possible.
These emergent crowd behaviors are present all around us. There are some though that have learned by observation and careful practice to track and even project in a probabilistic fashion likely outcomes. Certainly not sorcery nor any type of magic. It’s simply mathematics. And the more we search for these types of patterns, the more we find that they are ever present all around us. You may even be surprised about how this applies to (AMD). Please read on, first noting this excerpt from a series of articles presenting all the basics of our methodology that will set the table for us.
A Brief History of The Basis For Elliott Wave Theory And Fibonacci Pinball
Avi Gilburt shared this in Part-3 of that series:
“Who Was Leonardo Bigollo and Why Does He Matter To Us? Around 1170 C.E., Leonardo Pisano Bigollo, or more commonly known as Leonardo Fibonacci, was born to Gugliemo Bonnacci, a wealthy Italian business man. To give you some reference during which times Fibonacci lived, the Leaning Tower of Pisa was being constructed at the time.
While Leonardo was still quite young, his father was appointed as an official at a port east of Algiers in North Africa. It was not long until Leonardo was traveling with his father through the Mediterranean.
It was during this period of time that Leonardo learned about the Hindu-Arabic numeral system, and recognized that these numerals were simpler and more efficient than the Roman numerals being used in Europe at the time.
It was not long thereafter that he published his famous book Liber Abacci (Book of Calculation). This book was a key turning point in European mathematics, as it introduced the European community to one of the greatest mathematical discoveries of all time, namely, the decimal system, in addition to the numeric system which we still use to this day. This was considered to be the most important advancement in mathematics since the start of the Dark Ages.
Also included in his major work Liber Abacci, Fibonacci worked through a mathematical problem which led him to the discovery of what we call today the Fibonacci sequence, which is based upon Phi, or the Golden Ratio. 1, 1, 2, 3, 5, 8, 13, 21, 34, 55, 89, 144, 233, etc.
Within this sequence, each higher number is the sum of the prior two numbers, and the ratio of any two consecutive numbers approximates 1.618 or its inverse, .618. The higher you move through the sequence, the closer you move towards the 1.618/.618 relationship.
This .618 number has been referred to as the "Golden Mean" throughout history. We also refer to this number as Phi.
Phi is a number which exhibits many unusual mathematical properties, and is also the solution to a quadratic equation. These concepts have been understood by Plato, Pythagoras, Da Vinci, Kepler, Bernoulli, and Newton.
Historic structures have been built by architects of famous Greek structures, such as the Parthenon, based upon the concept of Phi, and even as far back as the architects of the Great Pyramid of Giza in Egypt, who recorded their knowledge of Phi as the building block for all man nearly 5,000 years ago.
What makes Phi even more unusual is that it can be derived in many ways and is exhibited in relationships throughout the universe, such as proportions within the human body, plants, DNA, the solar system, music, population growth, and, yes, the stock market. Phi is the one underlying constant throughout all of nature and governs the laws within nature. In fact, the greatest minds of history, such as Pythagorus, Plato, and Kepler, all felt that Phi was the key to the secrets of the universe.” - Avi Gilburt
Slow Down, Professor - What Does This Have to Do With AMD?
Let’s talk about that. When you see the price fill in data on a chart like (AMD), know that there is much more at work than machine algorithms or individuals someplace somewhere pushing and pulling levers. This is crowd behavior in motion. And we also know that we can track and then project this type of movement with some certainty as to future action.
Now, this is not to claim that it will never have any variance from the projected path. But this same methodology will inform us when our scenario needs adjustment or even when it may invalidate. So, let’s apply what we have learned to the (AMD) chart and see why this next high, if/when struck, may be critical to the proximal months to come.
Theory Put Into Practice
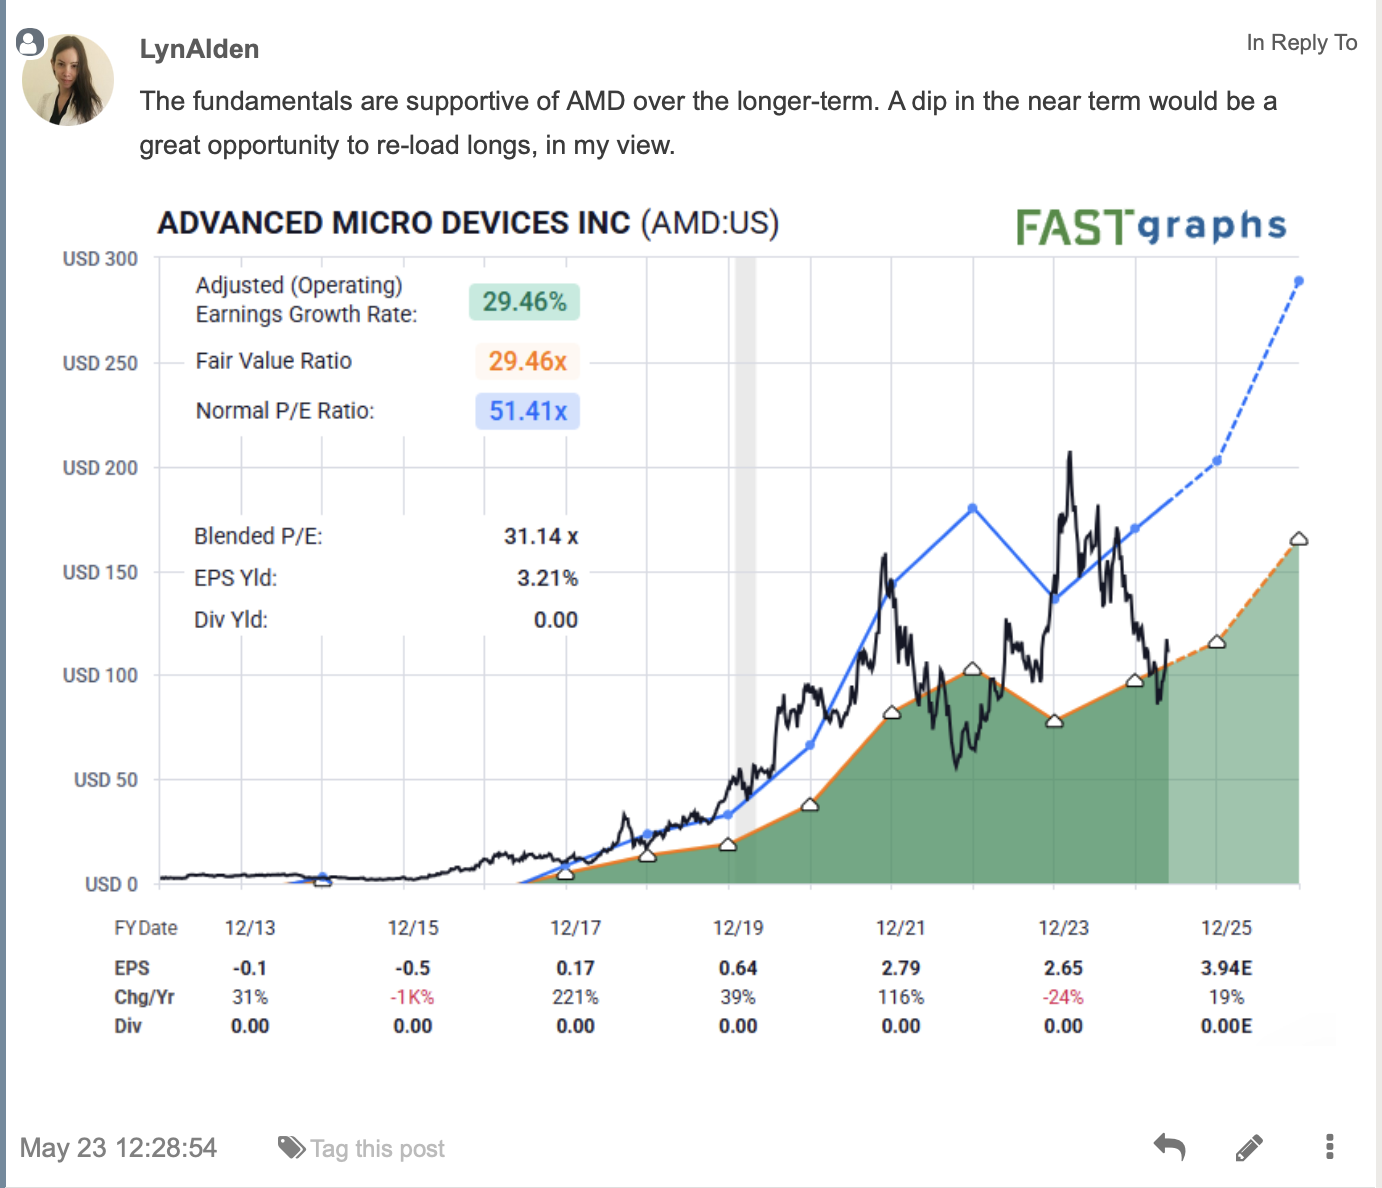
Here is our thesis for the current snapshot for (AMD) courtesy of our lead analyst, Lyn Alden:
If we are looking for a pullback of sorts from the next high, when might we be able to capitalize on a lower price for a trade setup? This is precisely where Elliott Wave Theory, when correctly applied and used with the overlay of Fibonacci Pinball, truly shines bright.
Here is how it just may play out.
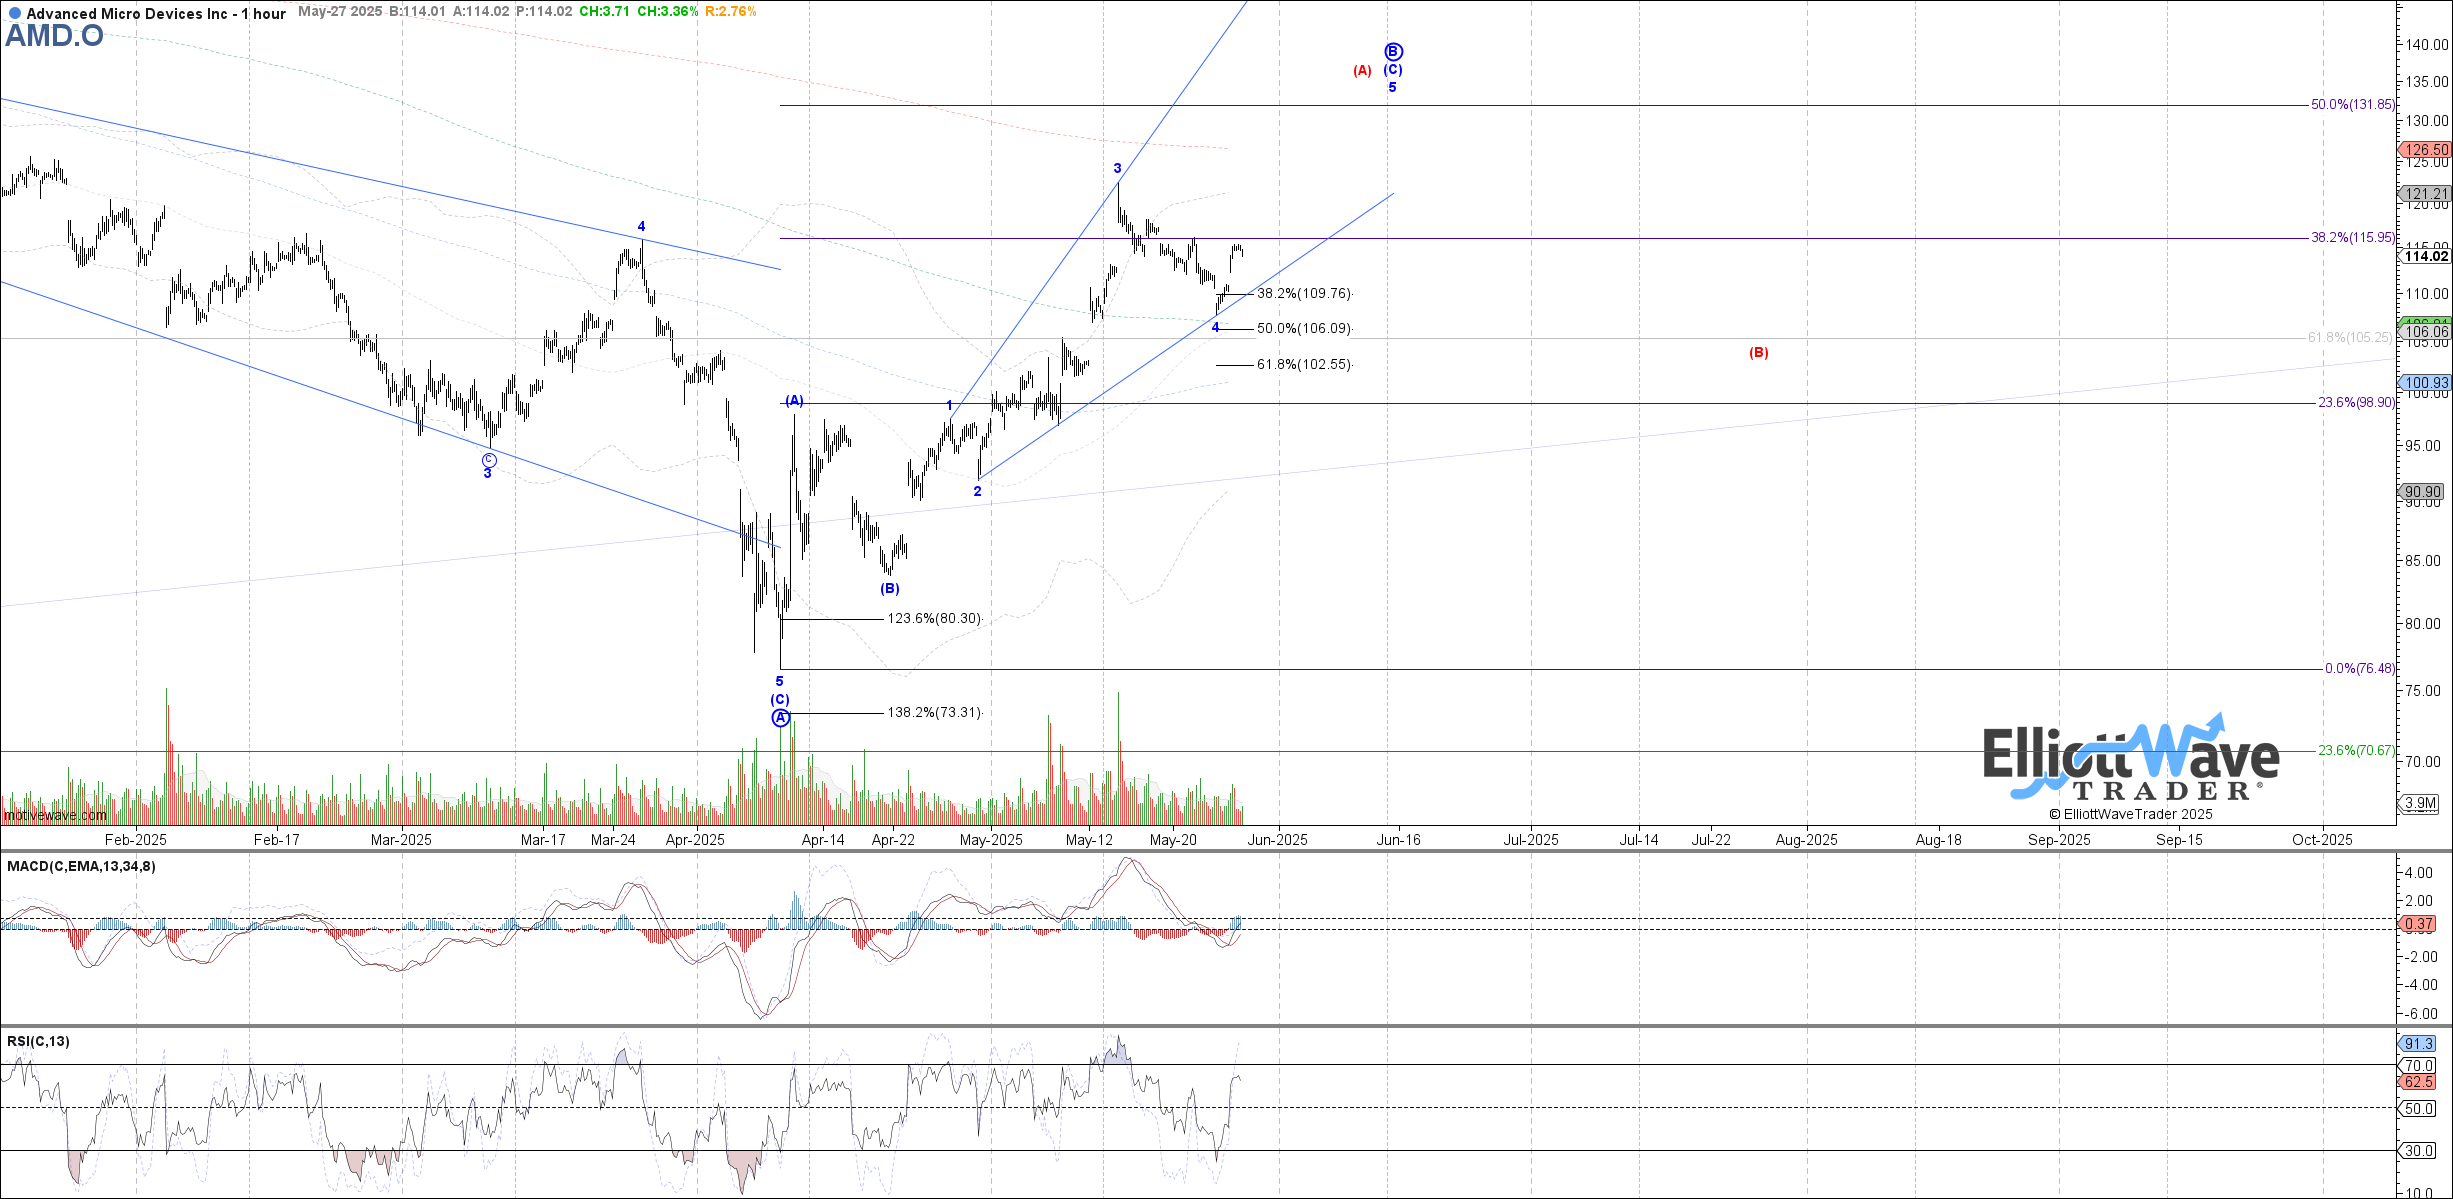
Note on the chart that it would seem likely (AMD) has put a low in for wave 4 of (C) of a larger Primary Wave B bounce. Also, you will see how there are two likely outcomes from that next high; a blue path and a red path. The probability for each will come down to the reaction of price once 5 of (C) completes.
If we are going to see a Primary Wave C down then price should form a 5 wave structure from the Primary Wave B high. If instead the red path will rule price should form a 3 wave corrective pullback, perhaps in a smaller a-b-c manner for a lesser degree B wave. But, wait, there’s more - once that red B wave fills out price should then form 5 waves up to signal move higher for a potential red wave C (not shown yet).
Now, this may sound like a bit to digest and assimilate. But once you have the nuances down, it really does simply the decision making process for each trader and it also will clearly provide risk versus reward and either confirmation or denial of the scenario.
Does This Really Work? See The Results For Yourself
We will be the first to tell you the answer to that question: “Not always”. However, we have yet to find another analysis methodology that can provide context at any moment in time for the observed market/stock. Nor have we found another tool that can dynamically adapt in real-time to the markets as this does.
Over time with a large sample size of setups, you will come to appreciate the utility of this analysis method for your trading and investing. Of course not all setups are going to play out as illustrated. That is simply the nature of dynamic markets in action. This methodology will tell you when to shift your weight and when the scenario invalidates.
So, a setup can be wrong. The opinion of the analysts may need revision. It’s OK to be wrong - just don’t stay wrong. Does your current method tell you when to adjust your view? We should be students and observers of the emotions ever present in the markets. But we don’t benefit from becoming participants in this sentiment.
There is much more education available in the articles shared with the readership as well us a plethora of resources at your disposal in our Help Section. Yes, there are nuances to the analysis. Once familiar with our methodology, our members discover a powerful ally on their side to provide guidance and risk management in their trading/investing.
