ALERT: This Could Be The Start
There is no doubt that the smaller structures we have been seeing in the metals complex of late has been quite convoluted and difficult to follow. You see, a standard correction takes shape as an a-b-c structure, wherein the c-wave is a 5-wave standard Fibonacci Pinball structure. And, if you have followed our work over the last several months, you would know that this is not what we have been experiencing during this pullback in the metals.
However, we have tried to remain focused on the bigger picture, which suggests that 2024 will likely see the heart of the 3rd wave rally in the metals complex. And, he action we are seeing this morning is giving us some initial indications that it may be starting.
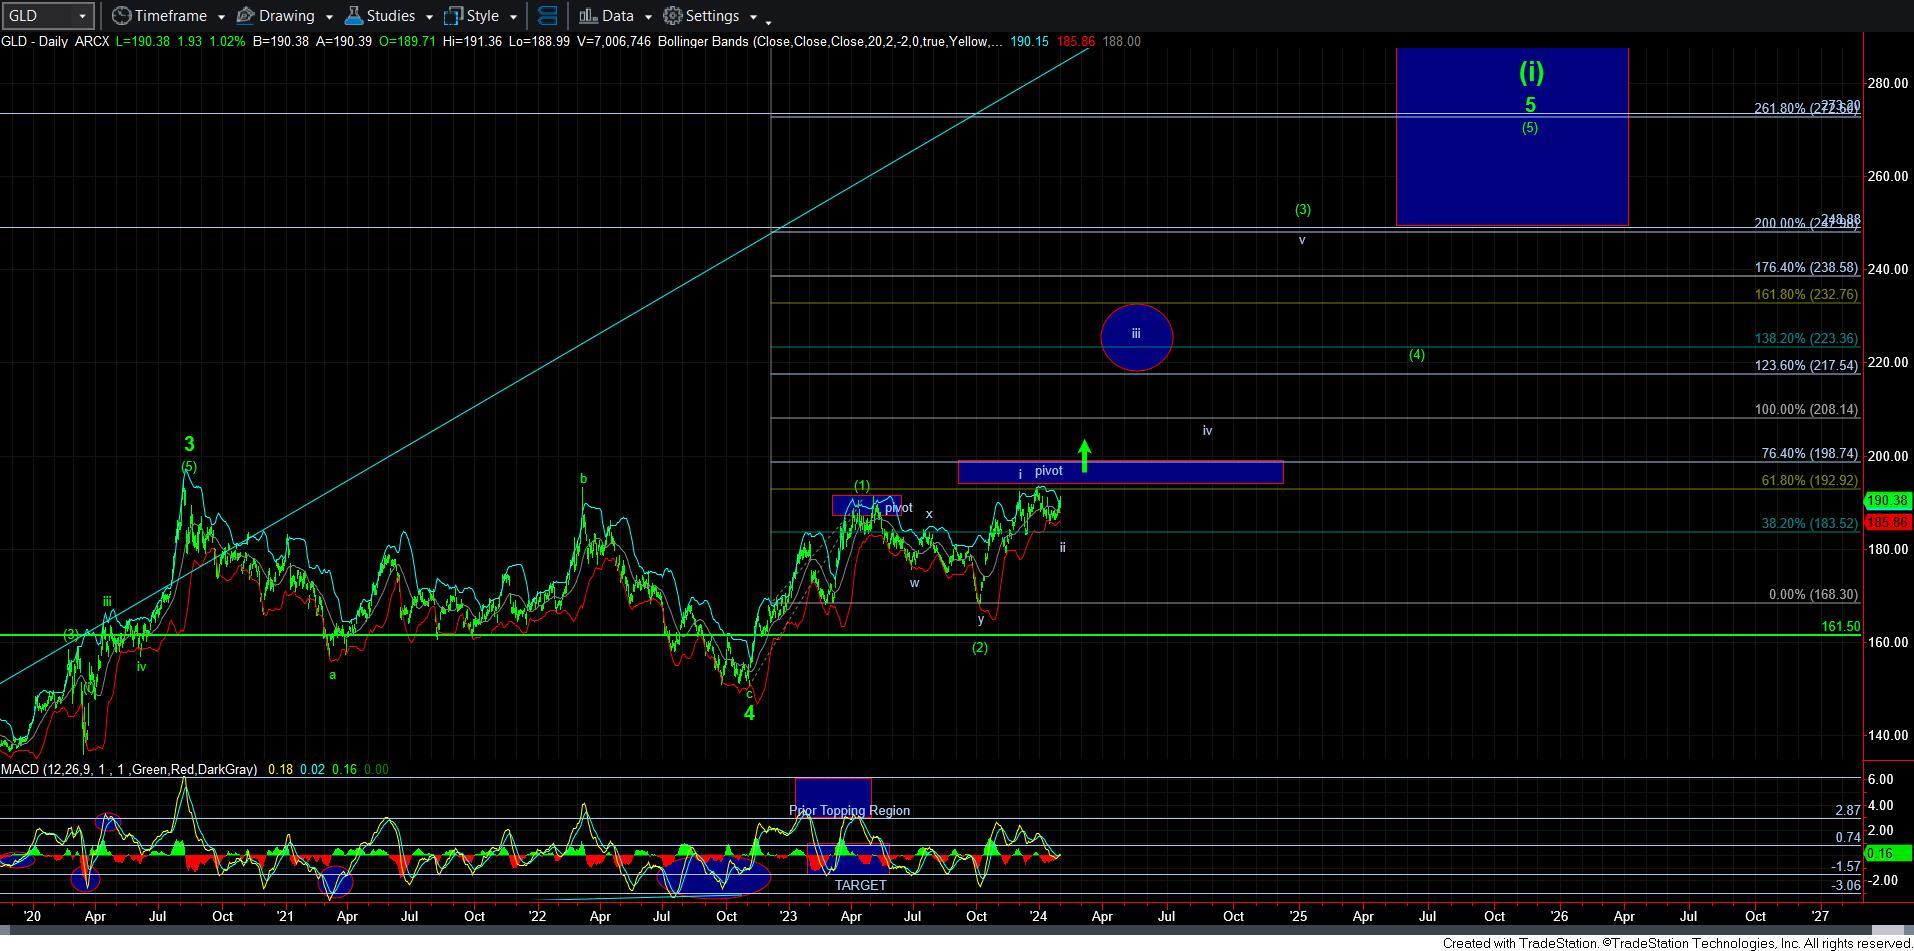
First, GLD has slightly exceeded its initial resistance point, which has invalidated the structure I was following of late. And, while we still could see one more decline before this correction is over, the bigger picture tells us to remain on our toes as a wave iii of [3] can begin at any point in time now.
Yet, I must also add that the structure in GLD off the recent low is not exactly a clearly impulsive one. However, I have seen them start out in very overlapping manner and then just explode in the past once they are ripe. The bottom off the end of 2015 low was a great example.
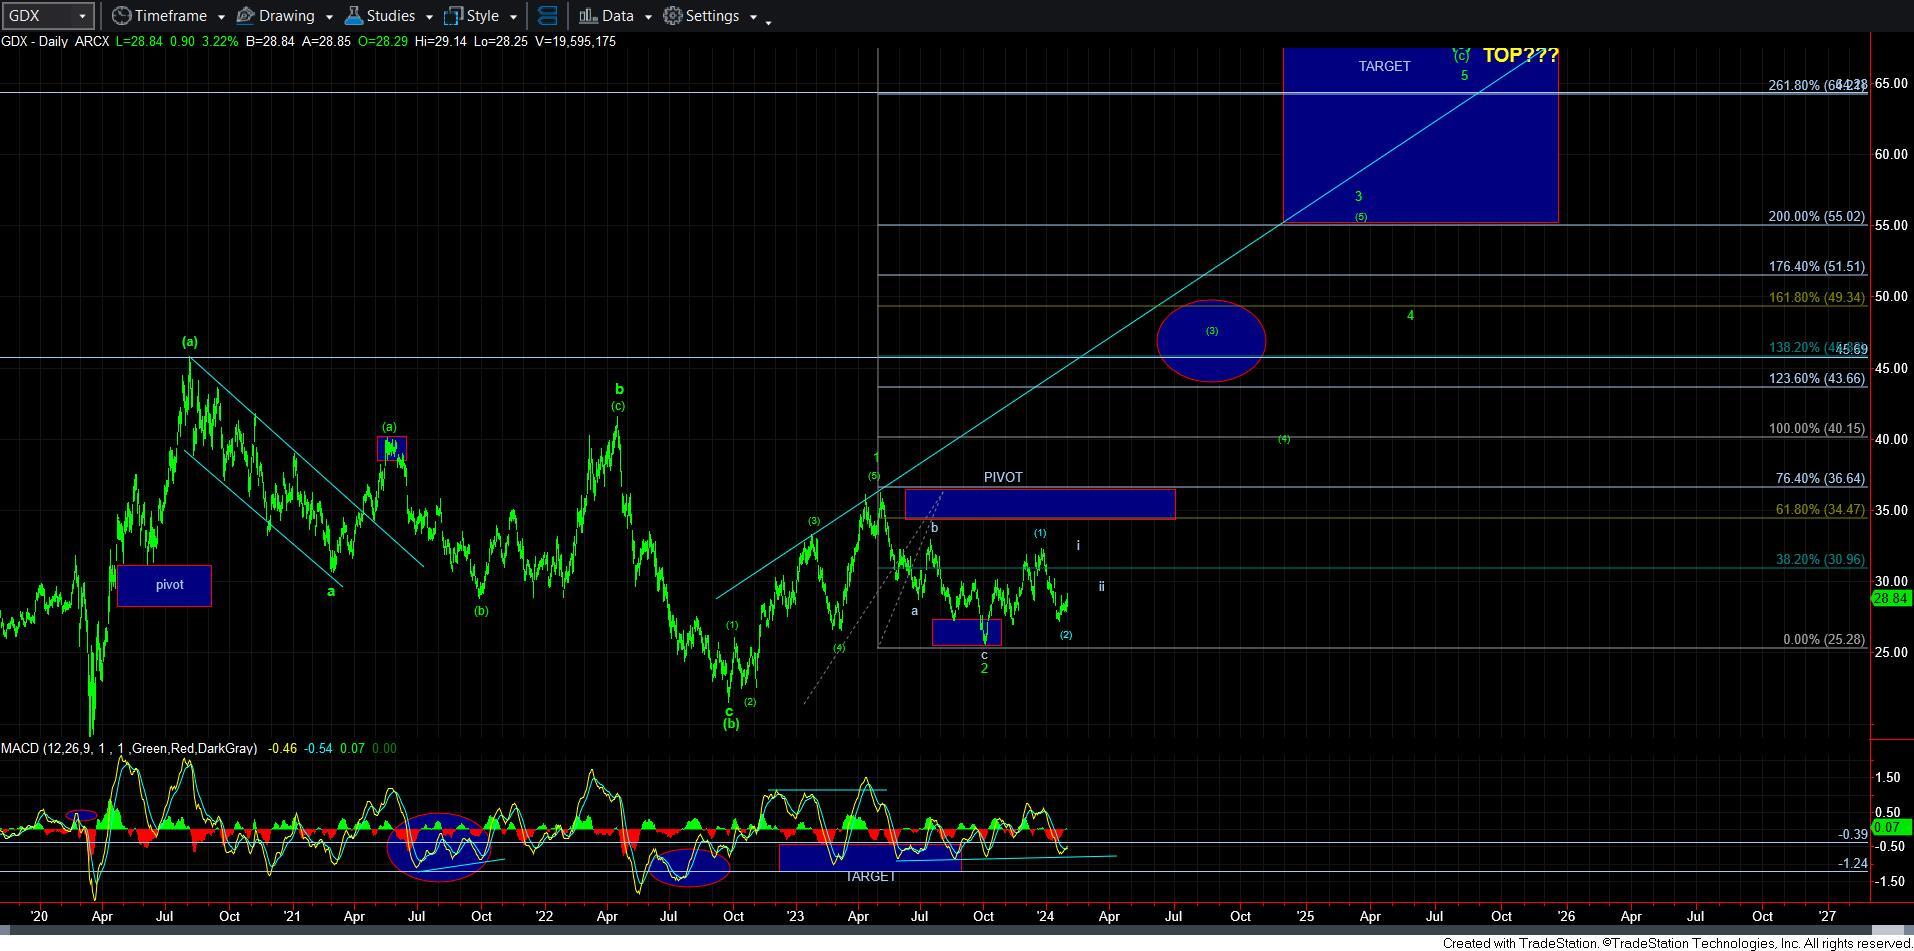
GDX is the exact same issue as GLD, so I wont go on and on about that as well.
But, silver is where we are seeing much better potential action.
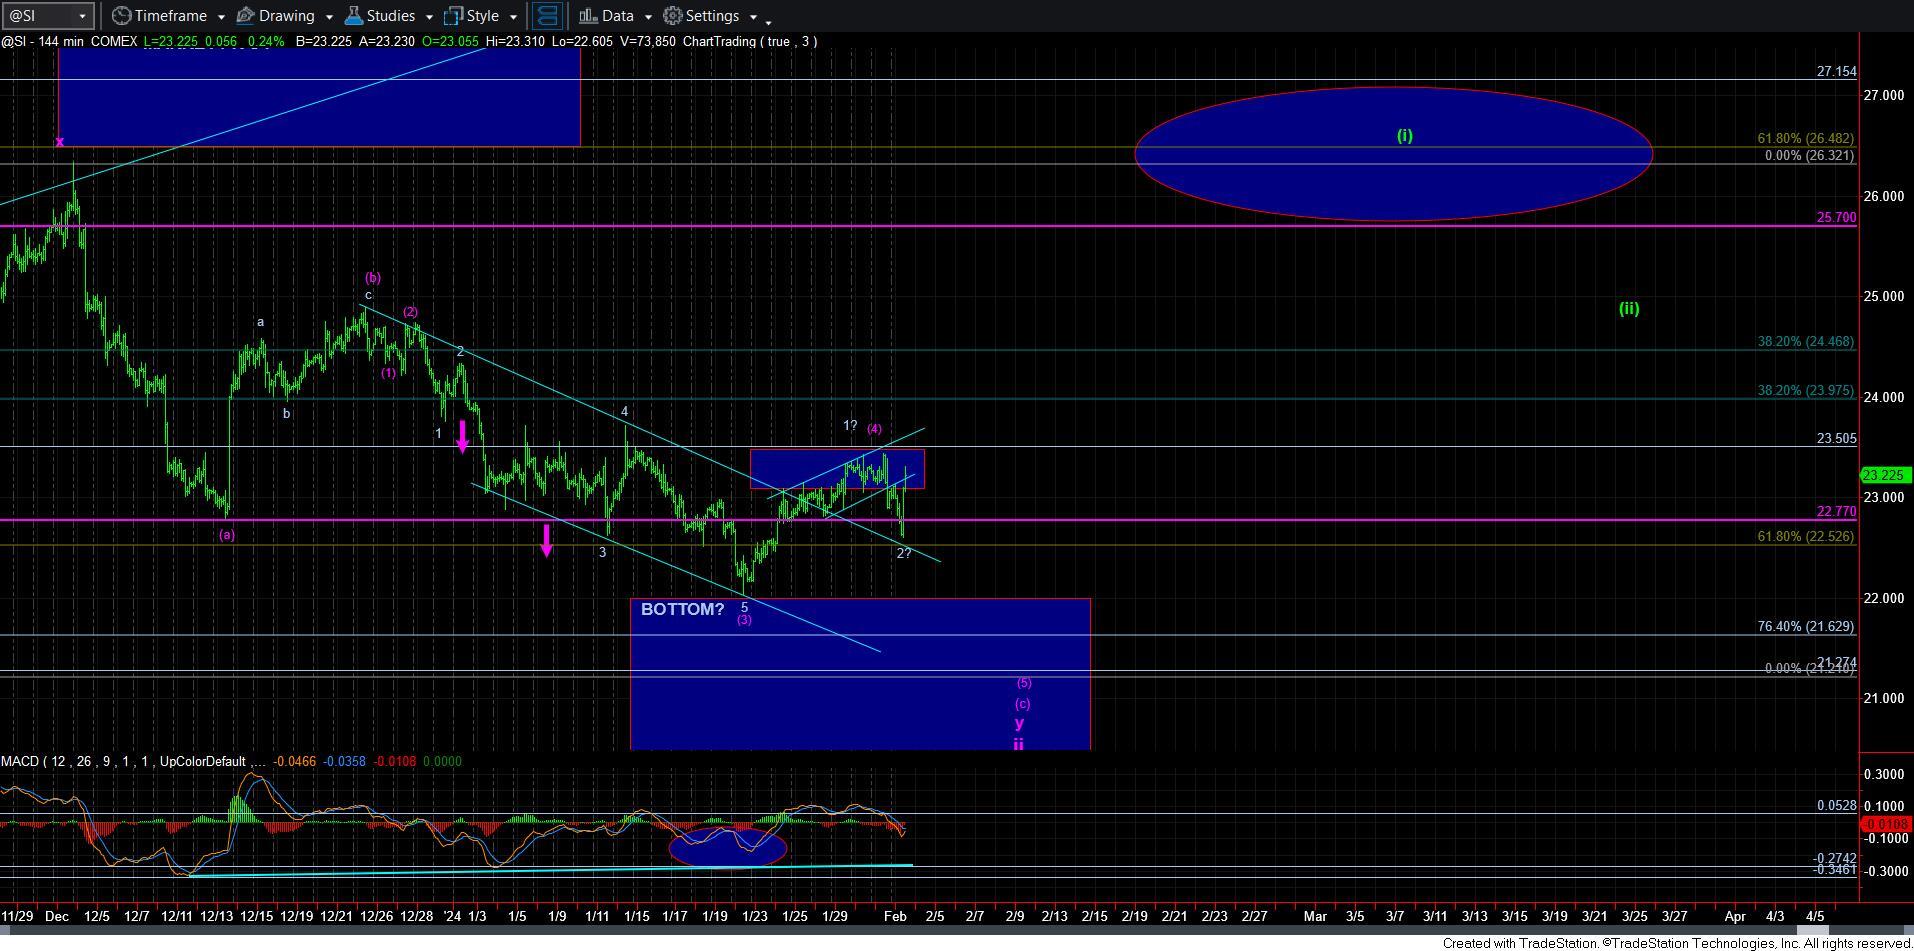
As I have been outlining of late, silver hit the minimum target when it struck the top of the blue support/target box on the 144-minute chart. And, while the initial rally off that low was not the cleanest of 5-wave structures, I could make one out, as I noted. But, here is the kicker. Thus far, silver has the “look” of another 5-wave structure in progress off the pullback low struck today.
So, right now, I am suggesting that you go on alert for a potential that we are about to begin the next major rally phase. Yet, I do want to put your expectations in check. When you look at the 144-minute silver chart, you will see that I am still looking for one more [i][ii] structure, which is outlined on the right side of the chart, before this is ripe for the melt-up stage. (Take note that I am looking for something similar in GDX as well). And, if I had to guestimate, I would probably say it would begin sometime in the spring of this year.
Again, I am sending this update out to just tell you to stay on your toes. Today’s action could be the start of the next phase. But, I want to a bit more evidence – such as silver breaking out over this week’s high – to give us stronger clues.