ACHR: Charting A Bullish Flight Path
 By
Levi
By
Levi
By Levi at Elliott Wave Trader; Produced with Avi Gilburt
A simple search for Archer Aviation and the emergent eVTOL technology will capture your imagination with near-future visions that almost feel sci-fi. For those with a forward-looking perspective, ACHR may just fit the bill for the bullishly inclined.
However, in this insight piece we want to discuss another way of viewing the markets and stocks like ACHR. Yes, the fundamentals of a company like Archer are clearly important. However, they are not likely to lead the turns of price on the chart. The best of appearances may exist regarding fundamentals, but if the crowd is not “feeling” it, the stock is not likely to move as much as one might expect.
What is this different manner of viewing the markets and how can it help you to potentially have another advantageous utility in your repertoire of trading and investing? Let’s discuss how crowd behavior can be tracked and projected by using mathematics and the fractal nature of the markets. Please keep an open mind for the next few moments so that we are able to pour the foundation and then illustrate how to use this information with ACHR as a case study.
A Brief Overview Of Our Preferred Methodology
Avi Gilburt has made in-depth studies into the basis for this method of analysis. He has also published extensively on the how and why of Elliott Wave Theory. Of course, this method must be correctly applied.
The fascinating part of this methodology is that its building blocks have always existed. It was when these were observed and recognized that we then learned how to harness them to add predictive value. Elliott Wave as we know it came into existence. Avi has published many pieces regarding these origins. He wrote this regarding one of the individuals that began to recognize how markets moved.
“Bernard Baruch was an exceptionally successful American financier and stock market speculator, who lived between 1870-1965. He identified the following long ago:
‘All economic movements, by their very nature, are motivated by crowd psychology. Without due recognition of crowd-thinking ... our theories of economics leave much to be desired. ... It has always seemed to me that the periodic madness which afflict mankind must reflect some deeply rooted trait in human nature – a trait akin to the force that motivates the migration of birds or the rush of lemmings to the sea ... It is a force wholly impalpable ... yet, knowledge of it is necessary to right judgments on passing events.’ - Bernard Baruch
This is why any investor who is able to rise above news and emotion, and identify the prevailing social moods and trends, will have a significant advantage over other investors, as Mr. Baruch clearly understood.
This is exactly why I use Elliott Wave in my analysis. In theory, it understands that public sentiment and mass psychology moves in 5 waves within a primary trend, and 3 waves in a counter-trend. Once a 5 wave move in public sentiment is completed, then it is time for the subconscious sentiment of the public to shift in the opposite direction, which is simply a natural cause of events in the human psyche, and not the operative effect from some form of ‘news’.” - Avi Gilburt
Yes, there is much more to the inner nuances of this analysis as well as its history. But this gives us a starting point to look at the ACHR chart through that lens.
Viewing ACHR Via Crowd Behavior
What are the crowds feeling regarding ACHR? Let’s answer that, but also, why are we asking about ‘feelings’ rather than ‘thoughts’? Because crowds are not rational, thinking, logical entities. Perhaps individuals on their own would like to fashion themselves as such. But crowds exhibit an emergent type of behavior. There are predictable patterns that can be projected through Elliott Wave analysis. That is what we will do with ACHR.
Many times our lead analysts in StockWaves will be tracking a chart that appears to be nearing a favorable scenario, be that bullish or bearish. Once the structure of price on the chart fills out a likely pattern with defined risk versus reward, they will publish a Wave Setup for members. Here is an example of what that looks like, using ACHR:
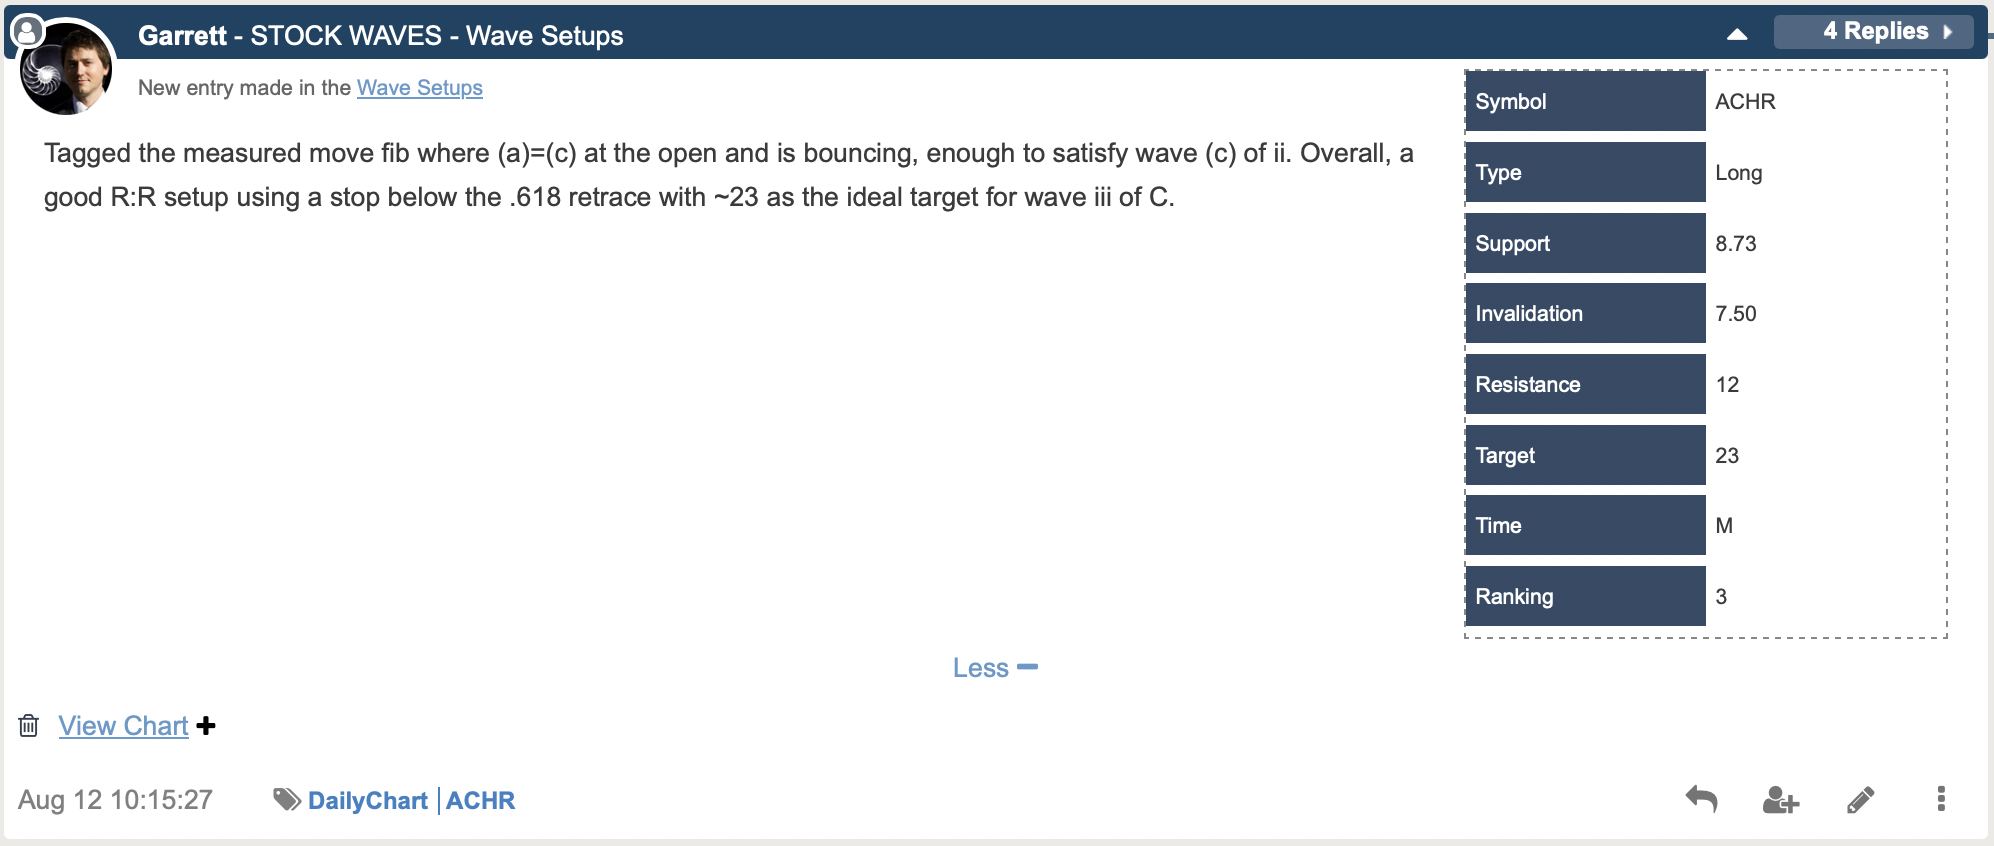
This setup includes clearly defined parameters. And, as a visual, here is the chart updated with recent price action:
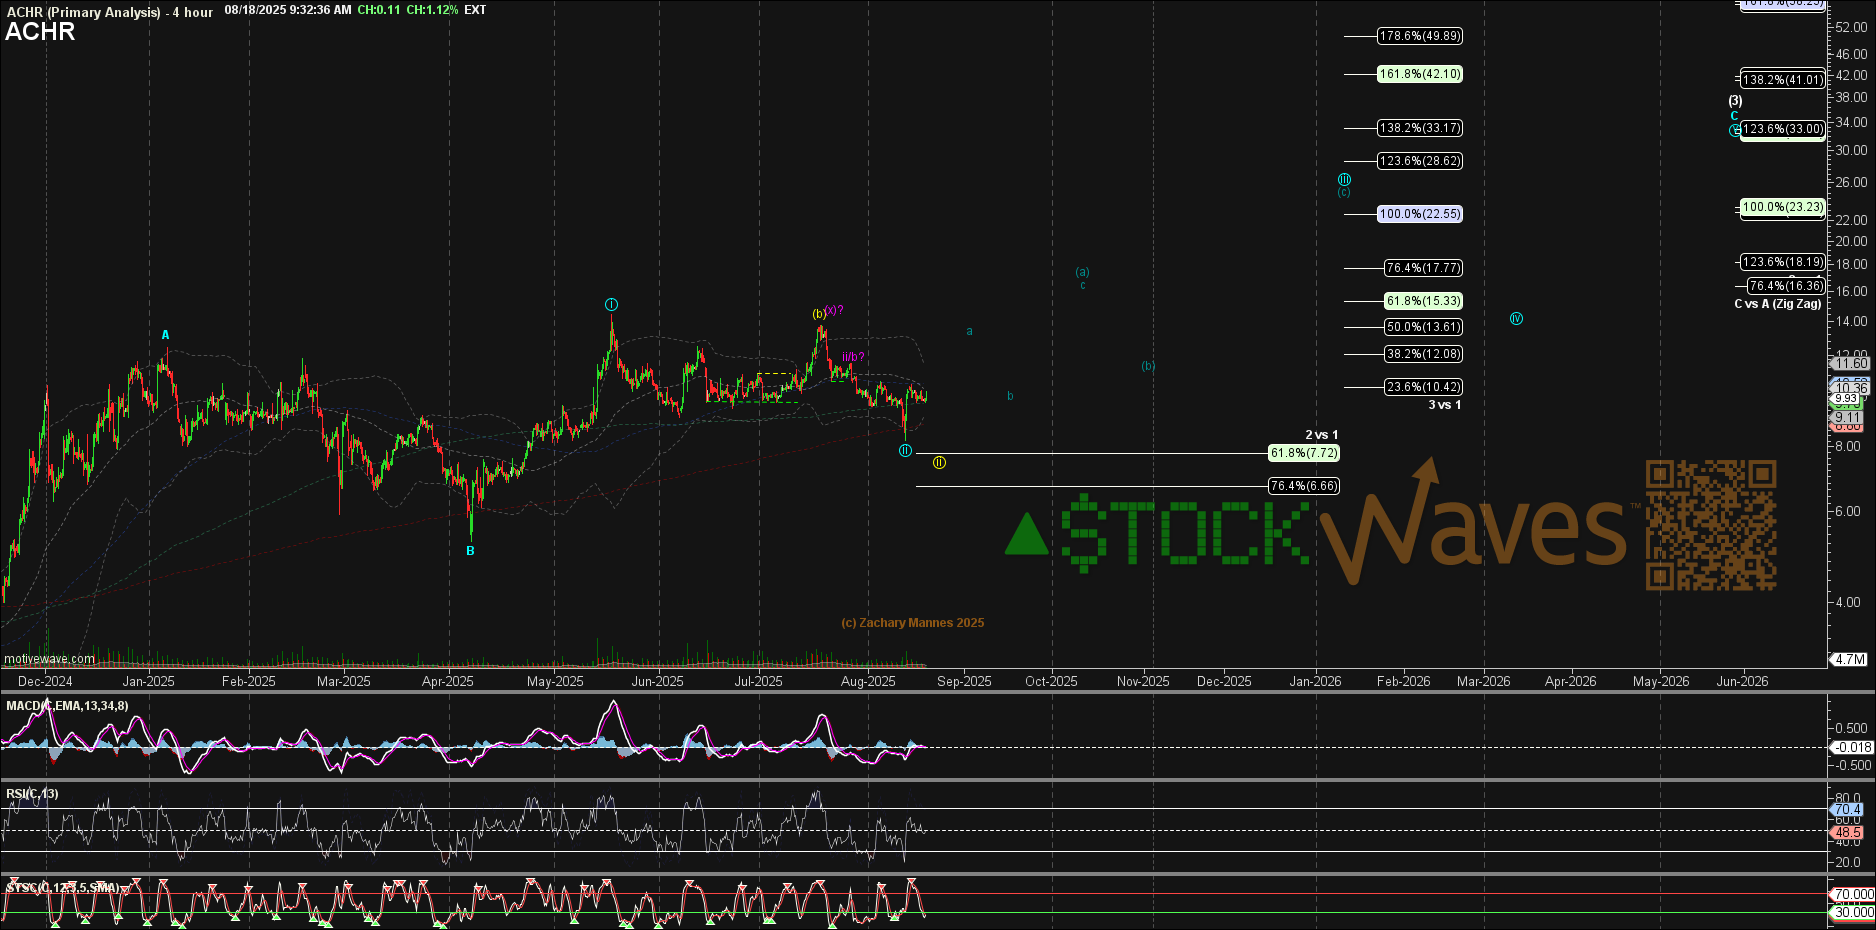
Zac Mannes shared this in a post early Monday. The structure is suggesting that price has found an important low after the latest earnings announcement. The structure suggests ACHR is in the C wave of a larger wave (3).
A typical target in a move with this type of setup is $23, but could be as high as $28. Subwaves within this segment will refine targets as the structure unfolds and probabilities tighten.
And, keep in mind that we have our current invalidation level for this setup. As well, our analysts will update this ongoing Wave Setup as price progresses over time.
Conclusion
We could further discuss United Airlines (UAL) and their strategic partnership with ACHR. Also, ACHR boasts over $1 billion (nearly $1.7 billion according to their last news release) in liquidity that will allow them plenty of time and fuel to achieve lift-off for their vision of flight. While ACHR’s story runs deeper, once a solid foundation is established, we turn to price structure for confirmation. Why is this?
Crowd behavior as manifested in this structure will be the quickest indicator as to direction and turns at key moments. It will give us likely risk versus reward and communicate in rapid fashion whether or not we continue to be correct in our assessment or if we need to shift our stance.
All of this can be revealed simply by studying price structure on the chart. It does sound rather straightforward and uncomplicated. And, in reality it is so - with some variability. We continually educate our members regarding this methodology. Come see how we do this every day!
