A Warning to Perma-Bears
 By
By
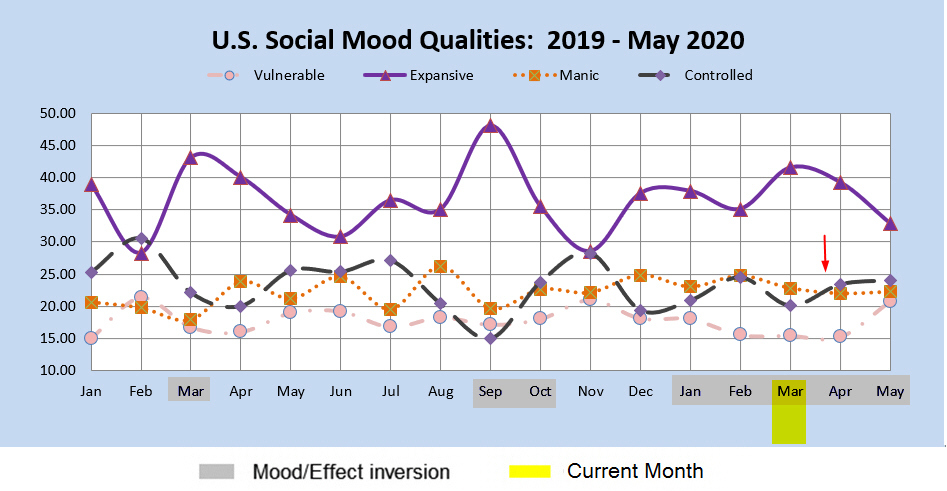
As scary as new deadly viruses and unprecedented market drops are, I would like to remind everyone that some type of global crisis was baked in for some time. Back in January, I posted charts on this, showing that global crisis mode was in the monthly chart through March, and showing in the Quarterly chart through Q2. I know it's currently the end of the world as we know it. Just ask the VIX. However, the "global crisis" mode shifts to "government intervention mode" by April and into May.
In the earlier post I described how the Orange (Manic) and Black (Controlled) lines parallel and/or close together with (mood vs. effect inverted) signal a crisis period. With this showing as a multi-month event on a monthly scale, that was calling for something huge and possibly unprecedented. By April, these two lines invert (see chart) which implies "government intervention mode." While some central banks and government spokespeople have already begun this to some extent, the markets have so far shrugged it off. However, later this month or early April, you should start to see the most unbelievable rallies you've ever seen. It doesn't tell us anything about whether the virus is gone or not, but it's saying that the perception should at least be that stuff is happening or being done to help. This pattern showed up in 2008-2009 every time a bailout occurred or some other drastic measure to intervene in that era. It didn't stop the crash. The crash stopped when the mood pattern shifted. However, the giant rallies still occurred along the way, and people who were short got wiped out several times. Consider this a strong warning to anyone who continues to be short (or long volatility) over weekends. The closer we get to April, the higher the risk.