A Bottom? Color Me A Bit Cautious Of Metals Still
Yes, I know this has been a nice move off the lows, yet it is not one upon which I can place heavy reliance just yet.
While I have been trying to pound the table regarding a “bottoming structure,” which was supported by the positive divergences evidenced by the technicals as I have been outlining over these last few weeks, I have wanted to see a standard impulsive 5-wave structure off a low to signal that a bottom has been struck. That is not what we have seen thus far. Rather, the move off the low has been rather overlapping and uncertain.
Now, to be honest, there have been a number of past rallies in metals which have begun with similar amorphous structures. But, while I have been looking for a bottom to this pullback, I still cannot rely upon an overlapping structure for aggressive positions until the market proves there is a strong reason for me to rely upon it.
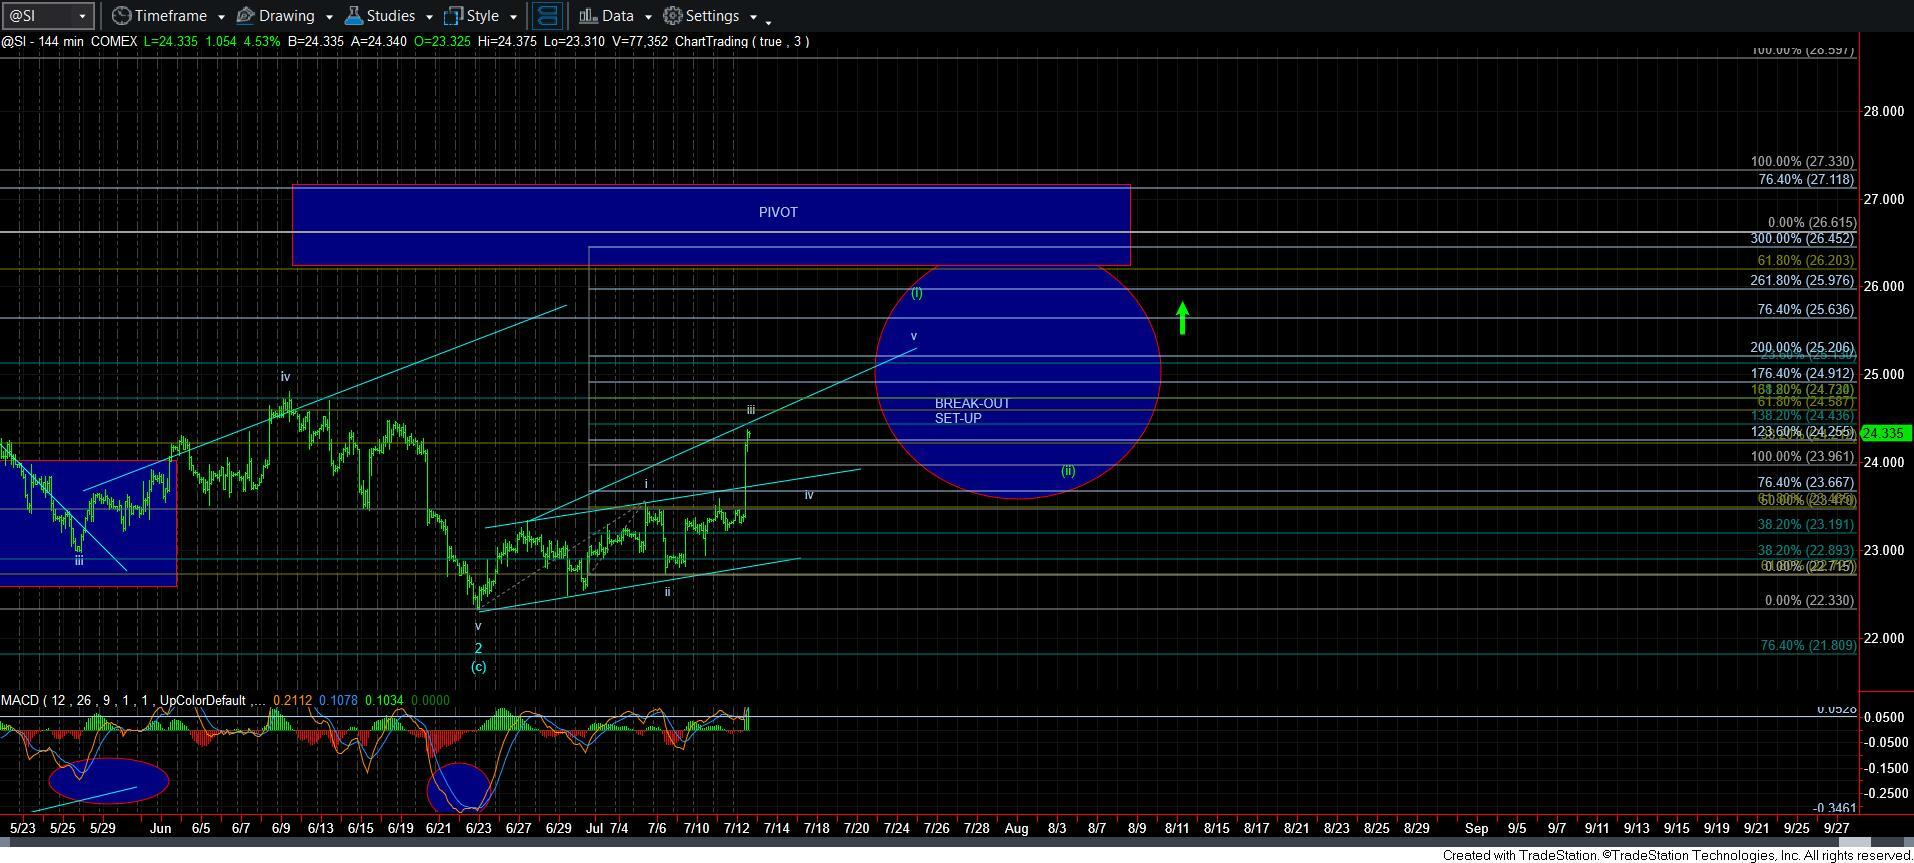
When we look at silver, the divergences we have been pointing towards has again outlined a bottoming structure for us of the 144-minute chart. Yet, the rally we have seen off that low has been quite ugly. I am forced to count this rally as a leading diagonal, within which we are approaching the completion of wave [iii]. And, as you may already know, I do not place a lot of faith in leading diagonals. I would need to see all 5 waves completed, a corrective pullback in wave [ii], followed by an impulsive rally through the high of wave [i] to proclaim the “melt-up” phase has begun.
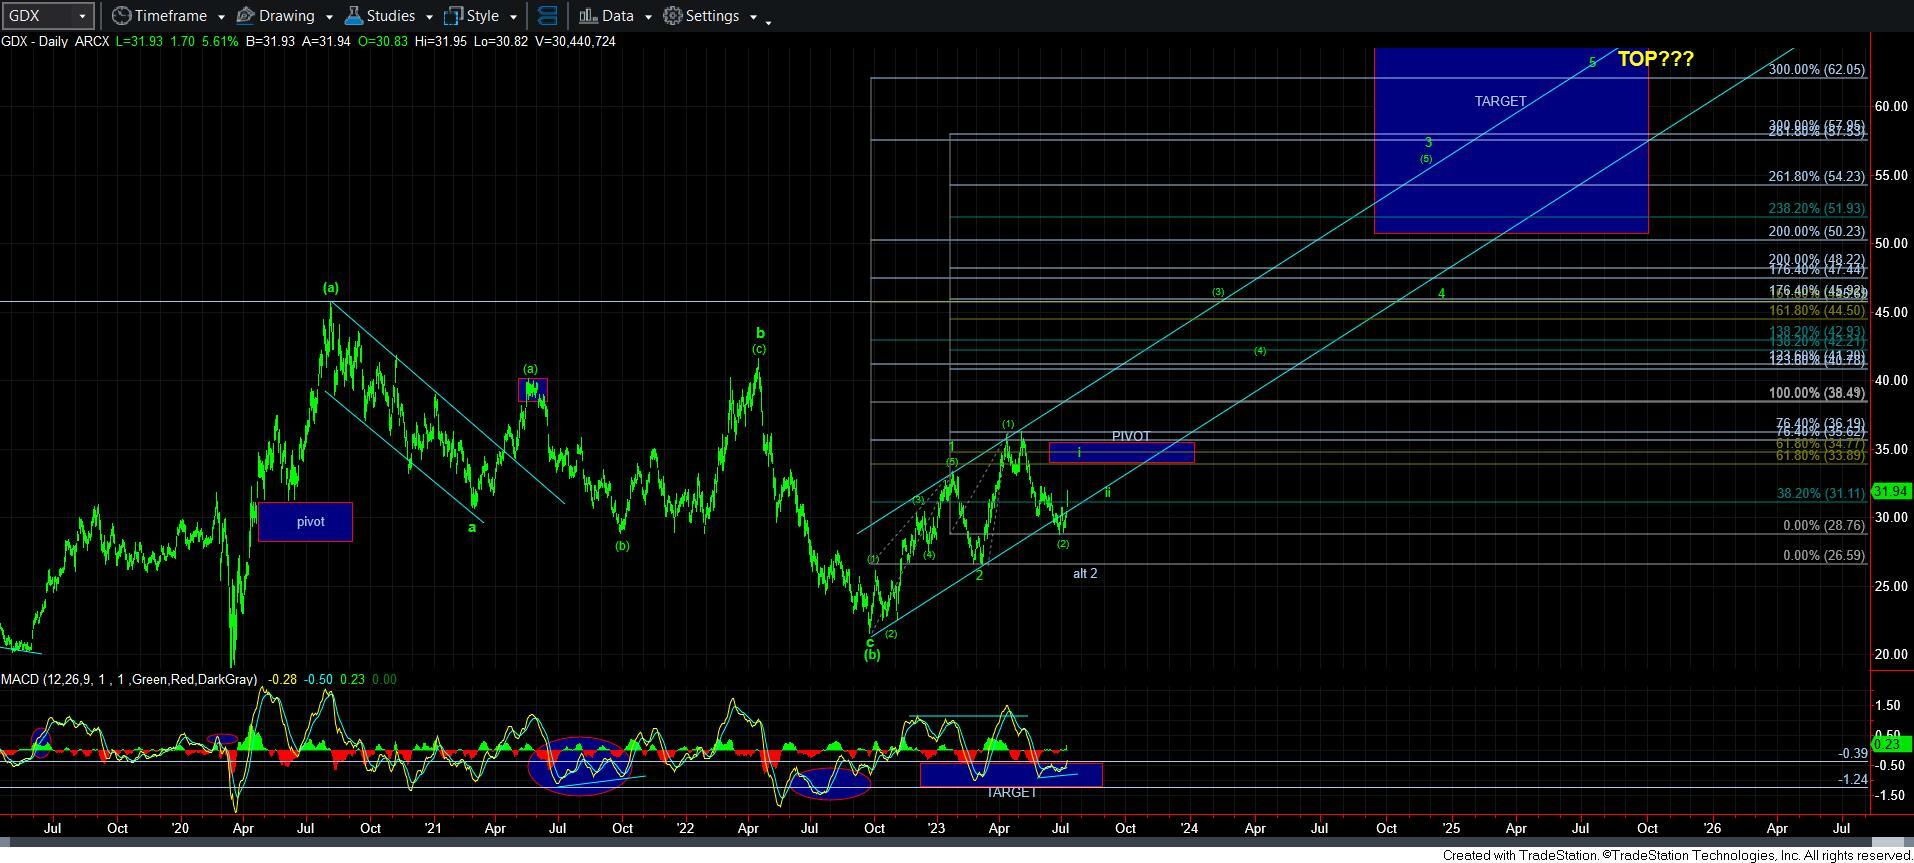
The GDX has been the chart that has presented us with the clearest bottoming signal. However, the micro structure was uncertain as to whether one more marginal lower low could have been seen. With the move today, it makes that potential much less likely. Yet, I still do not have a 5-wave rally off the recent low. My preference would be to see a continuation towards the 34 region to complete wave i of [3]. The basis behind this expectation is that the .618 extension of waves [1][2] is the ideal target for wave i of [3], and that is the 34 region.
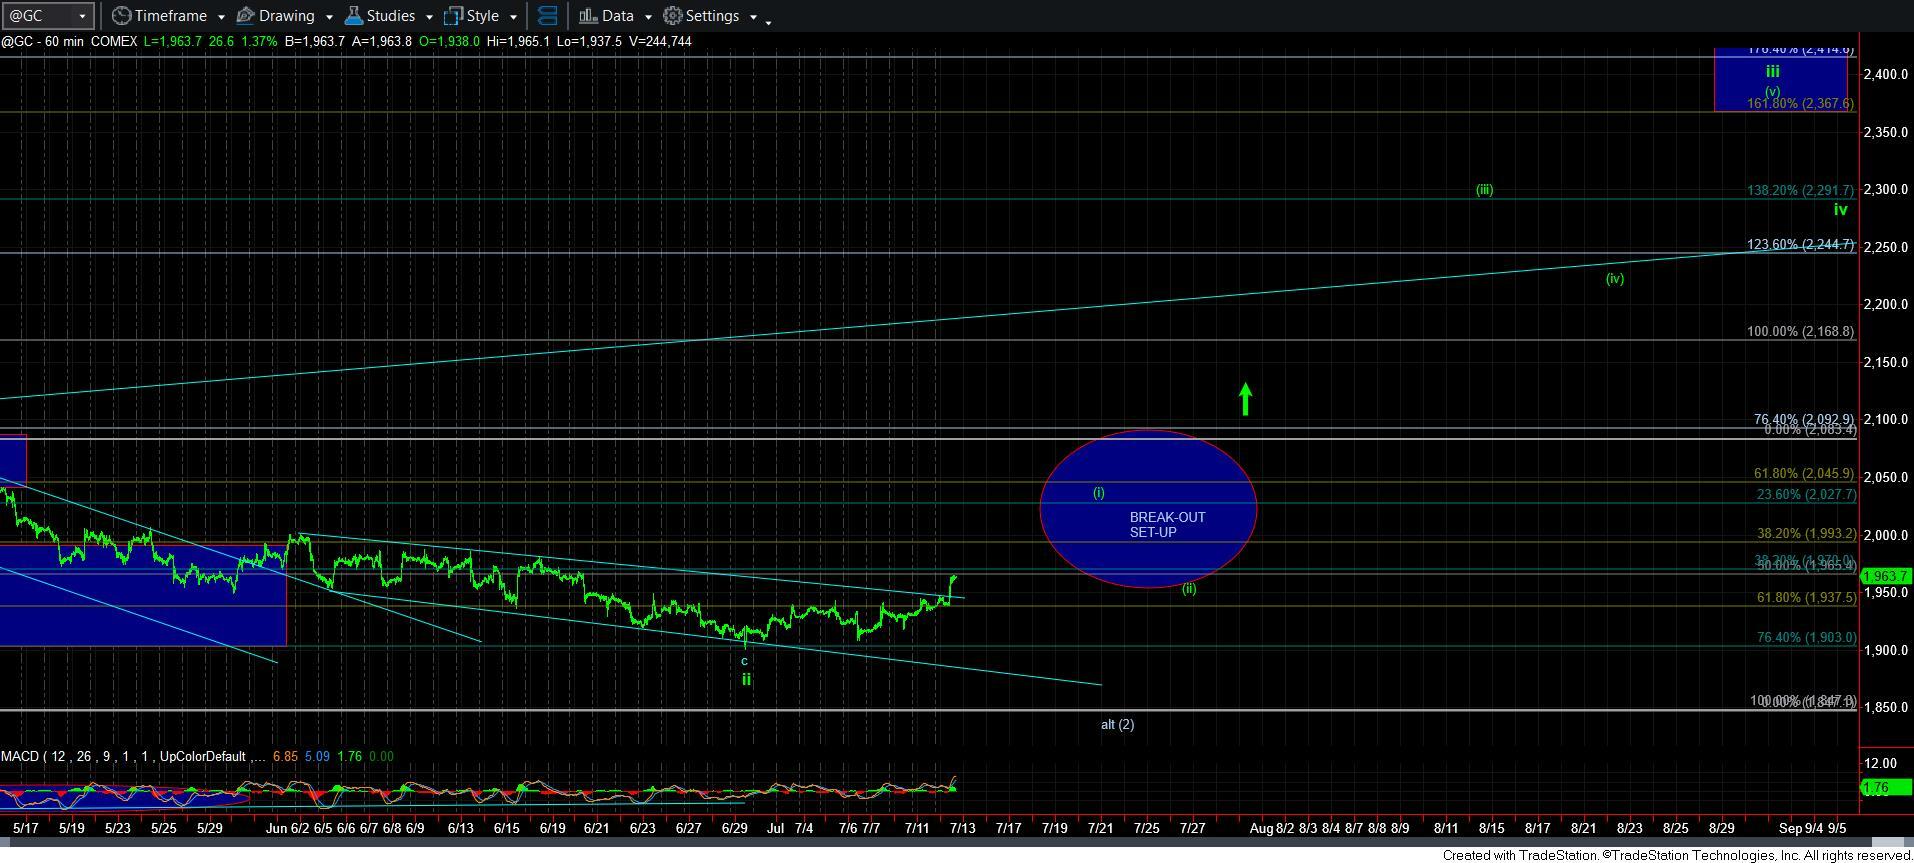
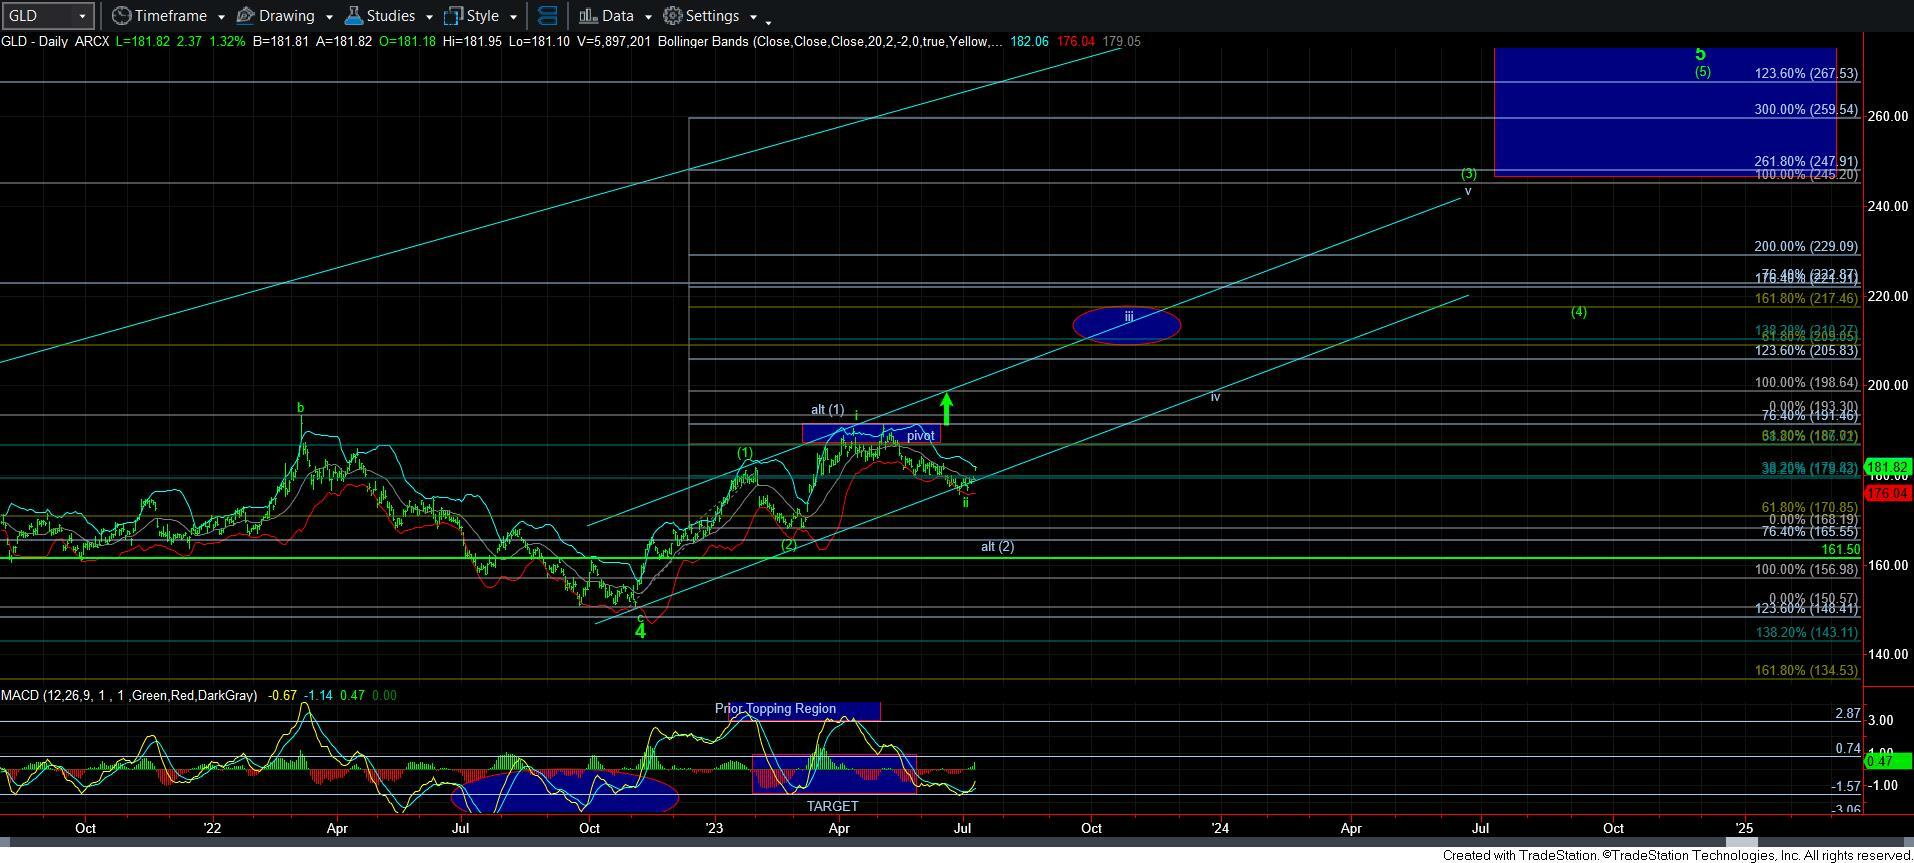
Gold happens to win the award for ugliest chart right now. I am simply going to allow it to run and see how it develops, as it is also likely in some form of leading diagonal. But, take note that the GLD daily chart MACD has now turned up, and strongly suggests that the low is likely in place for now. But, I would say that this structure gives me the least confidence right now.
The commonalities of all the charts revolves around an expectation for a 5-wave rally structure to complete off the recent lows. If we can see that take shape in the coming week or two, then we can finally build the “break out” structure outlined on the various charts.
As for me personally, I noted that I had intended to deploy aggressive long positions in the metals complex. I have deployed approximately 50% of what I intended thus far. The main reason I have not deployed more is due to the uncertain structure of the decline in silver and gold. My intention is to deploy half of the remaining amount should we see a corrective wave [ii] pullback after a 5-wave rally completes, with the last amount on a break out over the high of the initial 5 waves up after wave [ii] completes.
So, while the action is suggesting that a low has been struck, I still have no indication that the rally is starting the next major bull phase in the market that I expect. I am going to allow the next [i][ii] to provide us with our “break-out” set up before I turn fully aggressive.