3rd Wave or B-wave? Both Have Same Outcome
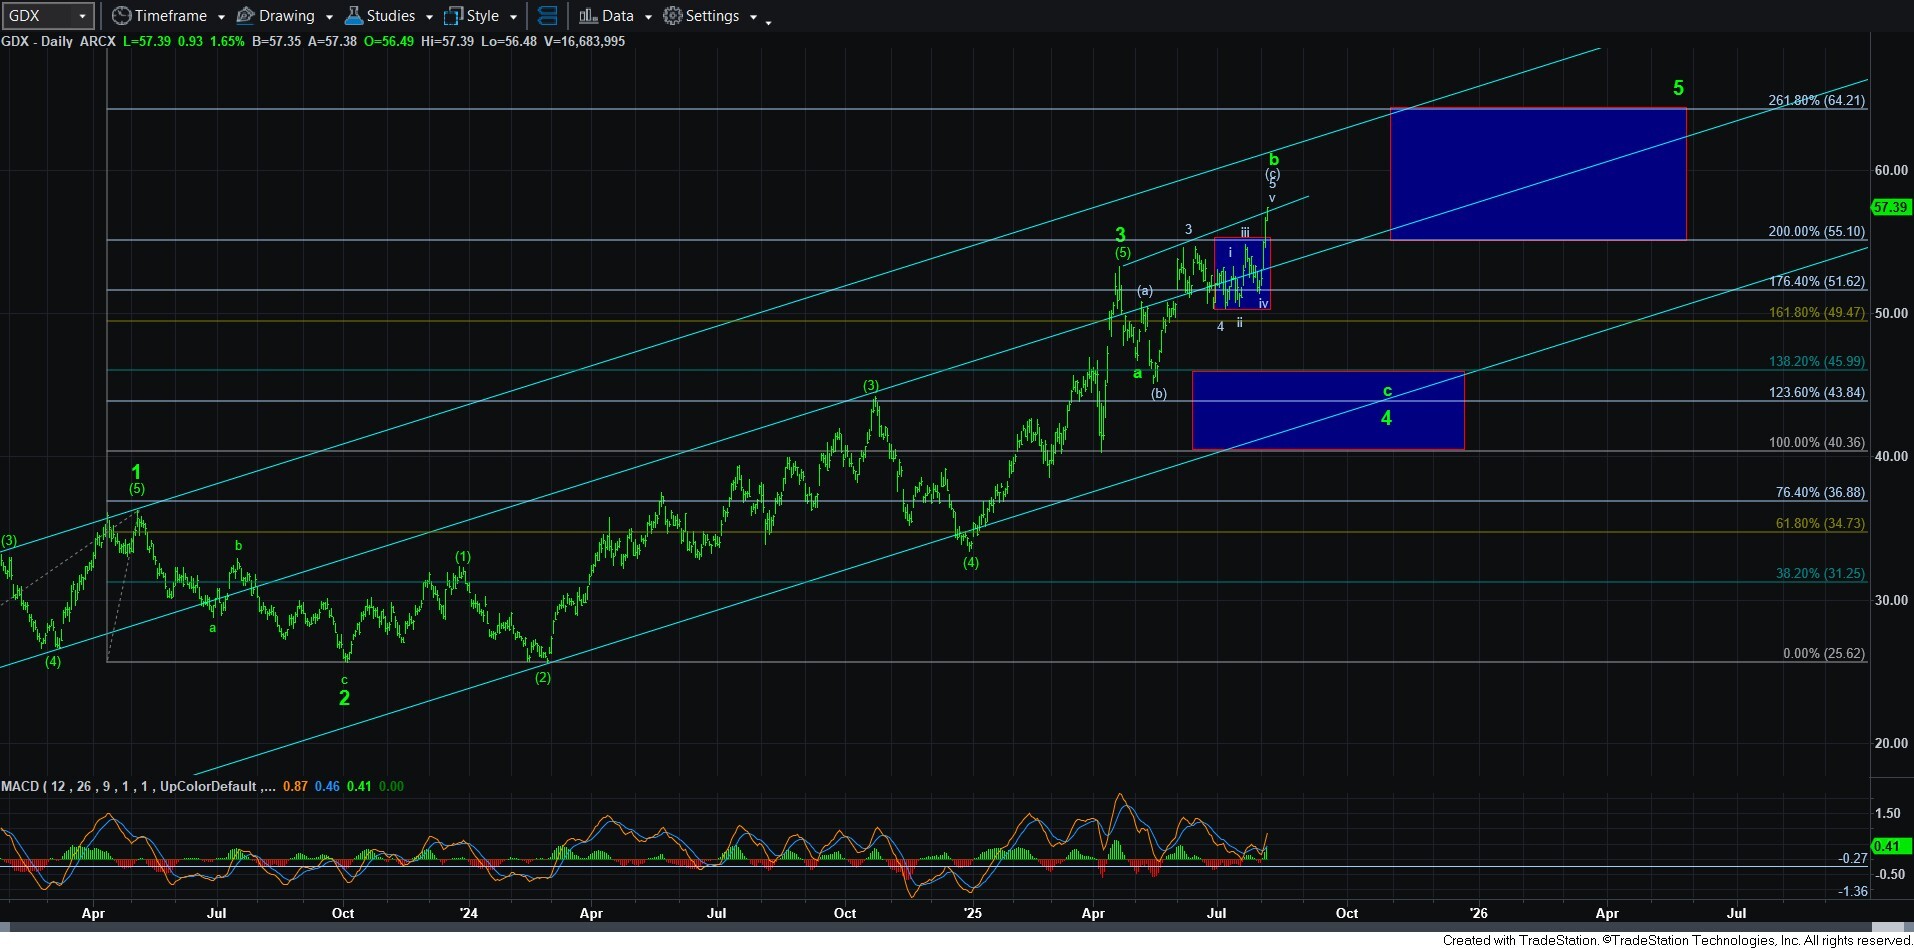
With the GDX moving beyond my prior expectation, the question that is on everyone minds is what this means to the overall chart? And, the basic answer is “not very much.”
You see, either this rally is an expanded b-wave, or it is simply a continuation of the 3rd wave. In both cases, we likely still see a sizeable decline before the 5th wave rally takes hold. The main reason I am assuming that the 5th wave has not begun is because we have seen no consolidation that would be deep enough or large enough to be considered the wave 4. Therefore, the most reasonable assumption is that this is either an expanded b-wave within wave 4, or wave 3 is simply extending. So, at the end of the day, I am still maintaining an expectation for a larger pullback to still be seen before we are ready for the 5th wave in the pattern for GDX.
If the next break down below the 55 region is corrective in nature, then I have to assume this was an extension to wave 3, and that we are starting an a-wave to the larger degree 4th wave. But, if that break down is clearly impulsive, then I am going to assume we are in the c-wave of that 4th wave, with this topping out in an expanded b-wave within that 4th wave.
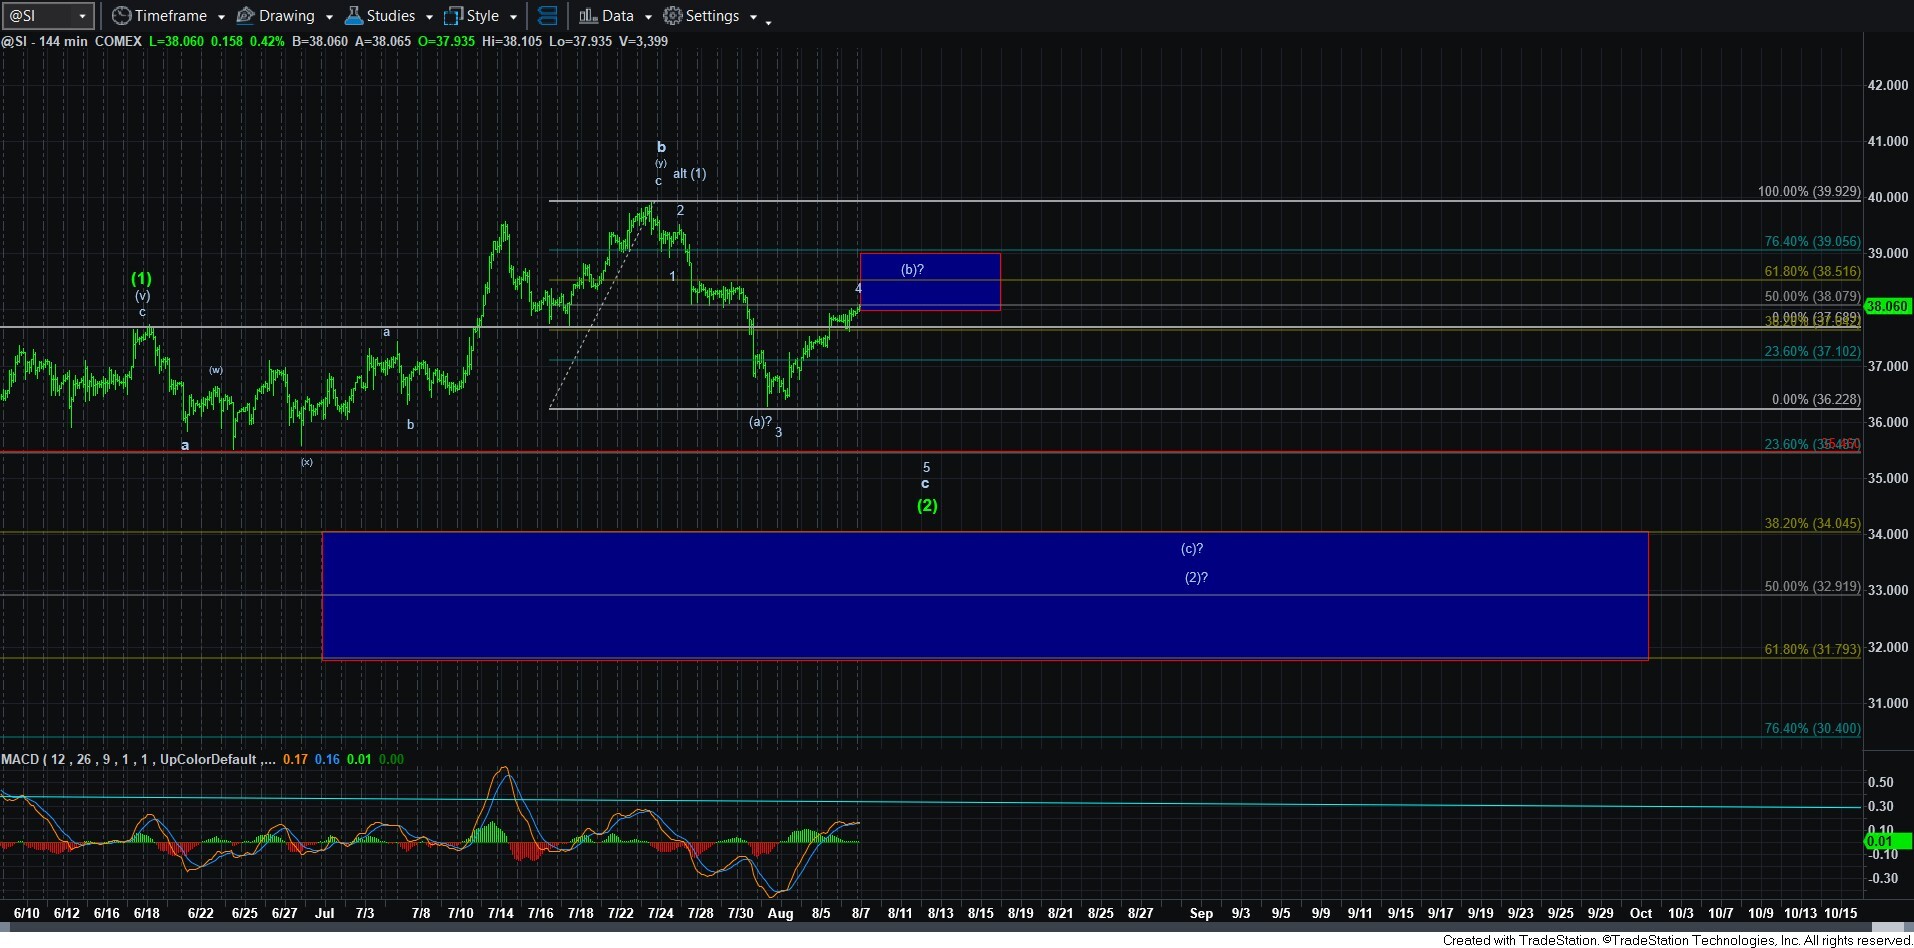
As far as silver is concerned, the rally thus far is getting a bit too high for this to be a 4th wave. While it is still within the realm of possibilities, the probability of this still being a 4th wave is getting a bit stretched. Therefore, I am starting to consider that this I actually a [b] wave rally within a larger correction. And, you can see the resistance region for that [b] wave on the 144-minute chart.
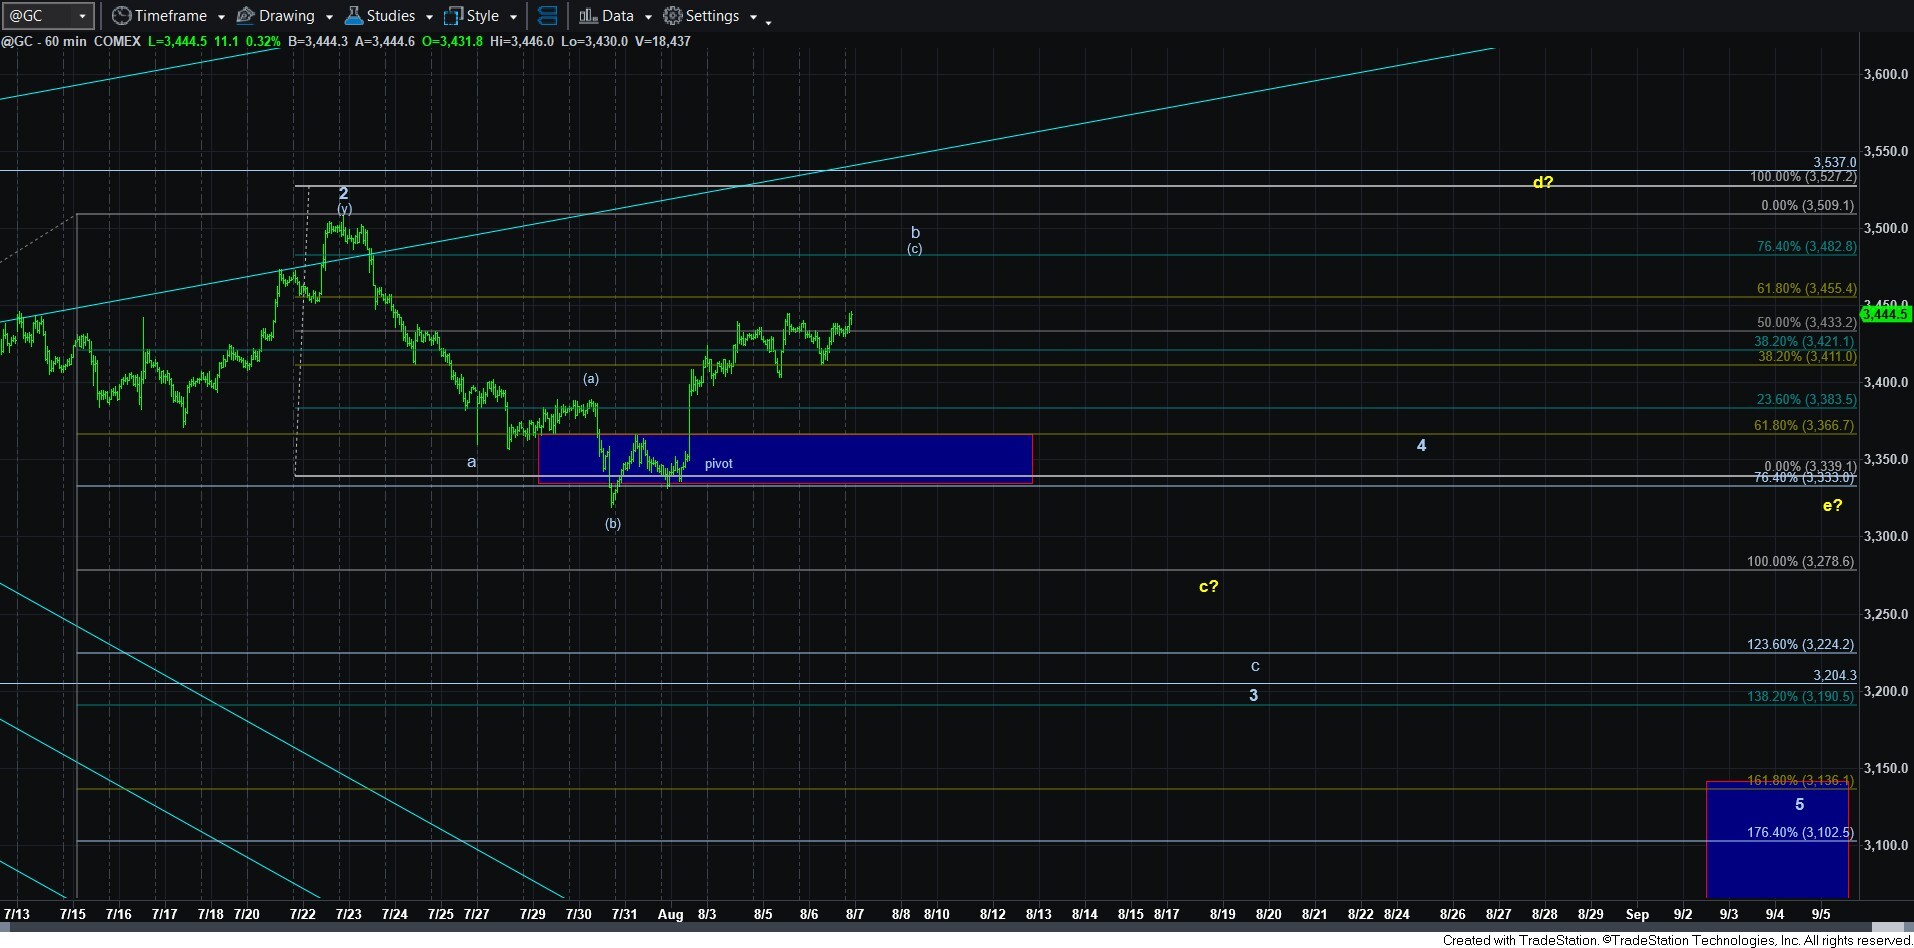
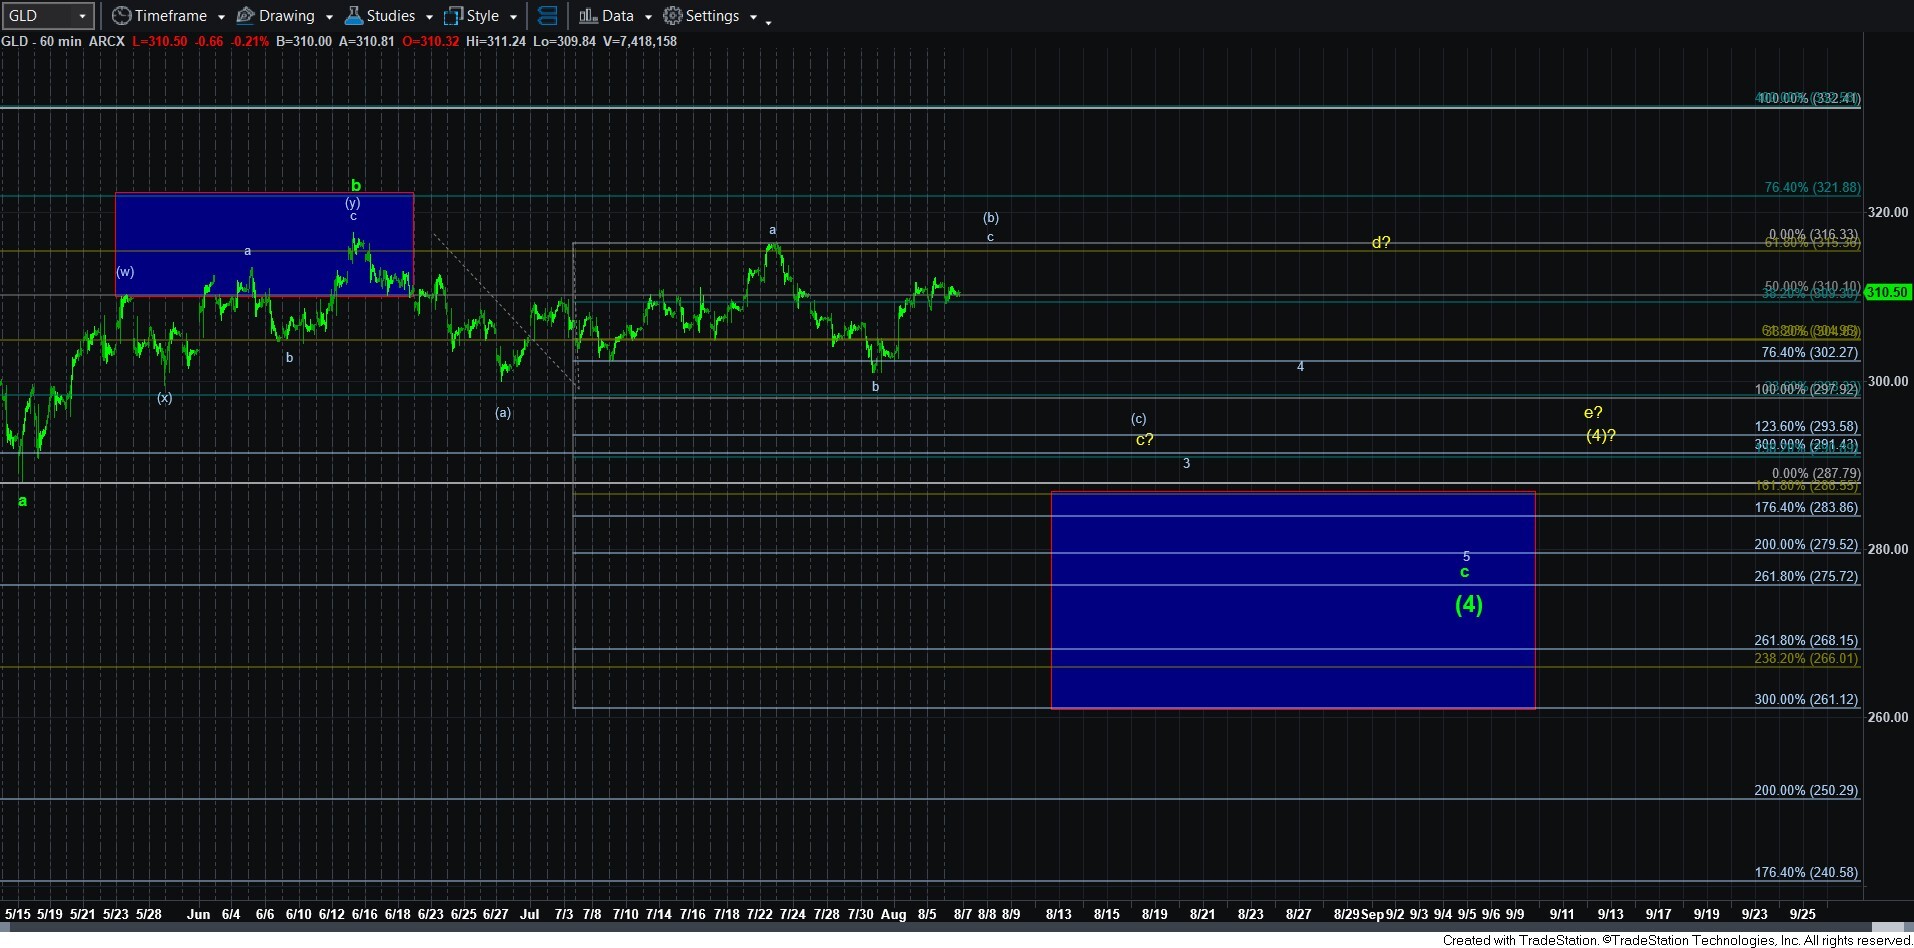
This now leads me to gold. And, I am starting to lean towards this correction taking shape as a triangle. One of the things we know about triangles is that at least one of the waves in a triangle is usually quite complex, and it occurs most frequently in the c or d waves within that triangle. With the a and b waves of the triangle already in place, I am assuming that this c-wave is the complex wave. And, within this c-wave, I am viewing us as completing a [b] wave within that c-wave.
If you notice that the wave count is slightly different on the GC chart as compared to the GLD chart, the reason is because I am still leaving the ending diagonal path open on the GC chart, and it represents a potential b-wave rally within wave 3 in that diagonal, whereas the GLD chart represents the [b] wave within the c-wave of the triangle. Yes, I know that this is a very complex structure, but that is why I am leaning towards the triangle a bit more. But, both structures “should” provide us with an impulsive c-wave decline next.
The one thing that I think the 3 counts have in common now is that they are finally aligning for a leg lower, at least based upon the manner in which I am currently counting them. And, the other thing that they have in common is that it is not likely that this bull market is coming to a conclusion until we see that bigger pullback take shape, which will likely then set up the final rally in the cycle. The last thing they have in common is that it is likely that there is going to be one more buying opportunity seen before the final rally takes shape in the cycle.