
Market Analysis for Nov 11th, 2026
 By
SPY Wave & Volatility Model E.O.D. Report
Risk Is Now Rising Again
November 11, 2026 | Decision: 1:31:52 PM Eastern
TODAY'S MODEL ACTION: CLOSE CORE LONG — MOVE TO CASH.
Exit the November 10 long at the current SPY model reference of $762.03. From the $748.37 entry, that records a gain of +$13.66 per share (+1.83%) before costs. The model is now Flat; no short or replacement long qualifies.
| Position summary | Today's model status |
|---|---|
| Position after action | Flat; Core long closed |
| Entry / holding age | November 10 at $748.37; closed after 1 trading session |
| Current reference / exit | $762.03; user-supplied current SPY reference |
| Closed result | +$13.66 per share (points); +1.83% before costs; realized model-reference result |
| Open result | No open position after the exit |
| Protective stop | Previous $729.66 stop retired after closing; no active stop |
| Next holding-period check | Not applicable while flat |
Why we are taking the profit
The rally anticipated yesterday has arrived. Avi now sees a possible completion area and favors a corrective pullback. He also urges profit protection and makes clear that a short trade still needs further evidence. Under the saved rules, that change in the preferred near-term direction closes the Core long.
The model takes the full exit rather than introducing a new partial-profit or trailing-stop rule. The larger green count remains possible, and prices could continue higher. Taking the model exit does not require proving a major top; it follows the current pullback expectation after the planned rally.
How the analysis guides the decision
Fresh EW evidence: Bullish 1/4 | Bearish 1/4. The bullish point recognizes the five-wave advance described in the update. The bearish point reflects the preferred imminent pullback. No five-wave decline, broken support or confirmed rejection from resistance is assumed.
The completed or nearly completed rally is different from a fresh preferred rally call. Today’s update replaces yesterday’s near-term bullish direction for the decision. A bearish point can close an existing long, but it is not enough to qualify a new Core short. The scores record evidence; they are not forecasts of a trade’s probability of success.
Daily and weekend perspective
The weekend analysis emphasized larger bearish risk while preserving the green bullish alternative. The following updates identified the corrective rebound, and yesterday’s report favored another upward leg. That leg has now carried the market toward a possible completion area and the resistance zones.
If this is the end of an initial upward leg, the next pullback could be corrective and later set up another rally. A clear impulsive decline would instead strengthen the case that the larger red rebound has finished. The green count has not been invalidated, so the exit is a decision to protect the model trade rather than a declaration that the long-term bearish scenario is confirmed.
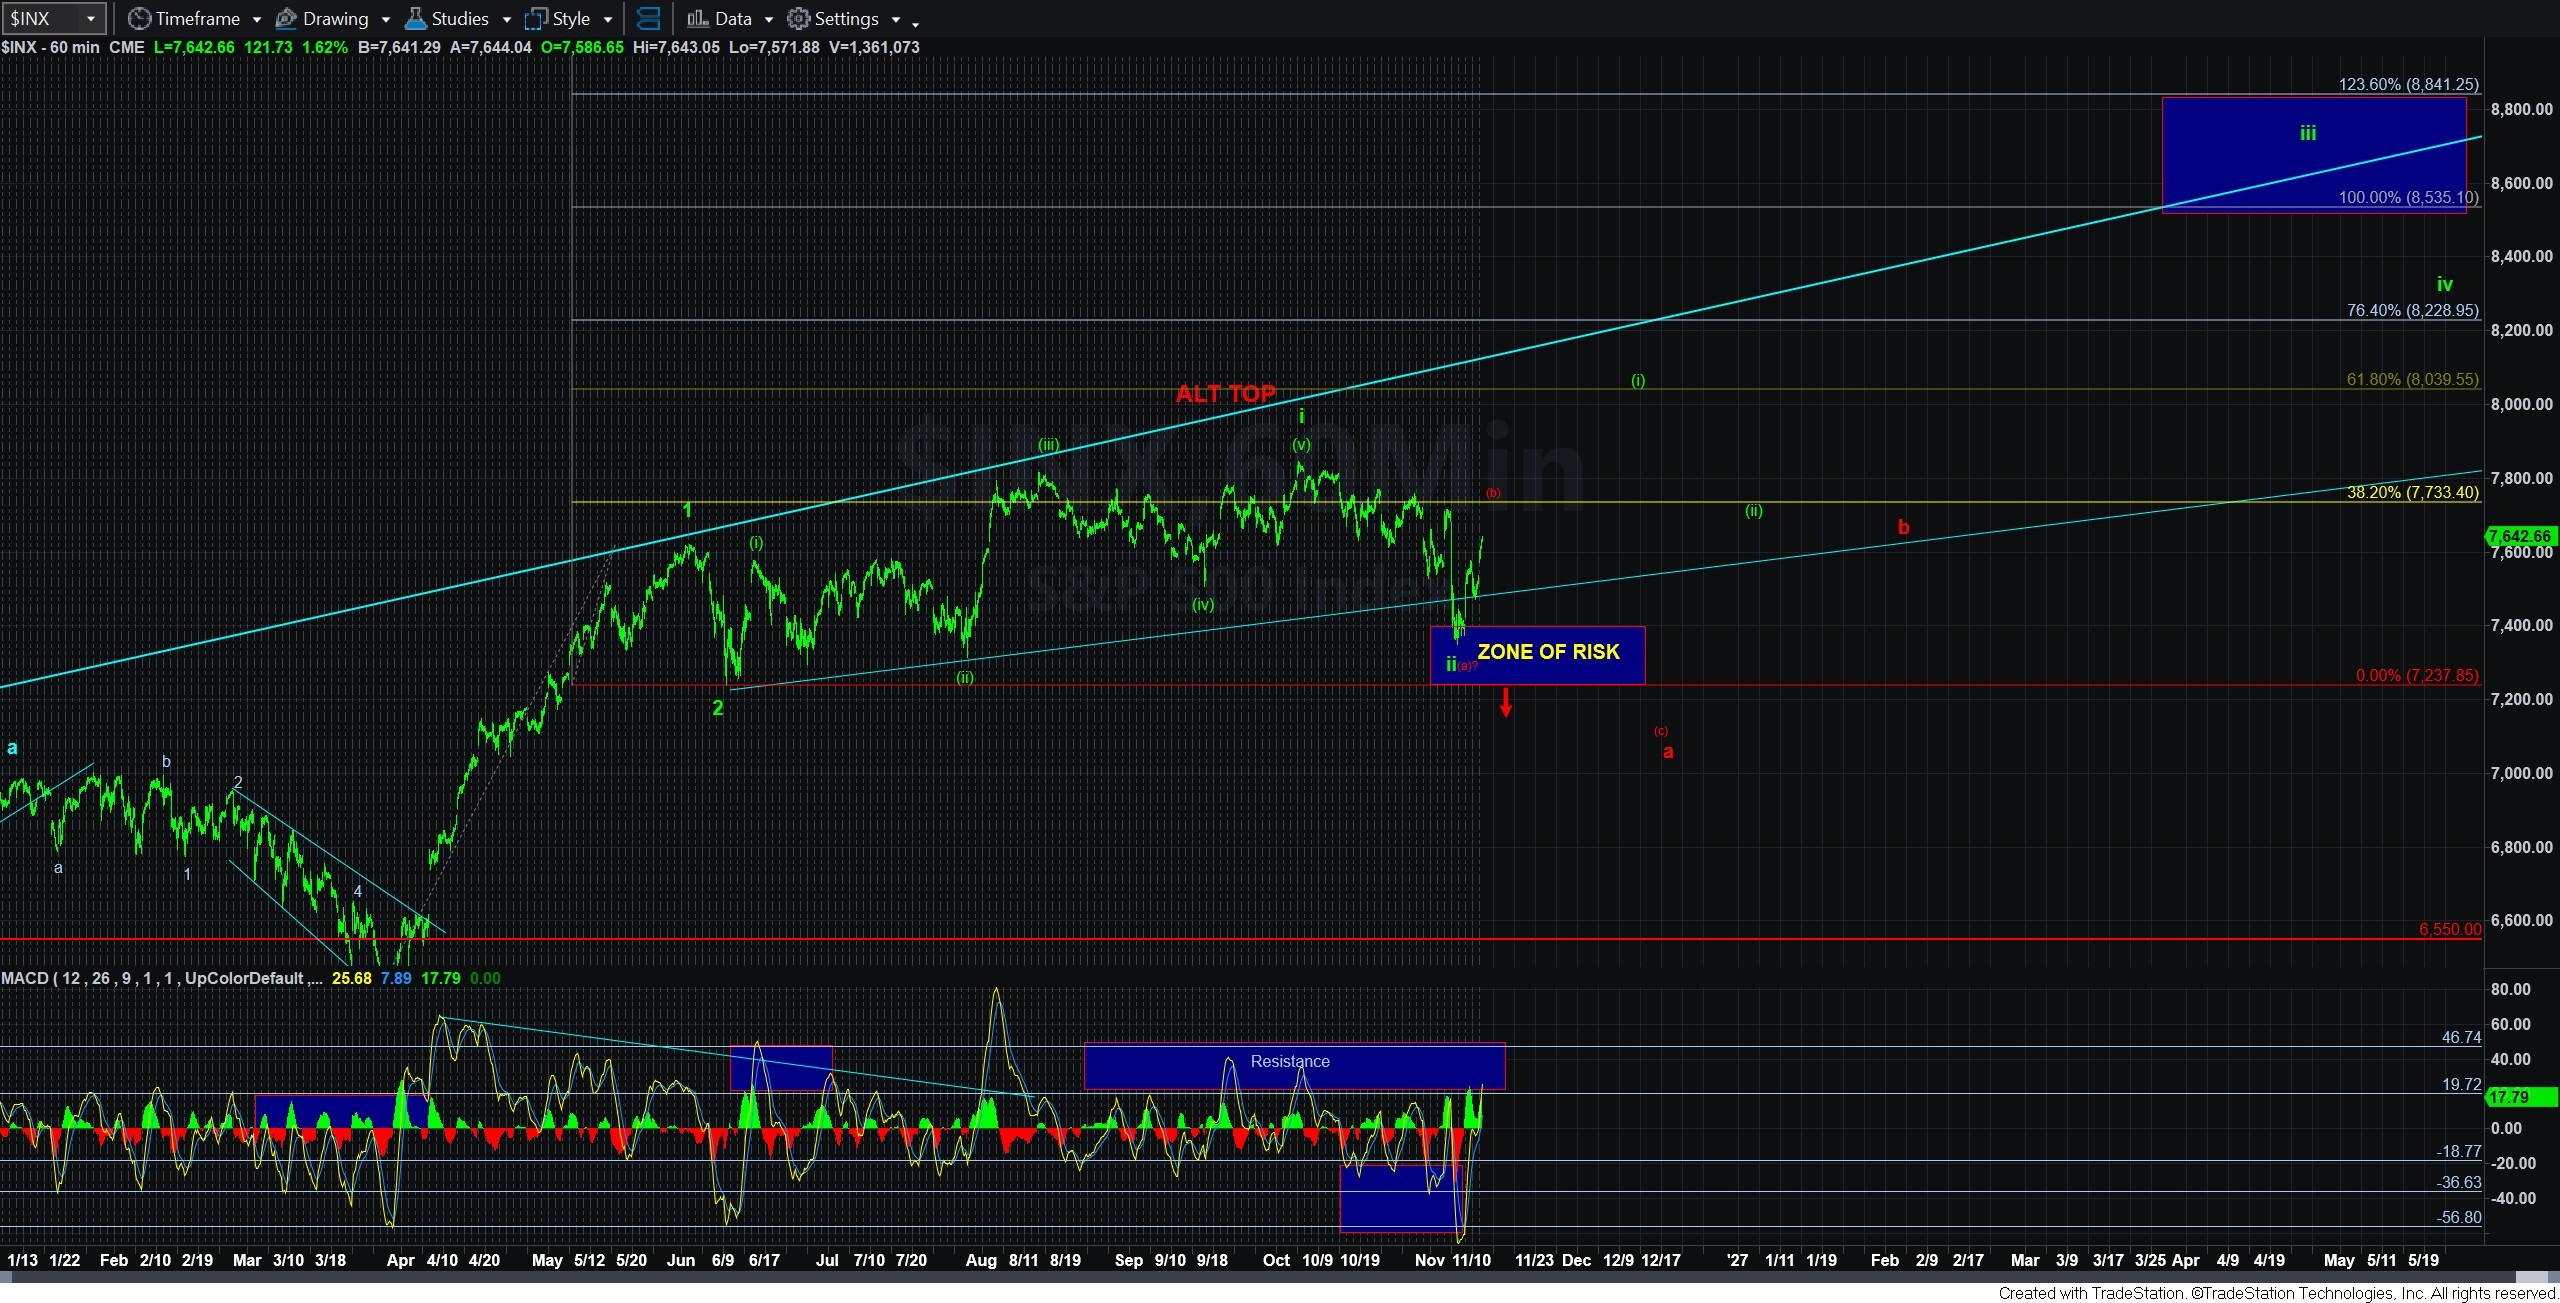
Avi | November 11, 2026 | SPX cash index, 60-minute. Original update snapshot. View original chart.
Levels that matter now
| Instrument / reference | What it means |
|---|---|
| ES: 7,665 | The approximate fifth-wave completion reference in Avi’s text. A push through it weakens the immediate fifth-wave-top interpretation and favors a more direct advance within the larger corrective rally. |
| ES: approximately 7,681–7,765 | The overhead resistance region on the current futures chart. Its lower boundary is near the 61.8% retracement of the previous decline. Further upside into this region can still complete the red rebound. |
| SPX: approximately 7,650–7,727 | The updated cash-index resistance box. It is narrower than the box in yesterday’s report. It is an area to assess completion risk, not an automatic short-entry signal. |
| A clear five-wave decline | The structural evidence Avi wants before considering a short. That evidence is not established in today’s update. |
| SPX: 7,237 — larger context | The previously identified dividing line for the larger green count. Its survival does not cancel a near-term profit-taking decision. |
The latest independently retrieved ES reading during this review was 7,668, with a session high of 7,668.25, just above 7,665. That supports the possibility of further direct upside. Avi explicitly warns that risk remains elevated even on that route, so a small break above the reference does not by itself provide a new model buy. The futures provider did not supply an exact quote timestamp.
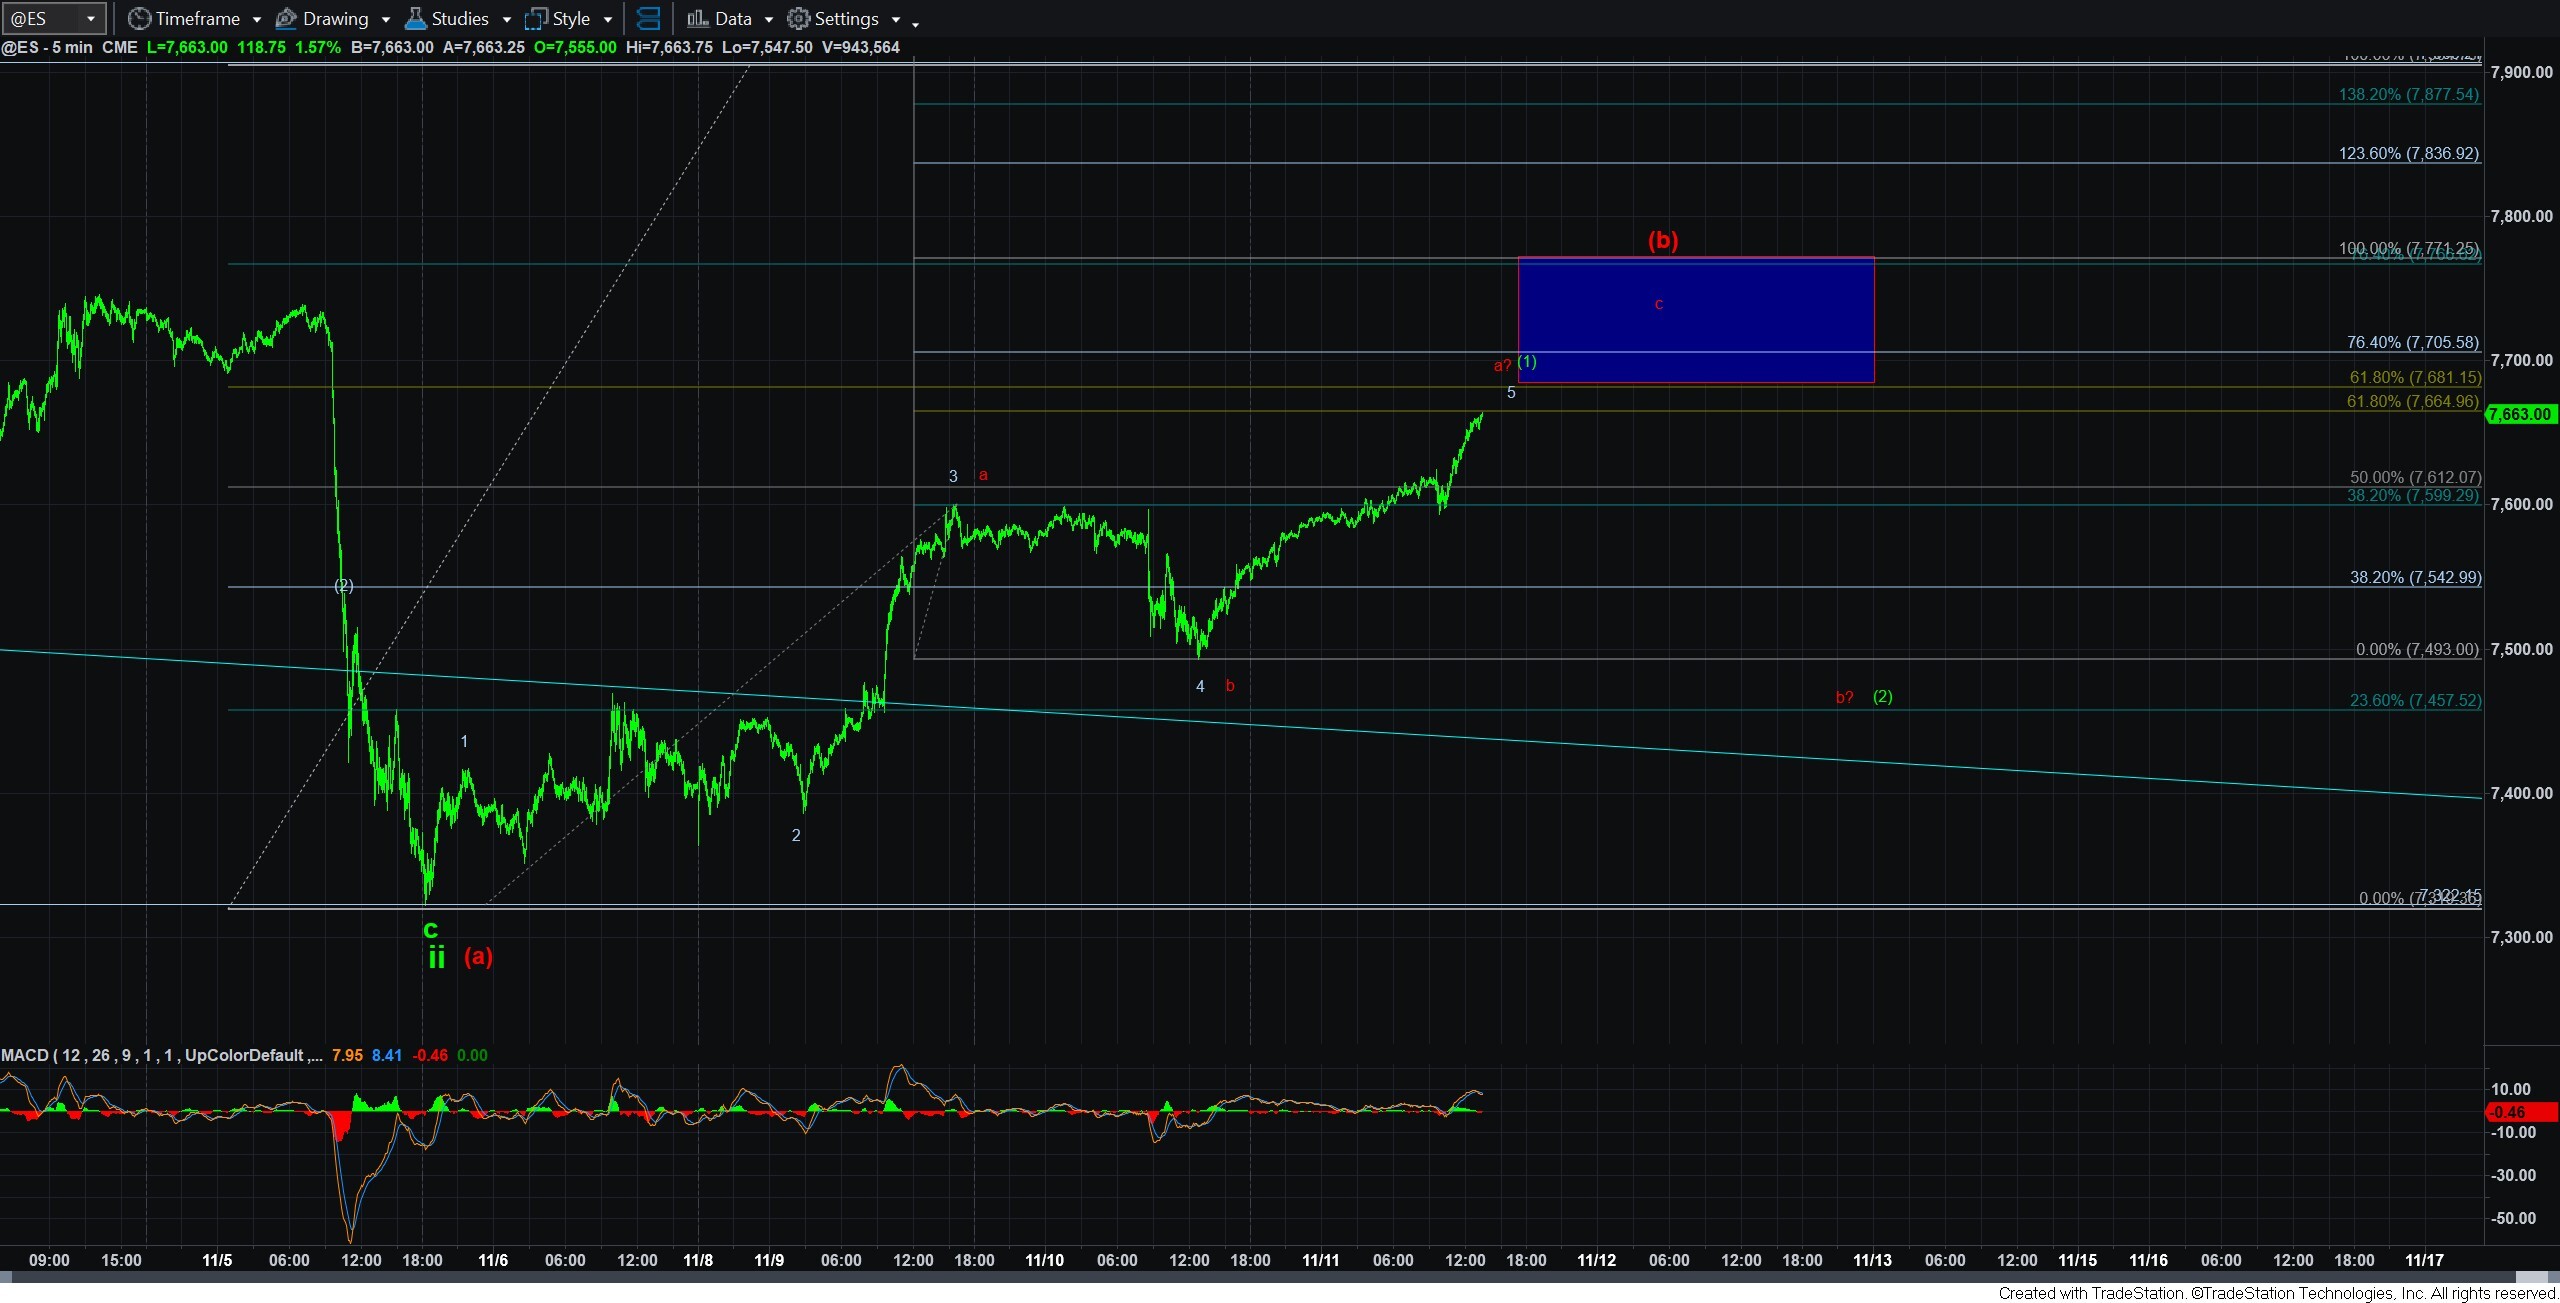
Avi | November 11, 2026 | ES futures, 5-minute. Original update snapshot. View original chart.
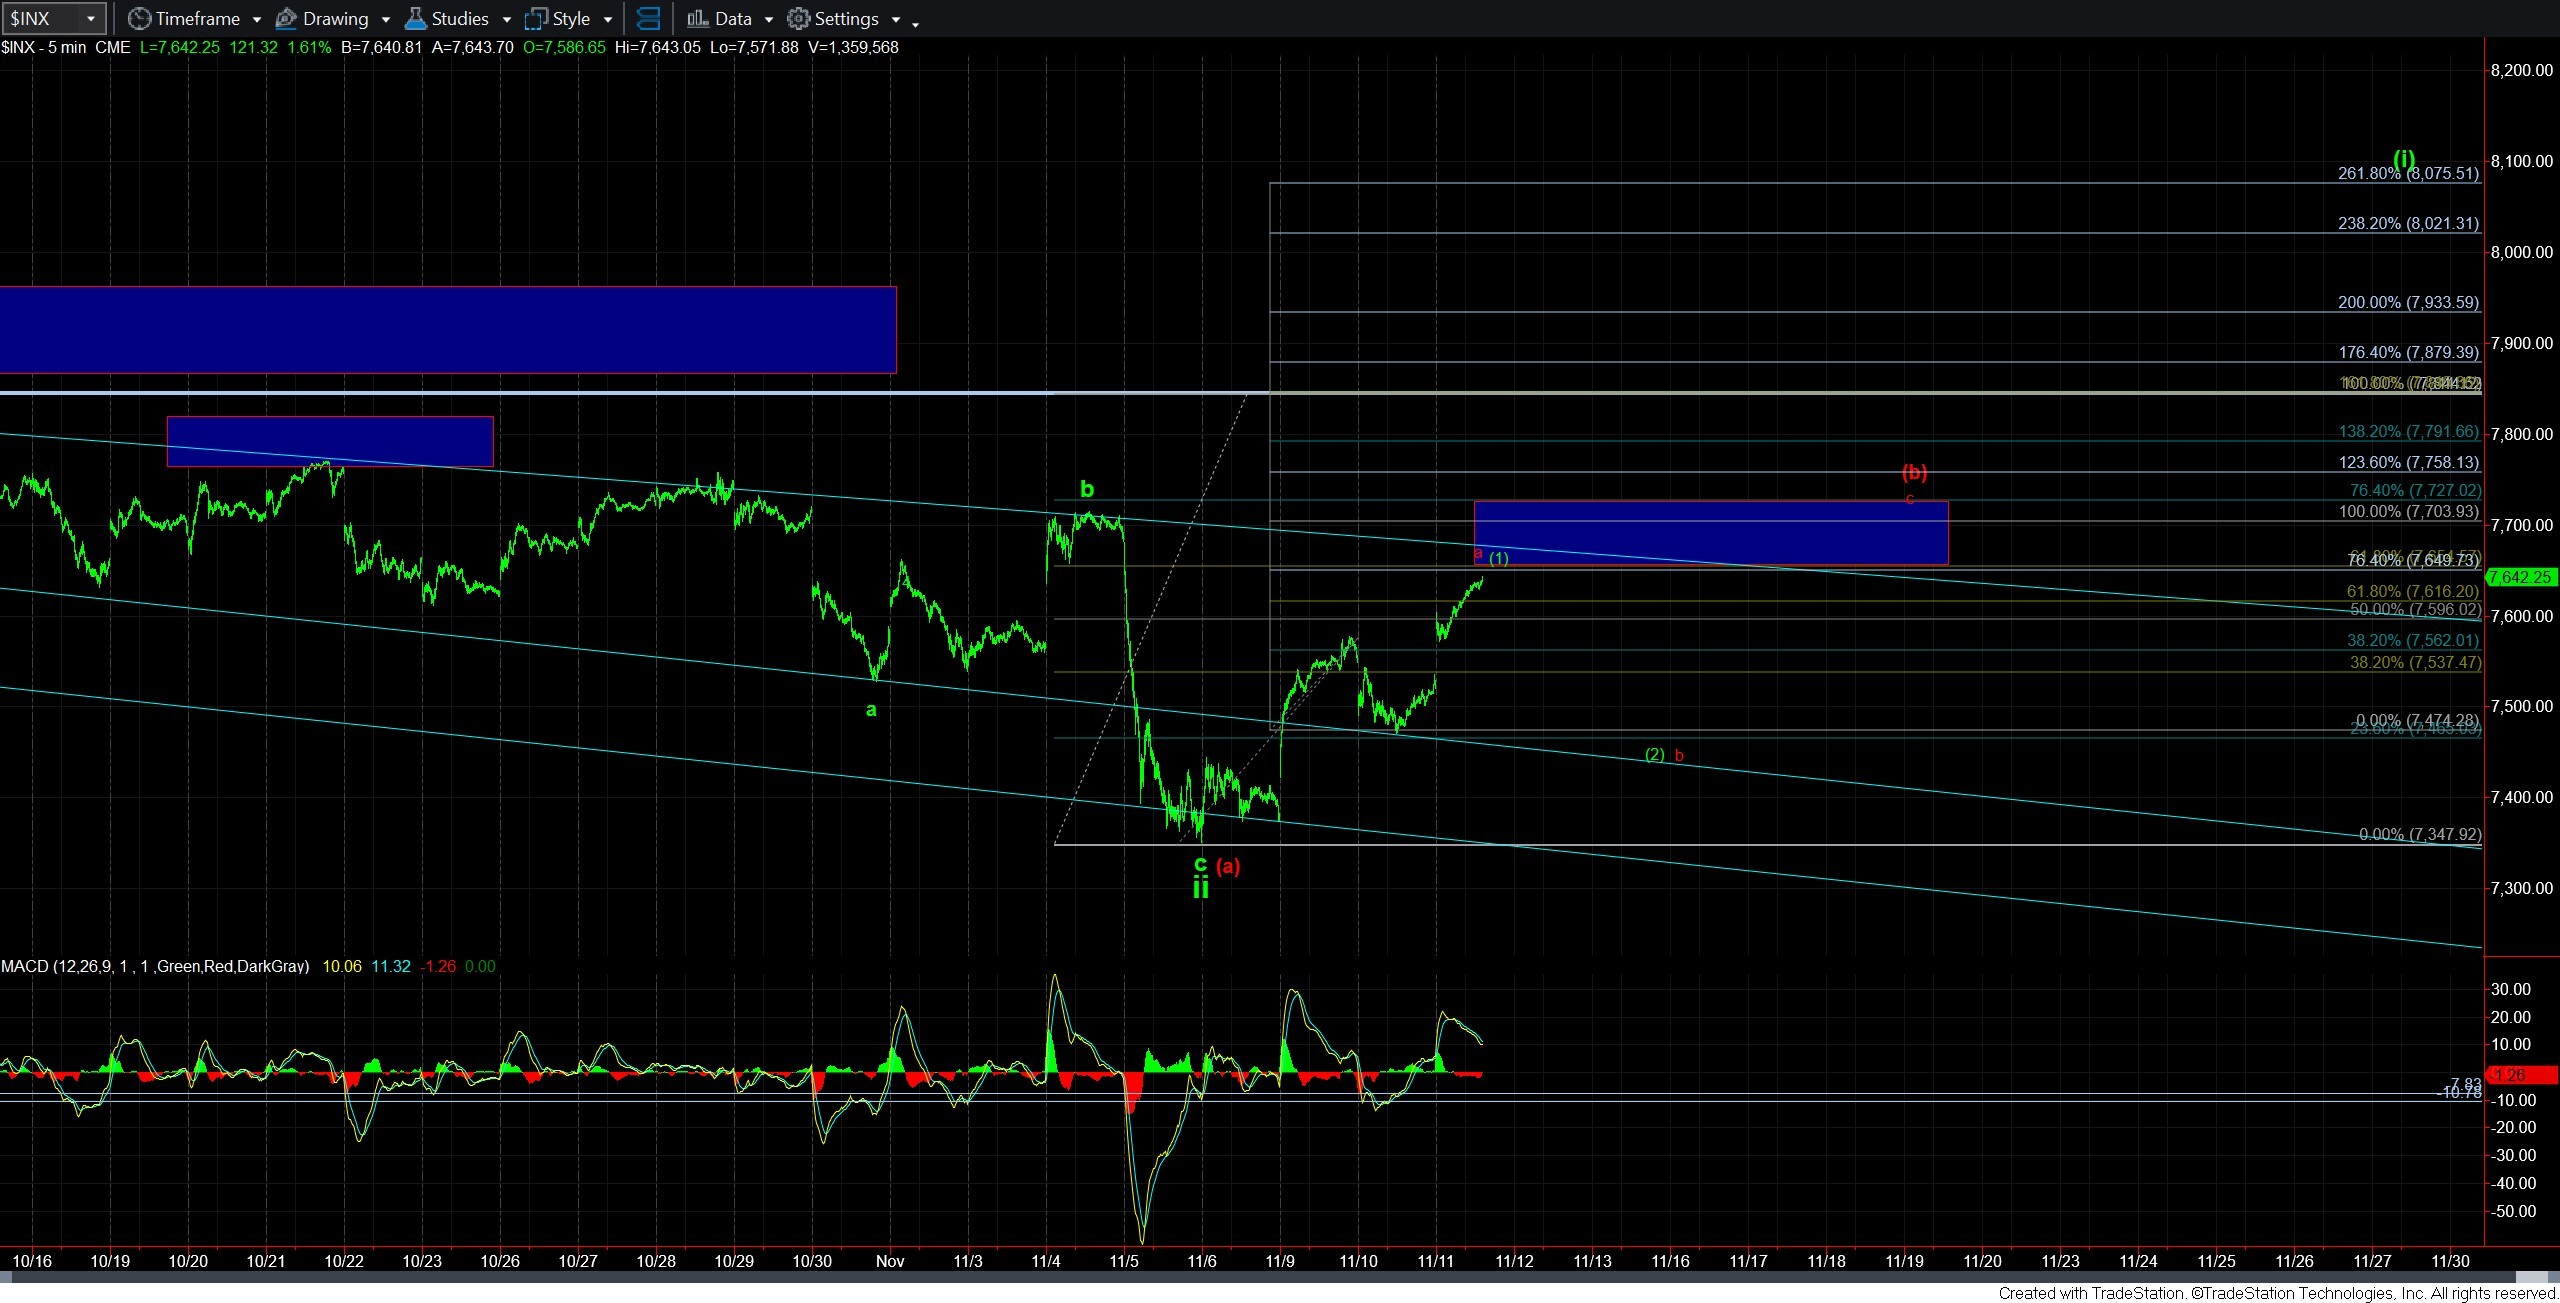
Avi | November 11, 2026 | SPX cash index, 5-minute. Original update snapshot. View original chart.
Why no new trade qualifies
The model needs more evidence to switch from taking a profit to opening a short. Today’s preferred pullback supplies an exit signal, but there is no confirmed downward impulse or support failure to strengthen the short-entry case. A fresh long also does not qualify because the preferred next move is a pullback.
The supplemental checks do not provide a replacement trade either. The model can stay in cash while the market shows whether the next decline is a temporary correction or the start of a larger move lower.
Current technical readings
SPY has recovered above its short-term and longer-term averages, but remains below its medium-term average. Momentum has improved while remaining negative. The moving averages have not yet aligned for a supplemental long, and the current short-entry filters also fail.
The Volatility indicator is 92.46, around the 37th percentile of trailing-year readings, compared with Tuesday’s 96.63 close. SPX is 7,636.90 at 1:15:35 PM Eastern. Calculations use completed history through November 10 plus current intraday readings.
The lower Volatility indicator reading makes the hold-exception review eligible, but it does not automatically protect a long from an exit. Today’s pullback preference remains operative, and neither the weekend outlook nor the modest break above 7,665 gives an unambiguous reason to disregard it. The normal exit therefore remains in place.
Supplemental status: With Core moving to cash, the supplemental short is evaluated for a new eligible episode. Its trend and price-range conditions are present, but the volume and Volatility indicator momentum requirements are not met, so the entry is rejected. The supplemental long lacks the required upward trend alignment. No supplemental position is opened; a rejected episode cannot be entered later solely because its filters improve.
What we will watch next
A corrective decline that holds support could produce another qualifying bullish update. A clear five-wave decline and subsequent downside confirmation could strengthen the short case. Continued upside through the ES completion reference would favor the more direct rally alternative, but a new trade must still satisfy the model’s entry rules.
The prior stop is no longer active after the exit. Future entries retain the 2.5% maximum-stop policy, including any tighter stop required by the applicable setup. No historical results or entry rules have changed.
Sources and reference times
November 11 — Risk Is Now Rising Again | November 10 — Pullback Leading To Higher? | November 7 weekend — Have Bulls Lost Control Of This Market?
Eastern Standard Time: daily update published November 11 at 1:25:30 PM, revision 1; original model decision 1:31:52 PM. Exit reference revised to $762.03 at the user’s direction; exact quote timestamp and feed delay were not supplied. The original technical snapshot remains unchanged: SPY 1:13:17 PM; SPX 1:15:35 PM; Volatility indicator 1:15:31 PM, from approximately 15-minute delayed feeds. This is a price-reference correction, not a new trade or a fresh indicator calculation. The exit is a model reference, not a verified brokerage execution. Charts retain their original snapshots.
The trade return above is calculated from the saved $748.37 entry and this report’s exit reference. It is not copied from the approximate performance figure mentioned in the source update. The November 4 corrected high of $769.23 remains preserved.
Please note: Investing contains substantial risk of loss and is not suitable for every investor. You could potentially lose all or more than your initial investment amount. Hypothetical performance results are no guarantee of future results and do not include trading commissions and other execution costs. EWT is not a broker-dealer or investment advisor, does not owe a fiduciary duty to you, and is not providing you with customized or personal advice that takes into account your specific circumstances. Content provided by our analysts on our site and outside of our site does not constitute investment advice or recommendations and is offered for information purposes only. Any of your actions or forbearance from taking action based on our content or the use of our services is entirely at your own risk. View our terms.
