
Market Analysis for Nov 10th, 2026
 By
SPY Wave & Volatility Model E.O.D. Report
Pullback Leading To Higher?
November 10, 2026 | Decision: 2:59:18 PM Eastern
TODAY'S MODEL ACTION: CLOSE CORE SHORT AND BUY CORE LONG.
Use the current SPY reference of $748.37 for both model transactions. The November 3 short closes with a gain of +$7.89 per share (+1.04%) before costs. The new Core long starts at $748.37, with a $729.66 protective stop, 2.50% below entry. This replaces the short; it does not add a second position.
| Position summary | Today's model status |
|---|---|
| Entry / holding age | Core long from November 10 at $748.37; age 0 trading sessions |
| Current reference | $748.37 at 2:41:00 PM Eastern; approximately 15-minute feed delay |
| Open result | +$0.00 per share (points); +0.00% before costs; unrealized |
| Protective stop | $729.66; 2.50% below the new entry |
| Next holding-period check | At age 10, exit if flat or losing versus entry. A profitable long may remain until age 30; normal exits can occur sooner. No fixed Core-long profit target. |
Why the model is changing direction
Yesterday’s preferred next move was a pullback. That pullback has now developed, and Avi describes it as corrective rather than a convincing start to a larger decline. His current expectation is another rally while the ES support region holds. The saved model treats an explicitly preferred near-term rally as a Core-long call, including when that rally is part of a larger bearish correction.
The qualifying opposite call closes the existing short and opens the long. This does not mean the larger bearish outlook has disappeared or that a lasting bottom is confirmed. It means the model is following the rally now favored in the update. Both transactions are recorded at the report reference price, without waiting for the closing bell.
How the analysis guides the decision
Fresh EW evidence: Bullish 1/4 | Bearish 0/4. The bullish point reflects the maintained expectation for another rally. A completed five-wave advance, fresh resistance breakout and confirmed end to the pullback are not assumed. A future impulsive break of support is a risk condition, not an event already established by the update.
The larger red count still points to eventual downside, but the immediate preferred move is higher. A one-point bullish score is sufficient here because the saved Core-long entry rule uses an eligible bullish call; it does not require a minimum two- or three-point score. The scores describe evidence, not win probabilities.
Daily and weekend perspective
The November 7 weekend report warned about the mature bull market and outlined bearish paths while leaving the green count possible. Monday’s resistance break removed the more direct breakdown path. Today’s corrective pullback keeps Avi focused on another upward leg within the larger rebound.
That rally can fit either the red corrective-bounce count or the green bullish alternative. Avi still expects the red count to become the more likely larger outcome, but he is keeping both paths open because 7,237 SPX has not broken. The shape of the next rally and its reaction at resistance should help distinguish them.
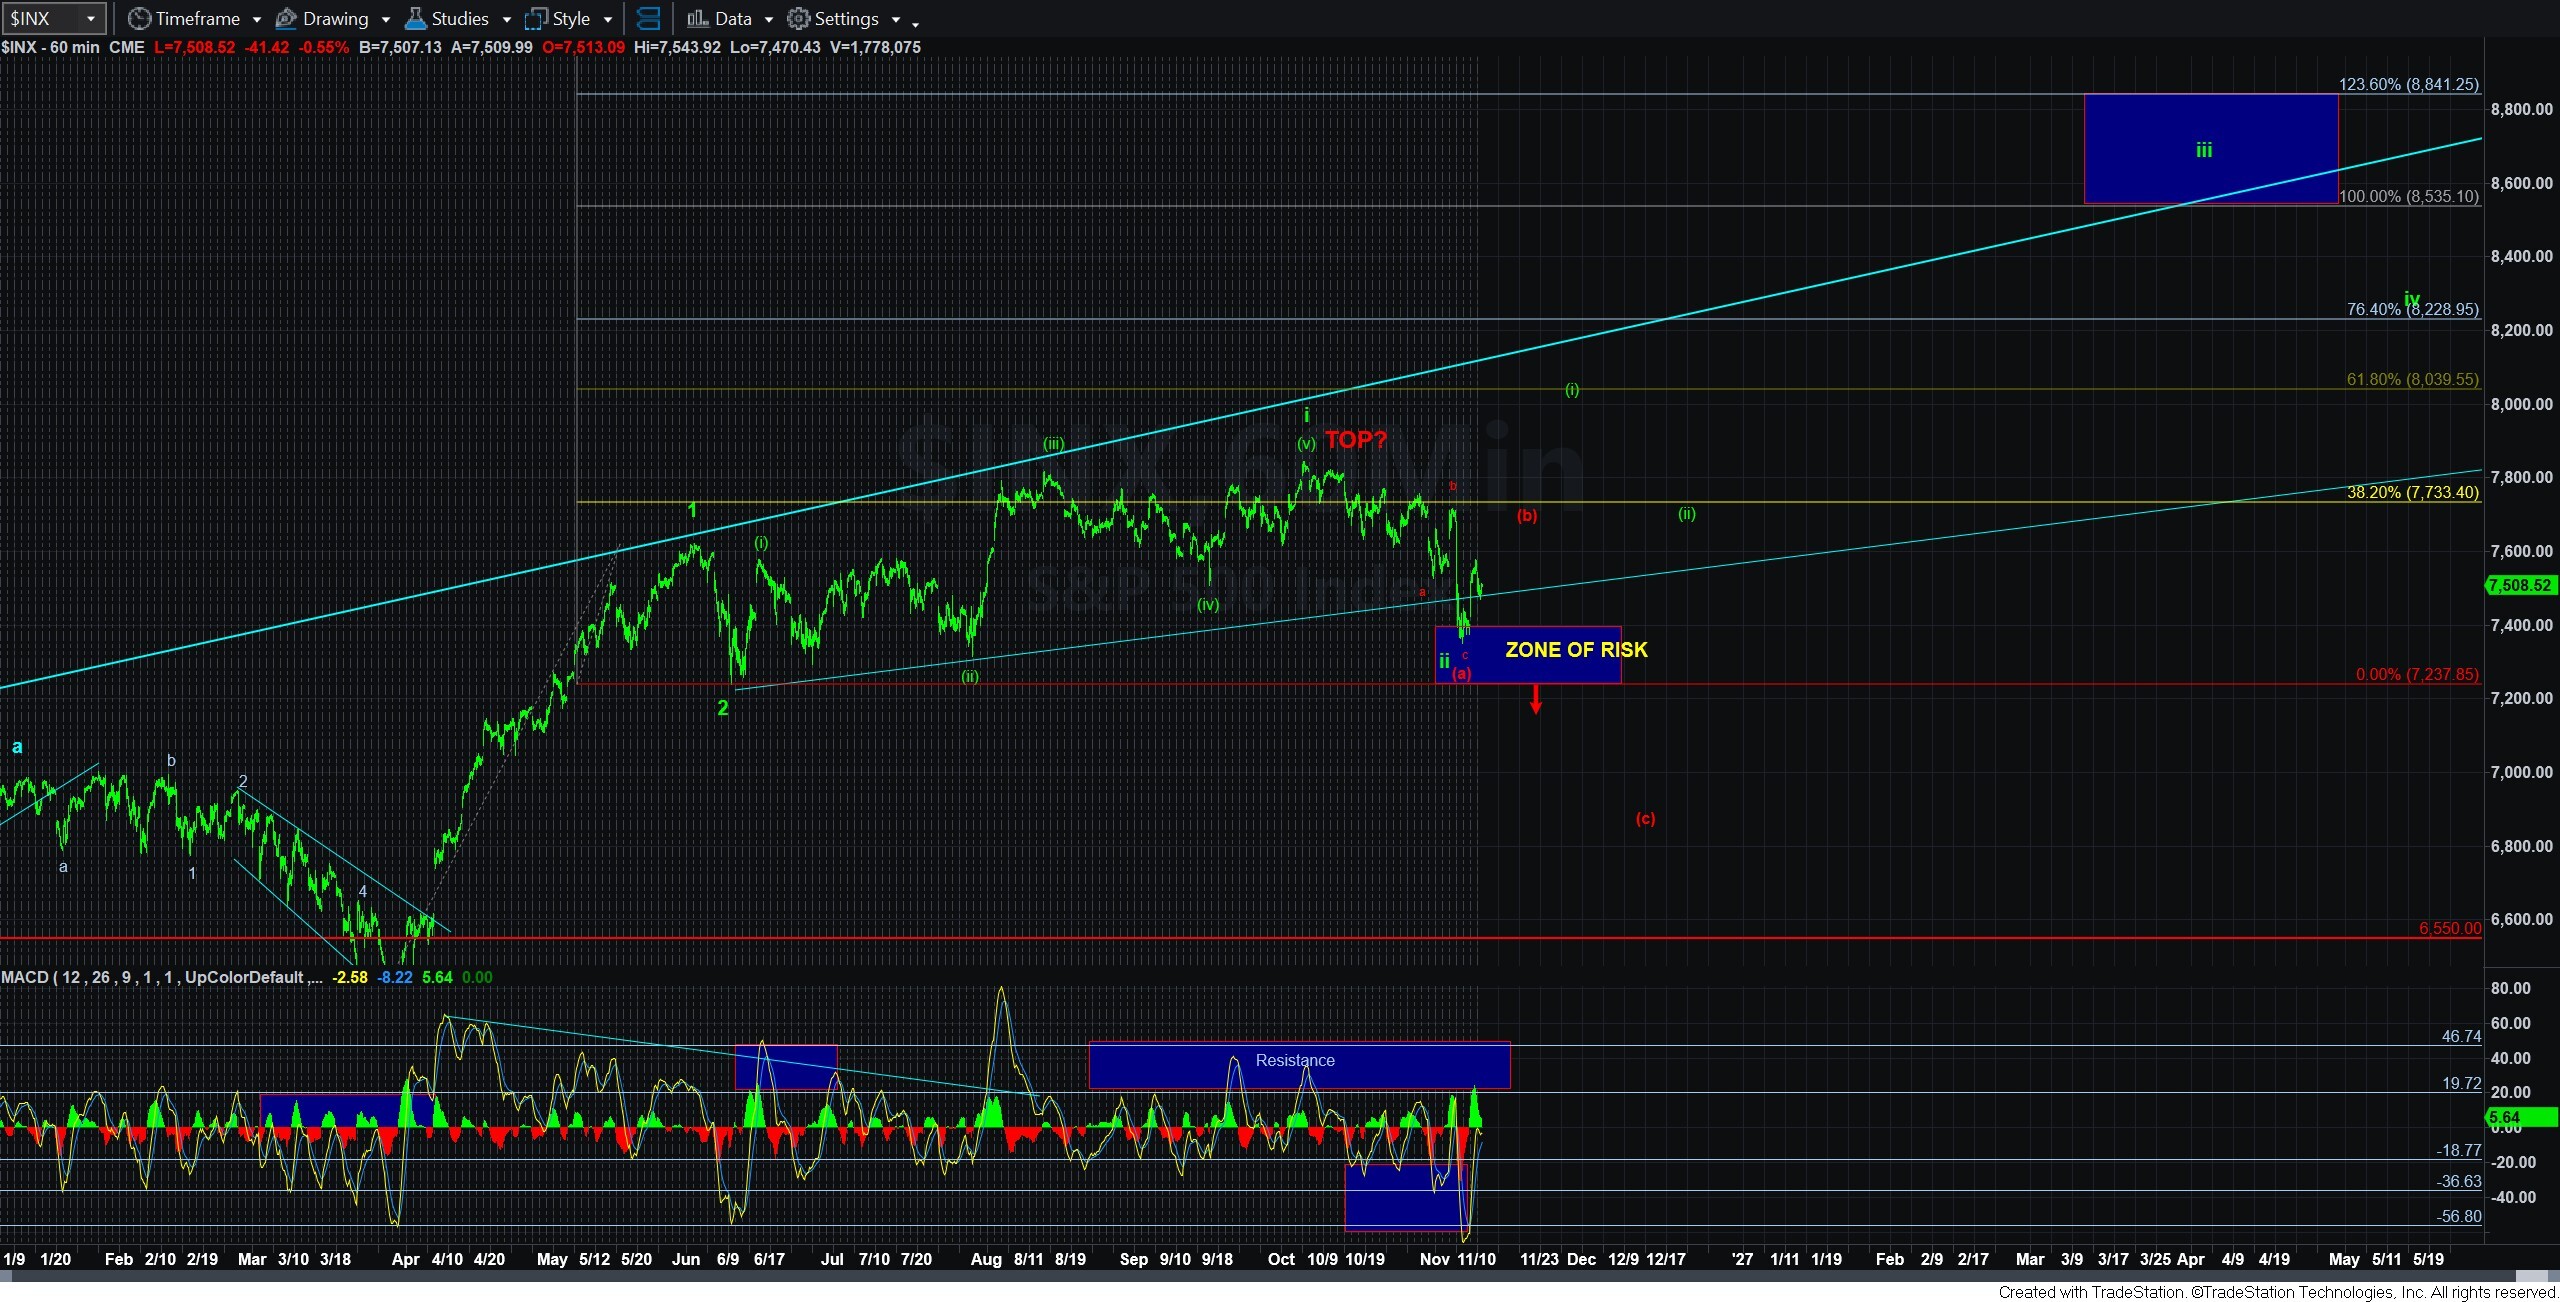
Avi | November 10, 2026 | SPX cash index, 60-minute. Original update snapshot. View original chart.
Levels that matter now
| Instrument / reference | What it means |
|---|---|
| ES: approximately 7,390–7,464 | The pullback support region bracketed by nearby retracement levels on the 5-minute futures chart. The internal 61.8% reference is approximately 7,431. Holding the region with corrective action supports another rally; an impulsive loss would suggest the larger rebound may already be finished. |
| ES: approximately 7,497 | The shallower 38.2% retracement reference. The chart shows a session low of 7,493, so the pullback has already tested slightly below it while remaining above the deeper support region. |
| SPX: approximately 7,597–7,728 | The larger corrective-rally target/resistance box on the 5-minute cash chart. Approximately 7,656 is its internal 61.8% reference. A rally into this area would still fit the red bearish count. |
| SPX: 7,237 | The larger green count remains possible above this level. It is not the protective stop for the new SPY trade. |
Support and resistance levels above come from different instruments and must not be interchanged. Chart-derived ranges are approximate. A trade can encounter more pullback before the projected rally; neither the report nor the model confirms that the exact low is already in.
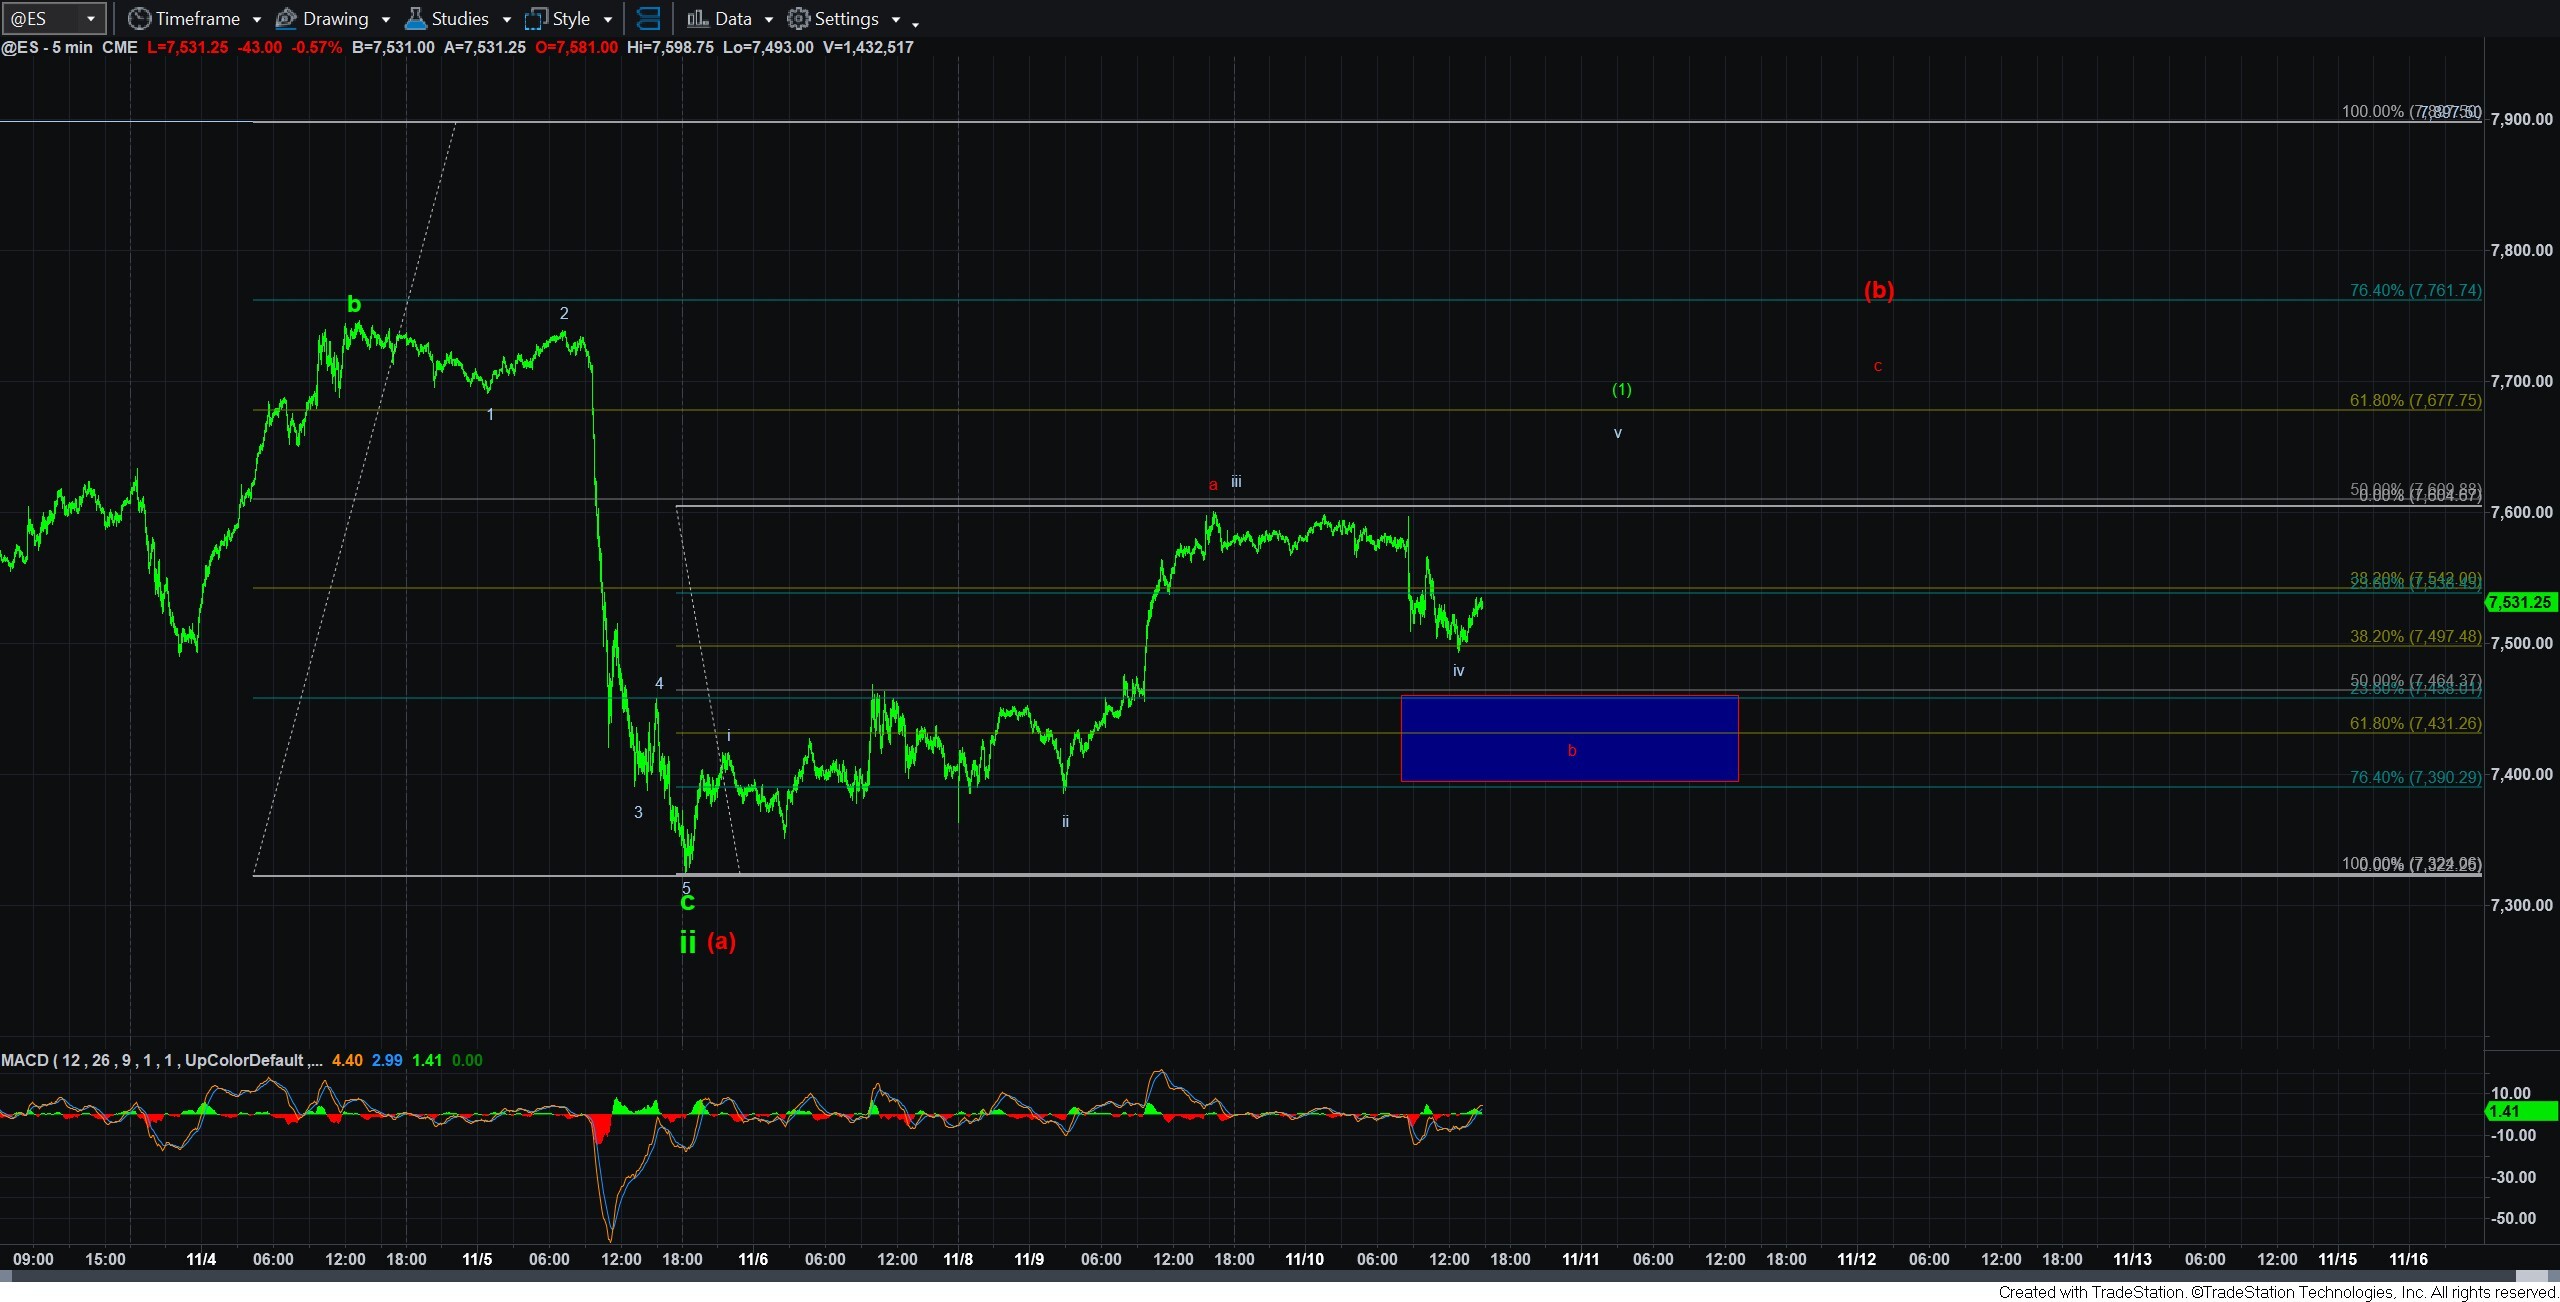
Avi | November 10, 2026 | ES futures, 5-minute. Original update snapshot. View original chart.
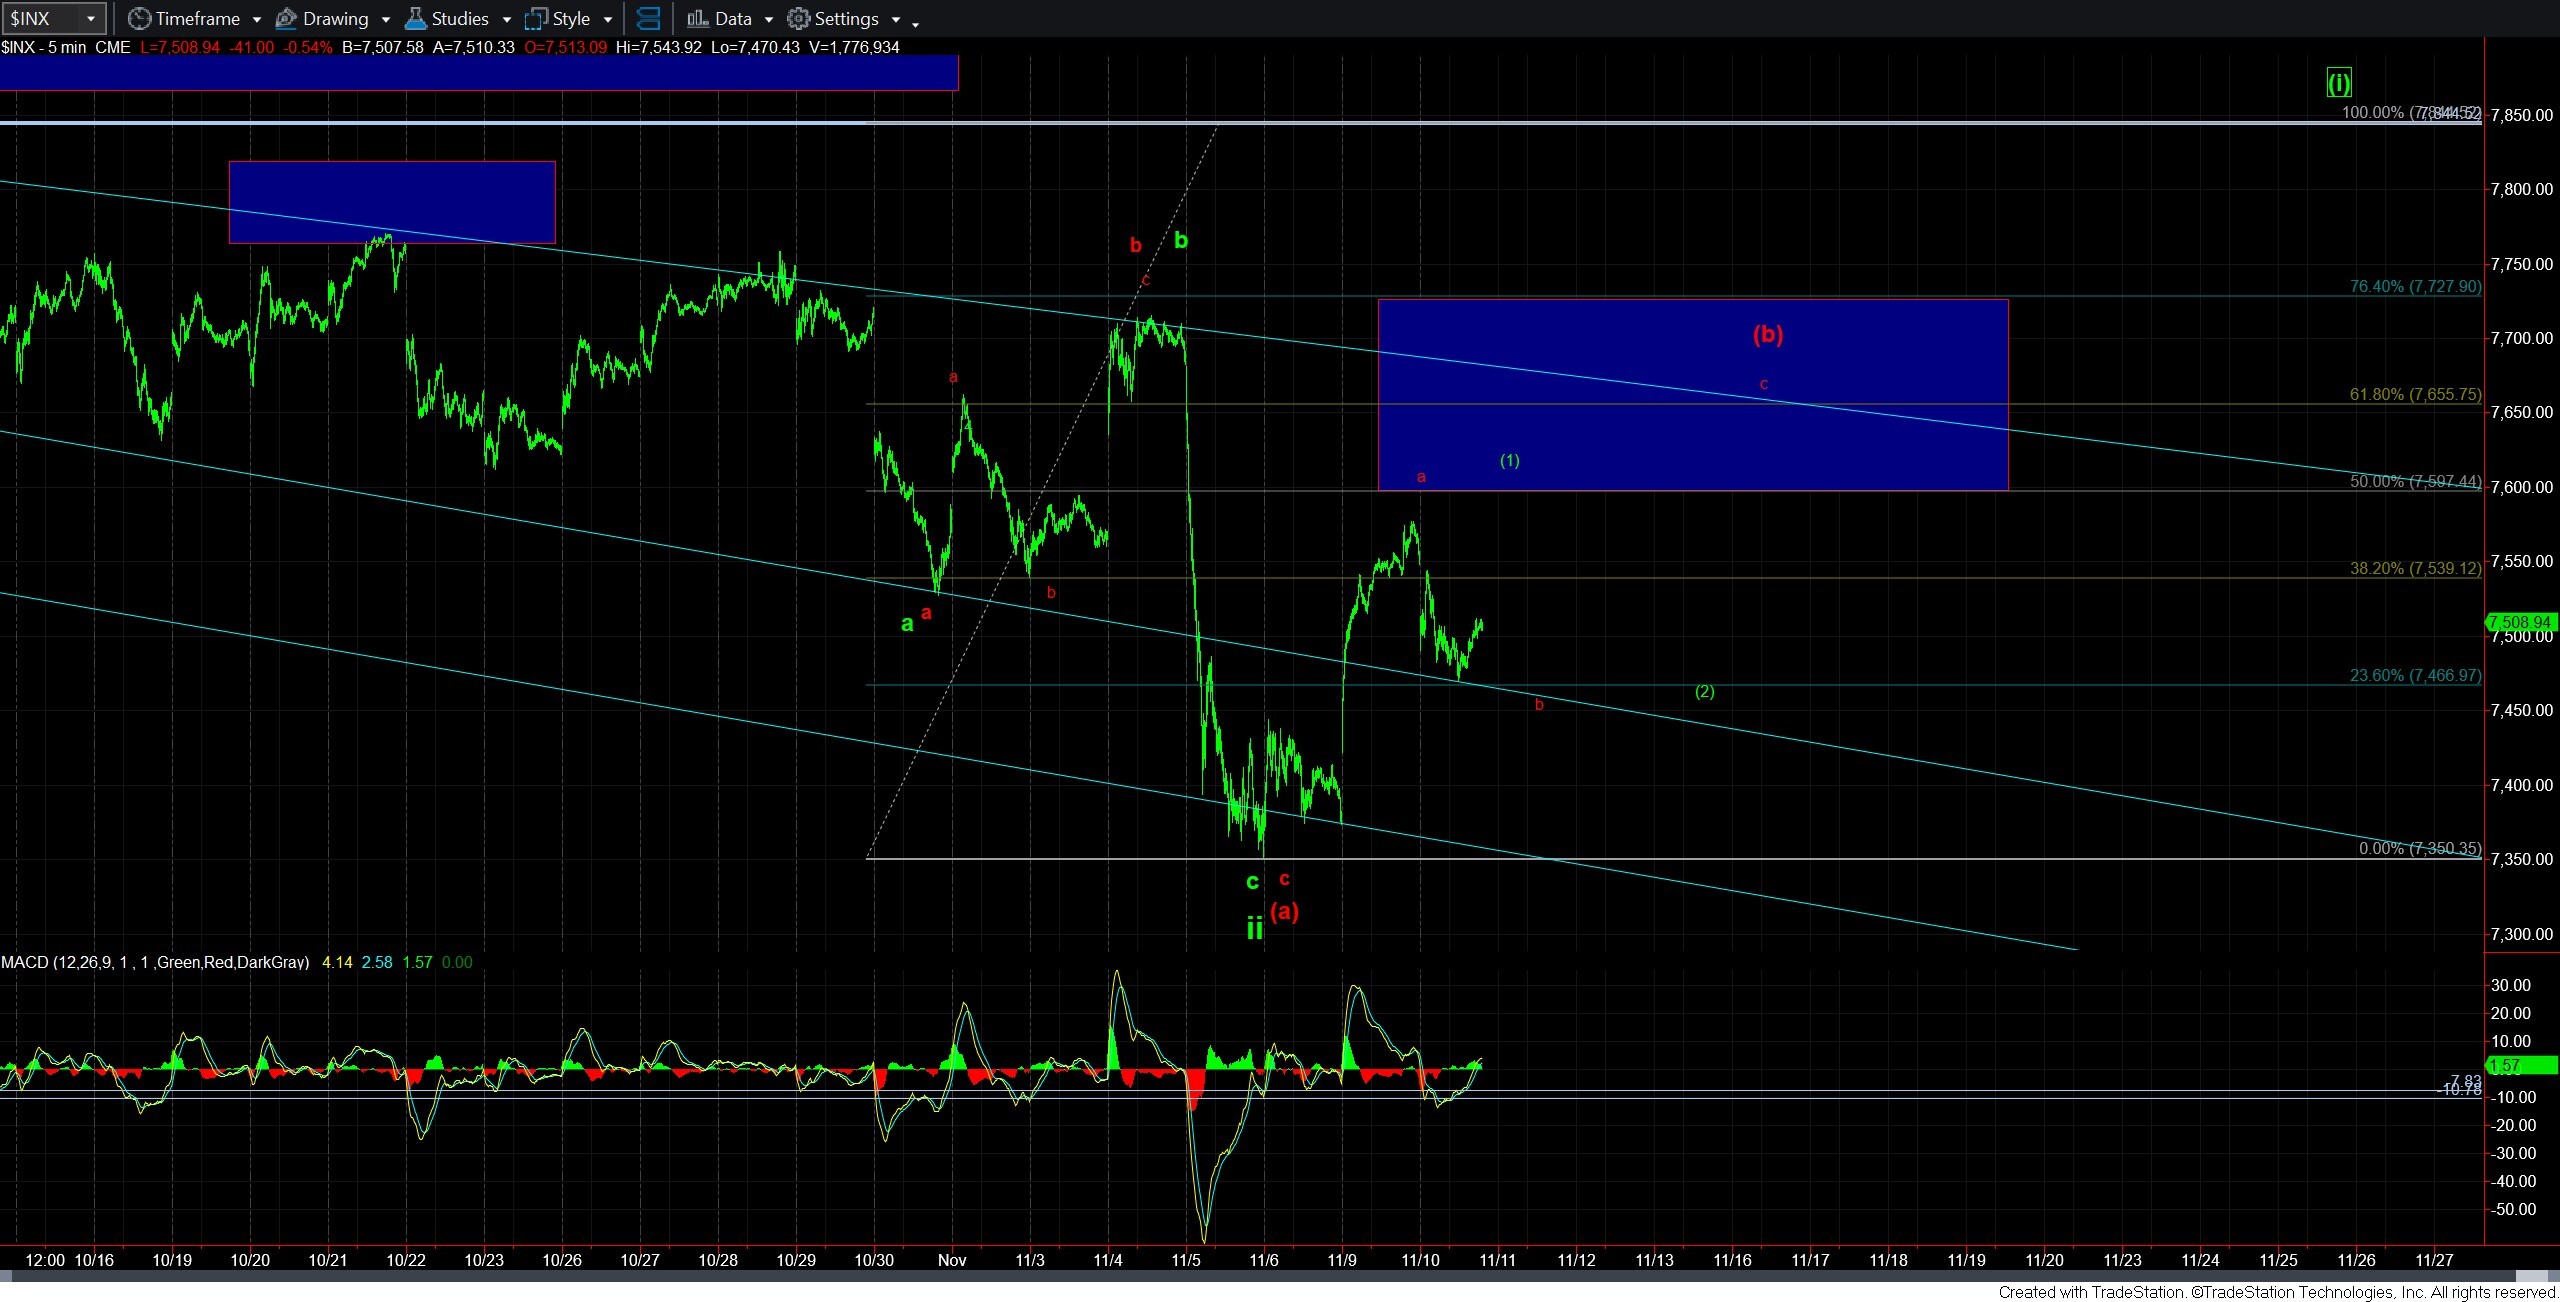
Avi | November 10, 2026 | SPX cash index, 5-minute. Original update snapshot. View original chart.
What could change the recommendation
An impulsive decline through ES support would weaken the expected rally and bring a completed larger rebound back into consideration. A fresh qualifying bearish update can trigger a model exit or reversal under the saved rules. The broader green count staying alive does not override the SPY protective stop or other normal exits.
If the market rallies toward the SPX resistance box, we will reassess the structure and subsequent update. The box is an analysis reference, not an automatic profit-taking instruction: the Core-long model has no fixed price target.
Current technical readings
SPY remains below its short-, medium- and longer-term averages, and momentum remains negative. These readings show that the broader technical trend has not yet turned upward. The Core-long entry follows the qualifying EW call; the saved rules do not require the supplemental trend conditions to be met first.
The Volatility indicator is 99.21, around the 63th percentile of trailing-year readings, compared with Monday’s 98.43 close. SPX is 7,507.37 at 2:42:38 PM Eastern. Calculations use completed history through November 9 plus current intraday readings.
Supplemental status: The long setup does not qualify because upward trend alignment is absent. The short setup’s trend and price-range conditions remain present, but its volume requirement is not met at this decision, so it would not qualify for a new entry if Core were flat. The actual Core-long signal takes priority; no supplemental position is opened alongside it.
Managing the new position
The new long’s initial protective stop is $729.66, calculated as entry multiplied by 97.5%. The holding clock starts at zero. The previous short’s stop and target are retired when that trade closes; they do not apply to the new long.
Normal long exits include the protective stop, an RSI reading below 42.5 at a model evaluation, a qualifying bearish EW exit subject to the saved exception, and the holding-period rules. The additional losing-trade review applies only on days 7–9 when all its conditions are met. The 2.5% stop distance is not a guarantee against larger losses from gaps or slippage.
Closed trade: November 3–10 Core short, $756.26 to $748.37, held 5 trading sessions after entry: +$7.89 per share; +1.04% before costs. This is a realized model-reference result, not a verified brokerage execution. The new long’s open result starts at zero at the same reference.
Sources and reference times
November 10 — Pullback Leading To Higher? | November 9 — Narrowing Down The Paths | November 7 weekend — Have Bulls Lost Control Of This Market?
Eastern Standard Time: daily update published November 10 at 2:47:15 PM, revision 1; decision 2:59:18 PM; SPY 2:41:00 PM; SPX 2:42:38 PM; Volatility indicator 2:42:31 PM. The SPY feed is approximately 15 minutes delayed and its reference is about 18 minutes old at the decision. Both model transactions use that displayed price. Intraday indicators and cumulative volume remain unfinished; charts retain their original snapshots.
The ES chart shows a session low of 7,493 above the deeper support region. A separate futures reading retrieved during this review also reported that low; its provider did not supply an exact quote timestamp. The November 4 corrected SPY high of $769.23 remains preserved in the historical calculations.
Please note: Investing contains substantial risk of loss and is not suitable for every investor. You could potentially lose all or more than your initial investment amount. Hypothetical performance results are no guarantee of future results and do not include trading commissions and other execution costs. EWT is not a broker-dealer or investment advisor, does not owe a fiduciary duty to you, and is not providing you with customized or personal advice that takes into account your specific circumstances. Content provided by our analysts on our site and outside of our site does not constitute investment advice or recommendations and is offered for information purposes only. Any of your actions or forbearance from taking action based on our content or the use of our services is entirely at your own risk. View our terms.
