
Market Analysis for Oct 30th, 2026
 By
SPY Wave & Volatility Model E.O.D. Report
Approaching A Risk-Defined Opportunity
October 30, 2026 | Decision: 3:20:10 PM Eastern
TODAY'S ACTION: CLOSE THE CORE SHORT AND BUY A CORE LONG WITH STOP AT 2.5% OR $733.34 SPY.
The model records both actions at the current SPY reference of $752.14. The new long’s protective stop is $733.34, 2.50% below entry. This is an aggressive entry based on the anticipated turn; a lasting bottom has not been confirmed.
| Position summary | Today's model status |
|---|---|
| Entry / holding age | Core long from October 30 at $752.14; age 0 trading sessions |
| Current reference | $752.14 at 3:00:05 PM Eastern; approximately 15-minute feed delay |
| Open result | +$0.00 per share (points); +0.00% before costs; unrealized |
| Protective stop | $733.34; 2.50% below the new entry |
| Next holding-period check | Normal exits remain active. Loss-based review on days 7–9; exit at day 10 if flat or losing; maximum age 30 sessions if profitable. No fixed Core-long profit target. |
Closed short: October 26 entry $765.40; October 30 exit $752.14. Model result: +$13.26 per share (points), +1.73% before costs, over four trading sessions. Both today’s exit and new entry are model reference transactions, not verified brokerage executions.
Why the model is changing direction
Avi has shifted from looking for the decline to develop toward looking for it to finish, possibly today or early next week. He explicitly includes buying this decline as the aggressive approach. Under the saved Core rules, that qualifies as a bullish call and ends the existing short.
The two paths still differ. The blue futures count could complete the correction sooner. The green SPX count, which Avi slightly favors, allows a bounce followed by one more low. The model is accepting that remaining downside risk; it is not declaring that support has already produced a confirmed reversal.
Why this Core buy qualifies
The Core entry rule follows the operative Elliott-wave call and does not require the technical readings to turn positive first. Waiting for a strong rally through resistance or a subsequent corrective pullback is another approach discussed in the update, but it is not a mandatory entry condition in this saved model.
That distinction matters today: momentum is weak enough that the existing momentum-exit rule could end this new position at a subsequent review if weakness persists. The model checks existing positions before opening a new one; it does not repeatedly buy and exit within the same decision. This is an aggressive entry with a defined stop, not a technically confirmed trend reversal.
How the analysis guides the decision
Fresh EW evidence: Bullish 1/4 | Bearish 0/4. The bullish point comes from the current bottoming outlook and explicit buy-the-decline plan. No points are awarded for a completed upward impulse, a resistance breakout or a confirmed support rebound, because those have not yet been established.
The decline is being discussed as approaching completion. Another low under the green path remains possible after a corrective bounce, but that future sequence is not scored as a newly confirmed downside continuation signal. These scores describe the update’s evidence, not the probability of a winning trade. The bullish classification is a discretionary interpretation of the aggressive plan; it does not imply Avi ruled out a further decline.
Daily and weekend perspective
This new broader update replaces the prior weekend’s immediate sequence. The previous yellow bullish count is now green; the color change alone does not change the underlying idea. The larger opportunity remains a possible rally toward 9,000-plus in 2027 if the correction holds and the next advance develops convincingly.
The risk is that the larger market top is already in place. Avi identifies 7,380 SPX as a warning and 7,237 SPX as the broader bullish-pattern invalidation. The model’s new SPY stop controls this trade independently; it will not wait for the larger SPX pattern to fail before honoring its own risk limit.
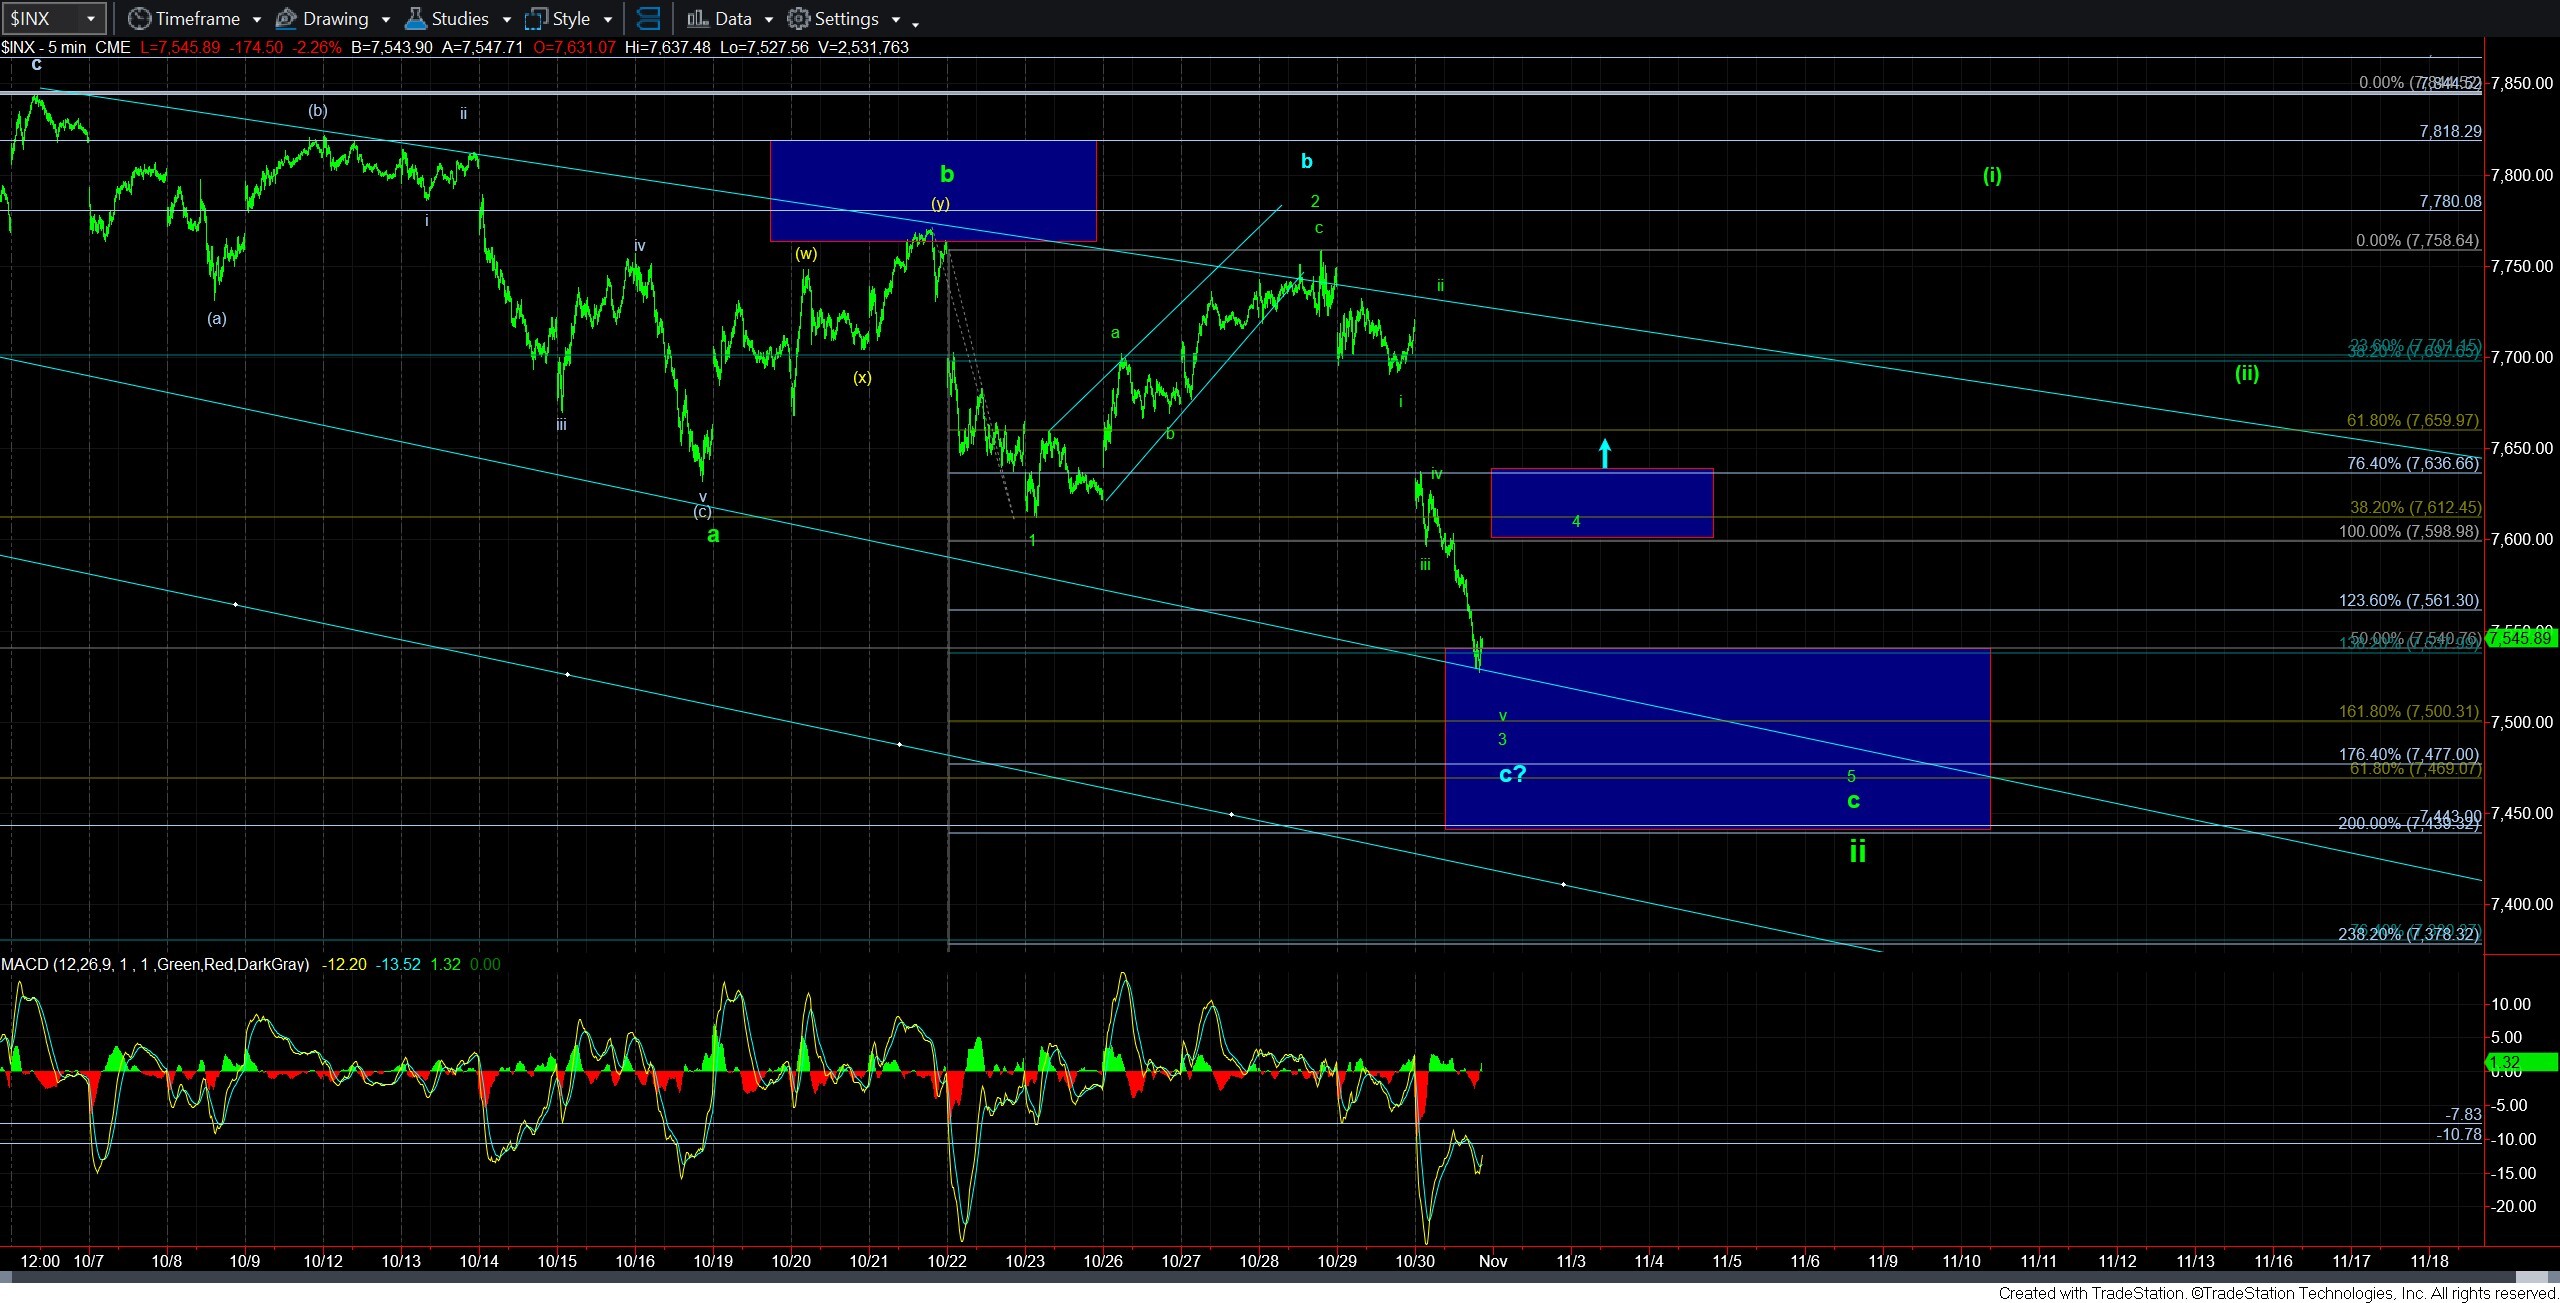
Avi | October 30, 2026 | SPX cash index, 5-minute. Original update snapshot. View original chart.
Levels that matter now
| Instrument and reference | What to watch |
|---|---|
| SPX: around 7,500 | The ideal green wave 3 target. A bounce from this region could still be followed by one more decline. |
| SPX: 7,439–7,469 | Avi’s preferred deeper support zone. The observed session low of 7,527.56 remains above it; the zone has not yet been tested in the retrieved range. |
| SPX: approximately 7,599–7,637 | The near-term resistance box on the 5-minute chart. A corrective bounce that stalls here would preserve the green path to another low. |
| SPX: around 7,650 | The character of a rally through this area matters. A strong impulsive advance would favor the bullish path; a corrective rally would leave the larger topping risk unresolved. |
| SPX: 7,380, then 7,237 | Warning level followed by the broader bullish-pattern invalidation. These are SPX analysis levels, not the model’s SPY stop. |
Chart-box boundaries are approximate. The blue ES futures count and green SPX cash-index count are different alternatives; their levels are not interchangeable. The model uses its own SPY entry and stop.
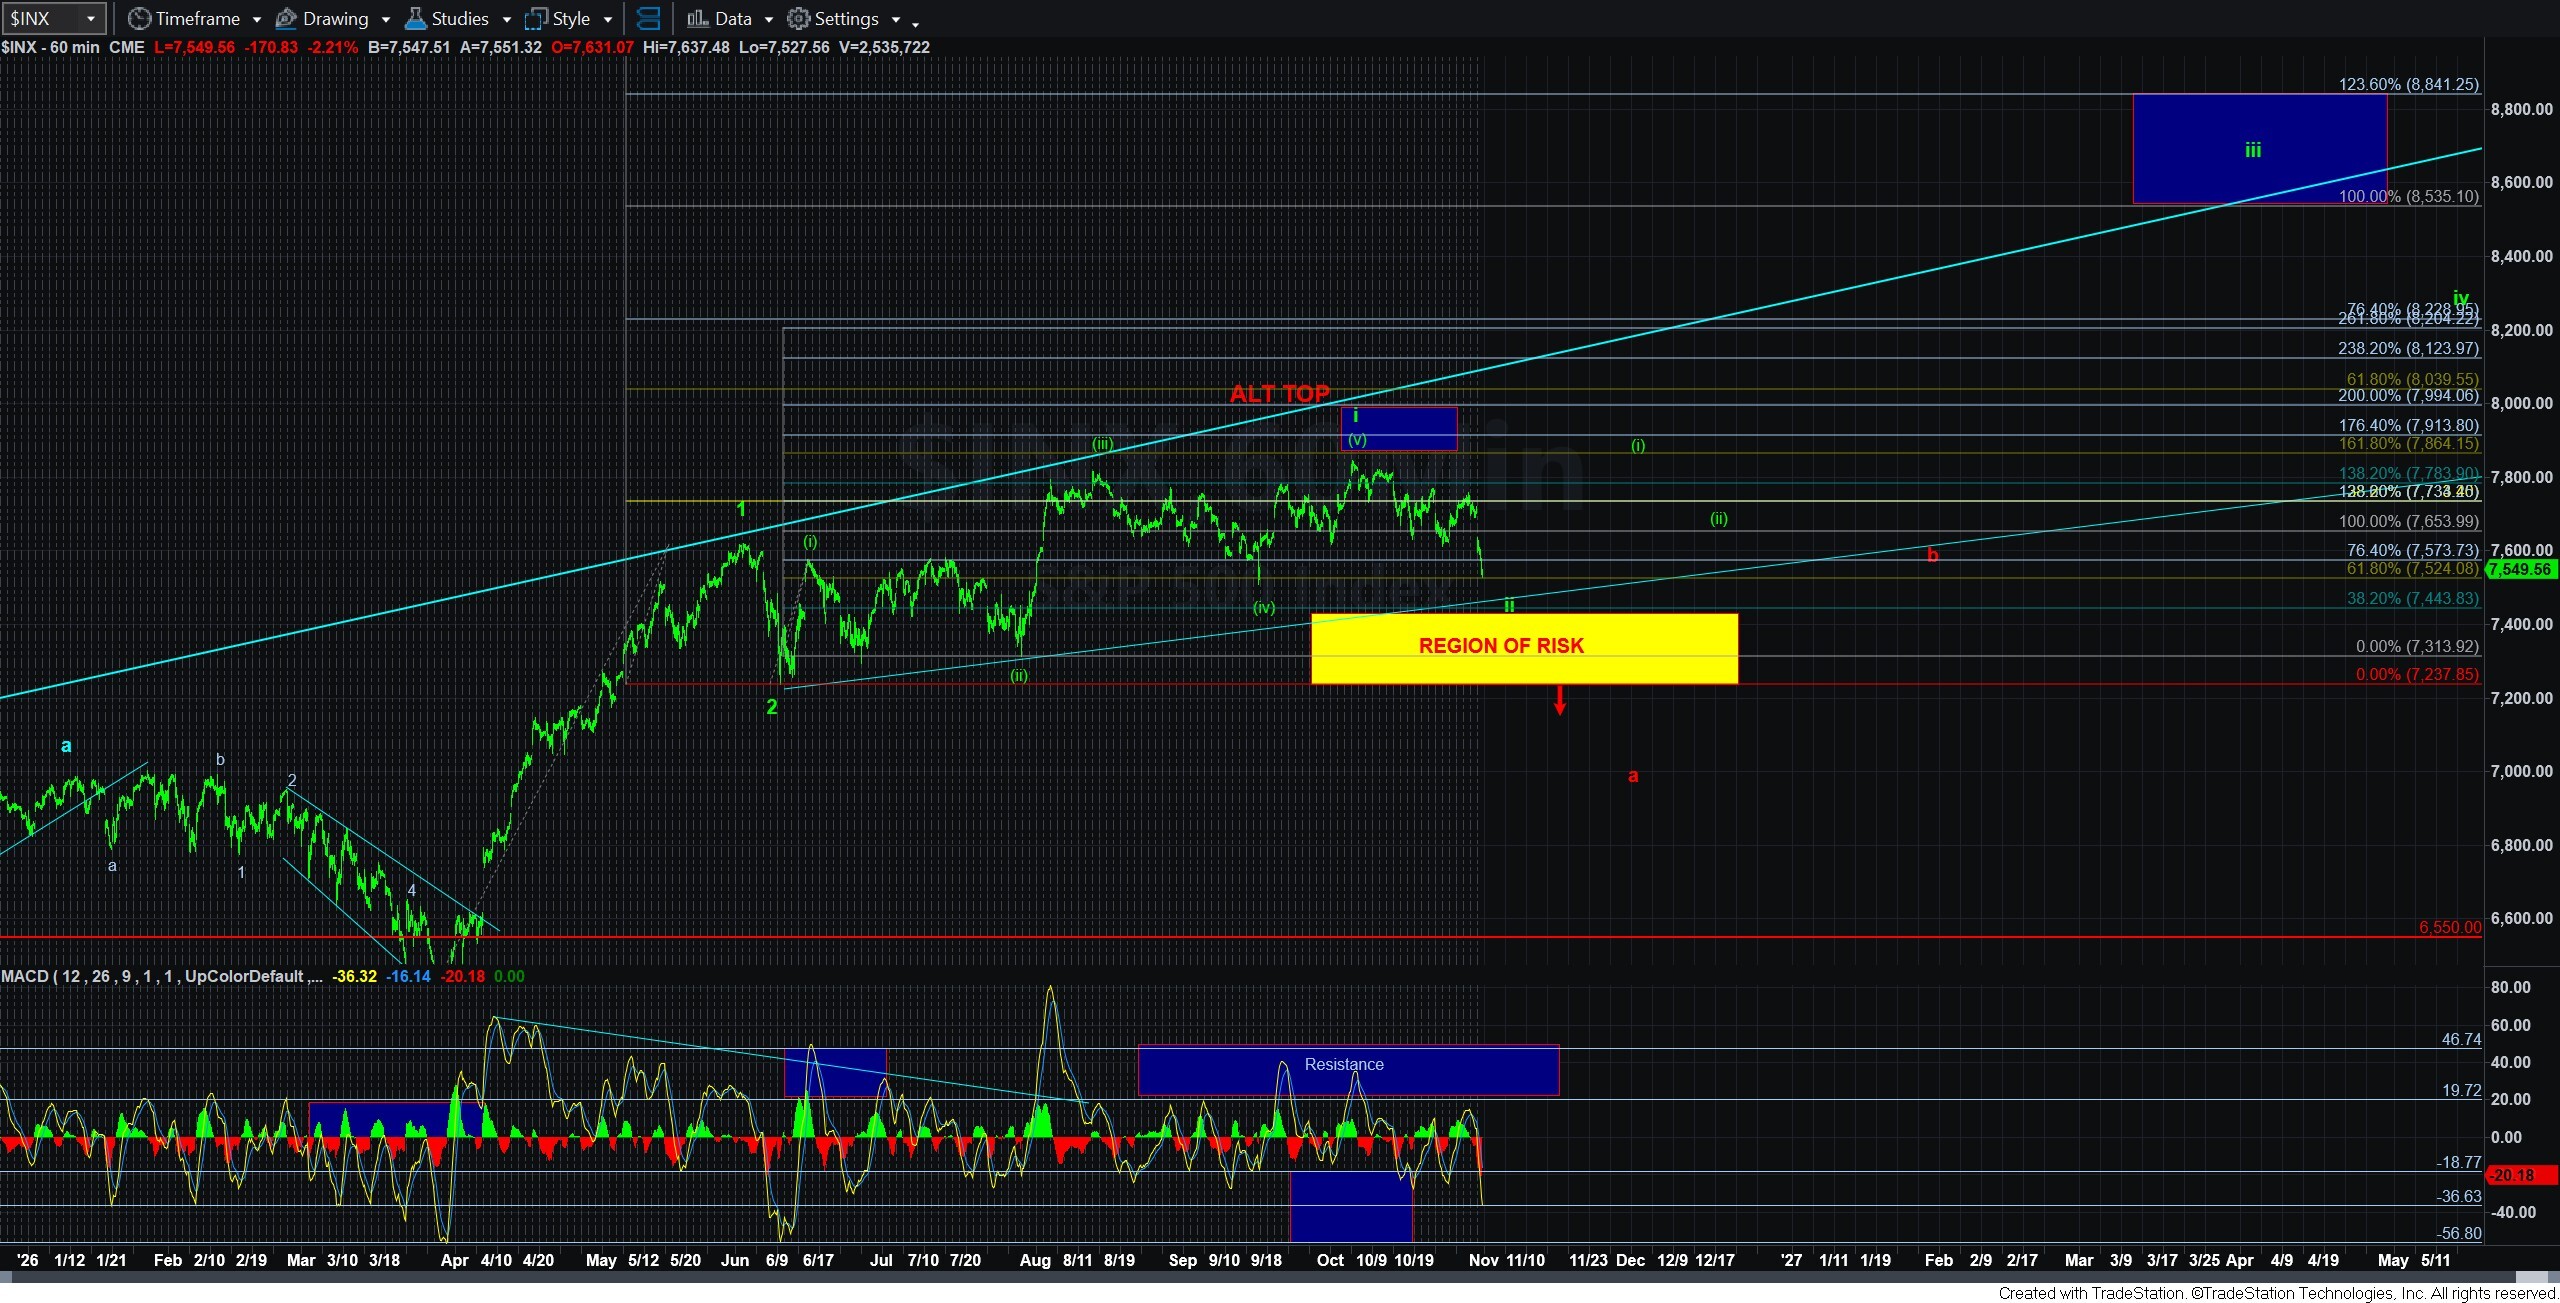
Avi | October 30, 2026 | SPX cash index, 60-minute. Original update snapshot. View original chart.
What could change the recommendation
A strong advance through resistance would improve the case that the correction is complete. A weak bounce that stalls would leave another low in play. A fresh bearish call, a qualifying opposite short, continued weak momentum at a later model review, a stop hit or a holding-period exit can end the long before the larger bullish scenario develops.
Current technical readings
SPY is below its short-, medium- and longer-term trend averages. Momentum is weak, price is below its lower daily Bollinger band, and current volume is elevated. These readings do not confirm a bottom and make this an aggressive Core entry.
The Volatility indicator is 118.89, around the 93rd percentile of its trailing-year readings, up from 98.01 at the prior close. SPX is 7,540.74 at 3:02:38 PM Eastern. Calculations use completed history through October 29 plus current intraday readings.
Supplemental status: Neither direction qualifies, even if Core were flat. The long lacks the required price and strength conditions. The short-term average is still above the medium-term average, and price is outside the supplemental short’s eligible range. Core takes priority; no second position is opened.
Managing the new position
The new Core-long stop is $733.34, calculated as $752.14 × 97.5%. Keep this original stop rather than widening it to accommodate the broader SPX count. There is no fixed Core-long profit target. The new holding clock begins today; the closed short’s holding age does not carry into the long.
The protective stop is active from entry. Earlier session lows are not applied retroactively to the new trade. The normal momentum, Elliott-wave and holding-period exits continue to apply. A stop distance is not a guarantee against a larger loss through a price gap or slippage.
Sources and reference times
October 30 broader market update and charts | October 29 update | October 24 prior weekend update
Eastern times: October 30 update, publication and revision 1 at 3:11:58 PM; decision 3:20:10 PM; SPY 3:00:05 PM; SPX 3:02:38 PM; Volatility indicator 3:02:31 PM. Quotes use an approximately 15-minute delayed feed; the SPY reference is about 20 minutes old at the decision and predates the publication. These are the latest retrieved readings, not verified execution quotes. Intraday readings are unfinished; charts retain their original update snapshots.
Please note: Investing contains substantial risk of loss and is not suitable for every investor. You could potentially lose all or more than your initial investment amount. Hypothetical performance results are no guarantee of future results and do not include trading commissions and other execution costs. EWT is not a broker-dealer or investment advisor, does not owe a fiduciary duty to you, and is not providing you with customized or personal advice that takes into account your specific circumstances. Content provided by our analysts on our site and outside of our site does not constitute investment advice or recommendations and is offered for information purposes only. Any of your actions or forbearance from taking action based on our content or the use of our services is entirely at your own risk. View our terms.
