Market Analysis for May 2nd, 2022
 By
Ricky Wen
By
Ricky Wen
E-mini S&P 500 Futures: Keep It Simple Stupid – Hovering At Monthly Range Low, Fed Week
Copying and pasting a section from our ES trade alert room’s premarket gameplan report. FYI, the ES trade room provides real-time entries and exits with pre-determined stoploss and target levels alongside with real-time lessons on strategy/risk management/psychology/momentum. We specialize in quick intraday alpha setups and short-term swings with duration of 2-5 days and occasional 10-15 sessions holding period (some key levels + strategies have been redacted for fairness to subscribers). In addition, we share bonus setups across commodities such as GC/GOLD,CL/Crude oil, PL/platinum,ZS/soybeans and individual stocks from time to time in order to generate more alpha/outperform.
(skip to current parameters section for intraday traders, then read full report, context is king)
Context section:
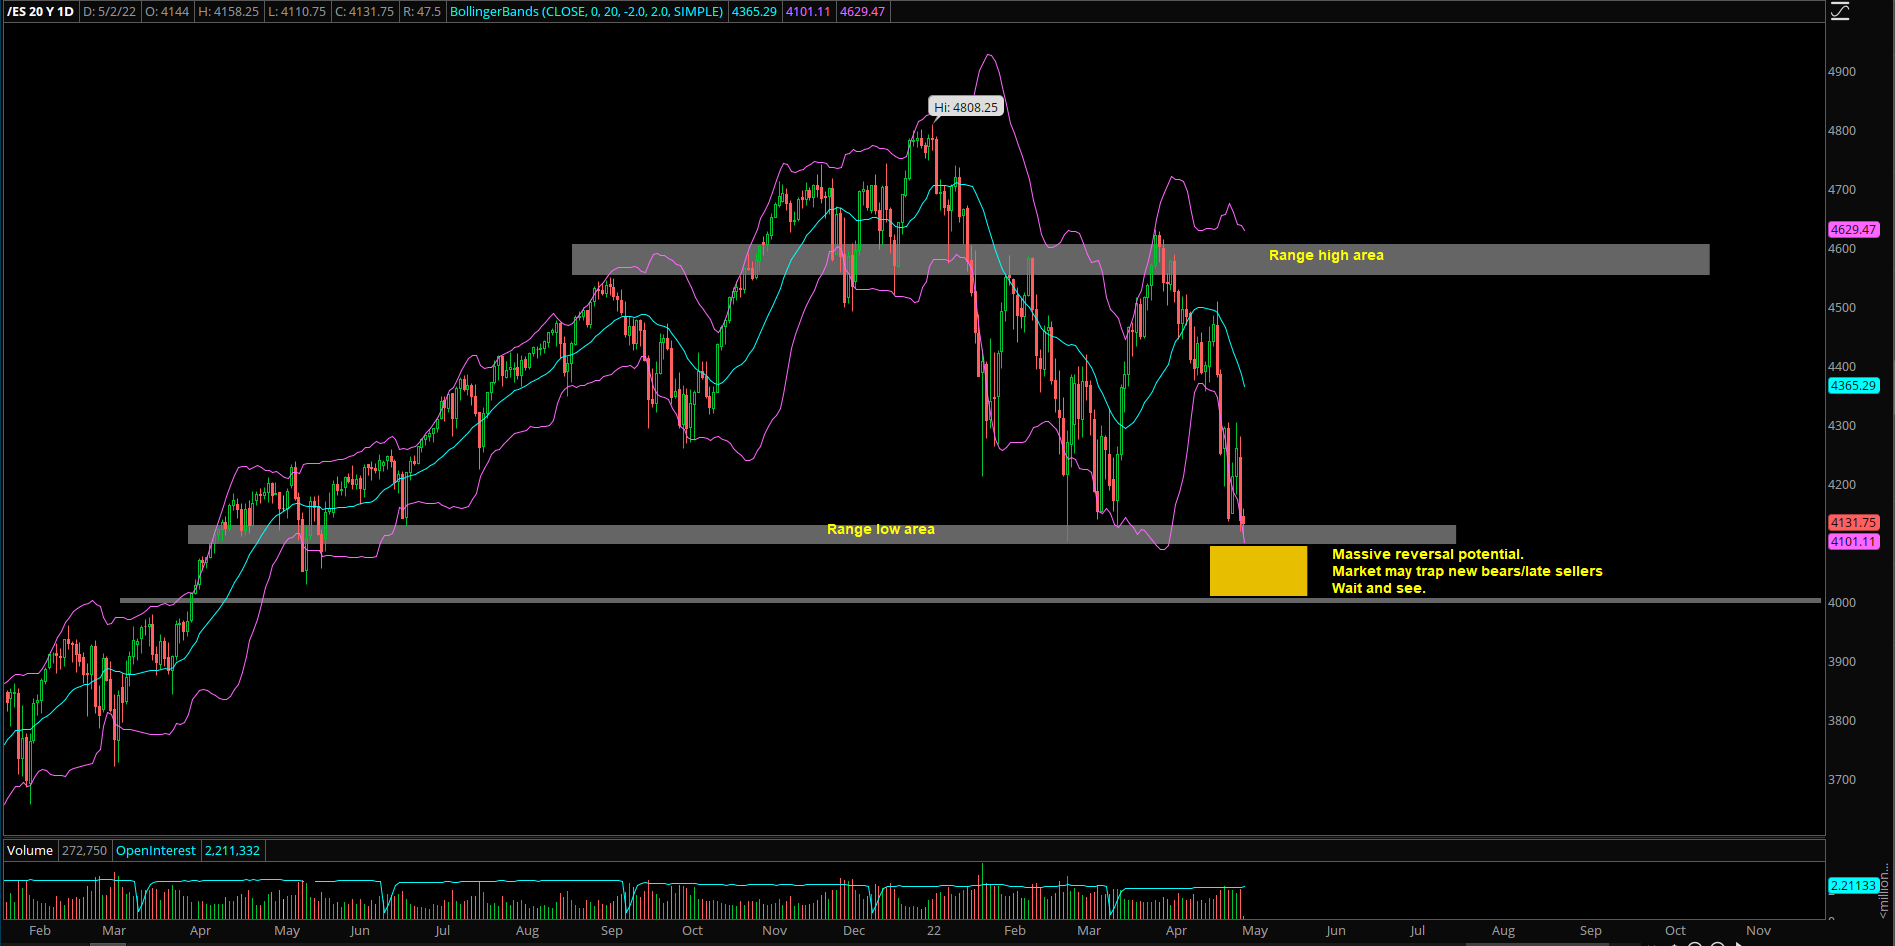
Starting from mid Jan 2022, since the decisive breakdown below the trending daily 20EMA + 4650s area, the market has continued trading in a massive sideways range of 4630s-4100s. And within this period the majority of time has been spent between 4585-4250.
- Feb’s monthly range = 4586-4101.75
- March’s monthly range = 4631-4129.5
- April month range = 4588-4118.75 (closed around the lows)
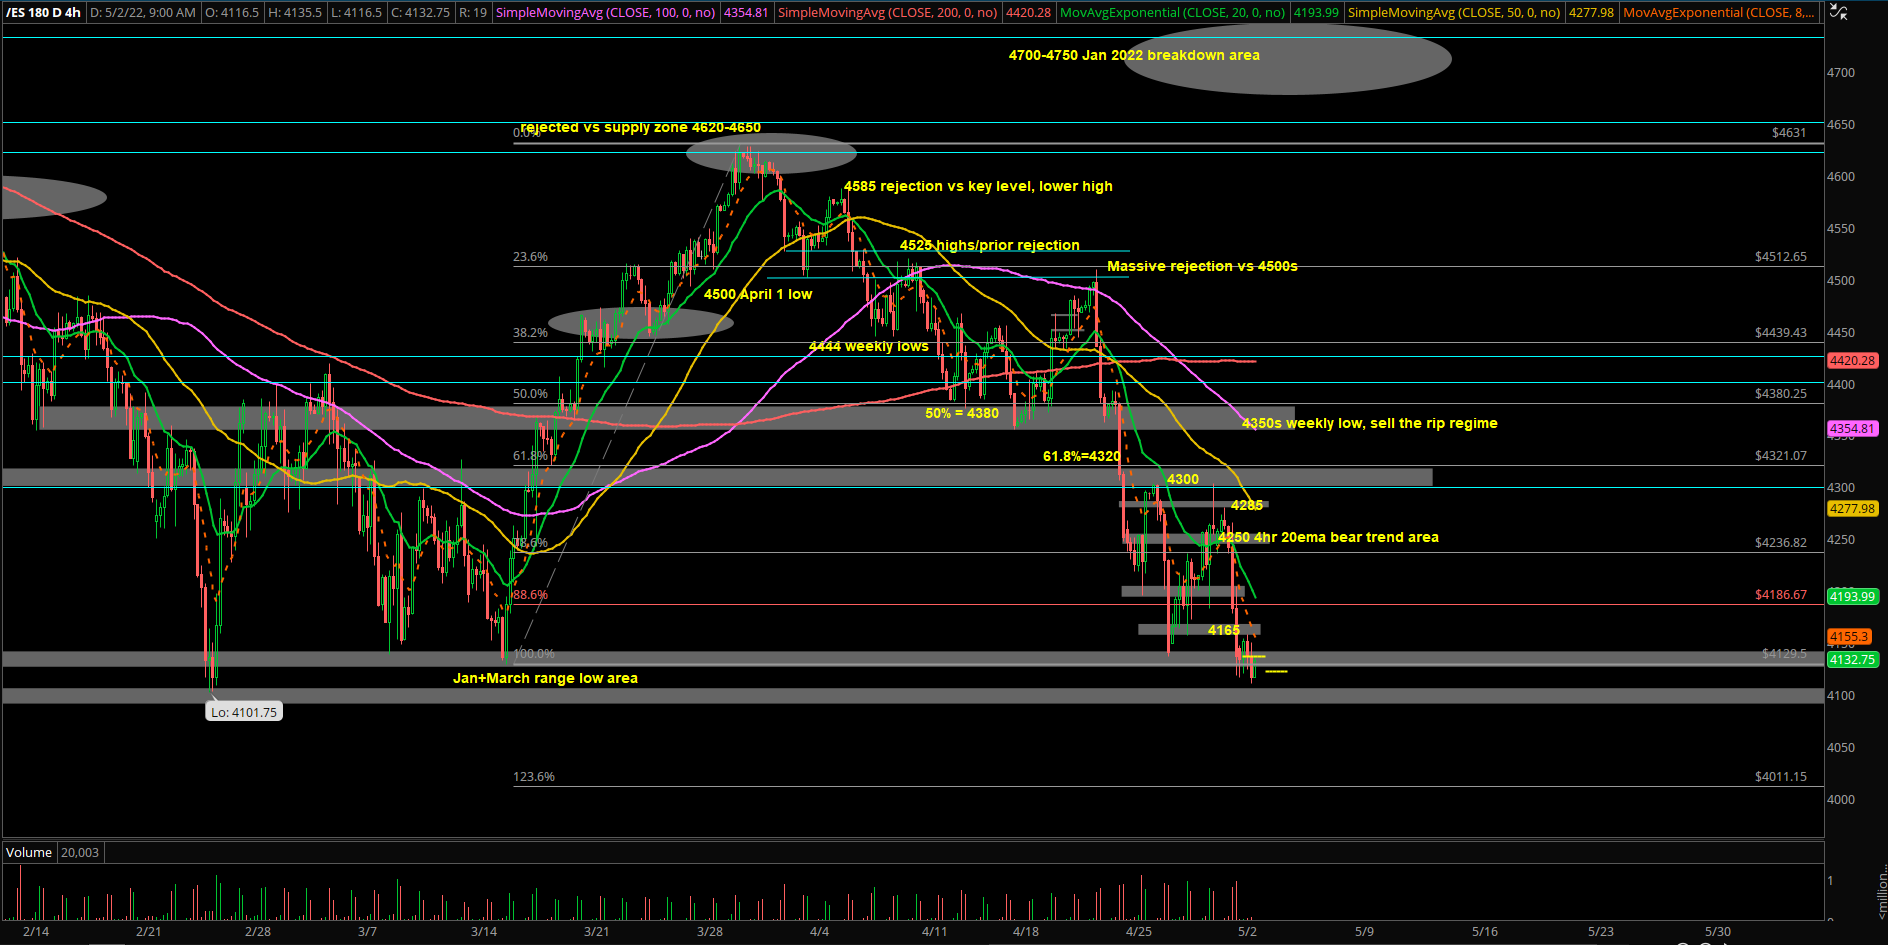
The most recent breakdown setup: April 21 rejection at prior resistances that showcased a massive intraday turnaround. If you recall, the day started at the highs and closed at lows: ES -2.8% and -4% NQ range on April 21st. During the final week of April, both indices had fulfilled their ES 4100s NQ and 13000 targets.
Price action remains trending down as it’s below daily 20EMA.
The onus is now on the higher timeframe buyers to showcase they want to build a floor around here or the selling keeps cascading into lower lows. Hence, we also need to be aware of potential big mean reversion moves to the upside IF price action stabilizes vs. the multi-month lows area. We’re watching ES 4000-4080 and NQ 12800-12500 area closely, more on this in the latter section of this report.
Current parameters:
- Daily 20EMA bear train, higher timeframe sellers in favour when daily closing prices remain below ES 4250 + NQ 13300
- Immediate trending intraday resistances = ES 4185 and 13080 for sell the rip regime, these are the levels for immediate momentum to be bear. Above them, things may change under the surface for a bigger deadcat/some sort of temp low being formed
- Overnight range = ES 4158-4110, current price = 4118 Market attempting to open as -0.2% gap down vs Friday’s close. NQ -0.35% gap down at 12800~.
Two main ideas intraday for RTH (regular trading hours):
- Primarily expect a digestion/consolidation day: see if price action attempts to poke underneath the ES 4100 multi-month low and start basing back into 4150/4185
- A sustained break below 4100 without an immediate reversal/sticksave, opens trend day down to 4080/4050
We did quite well in April scalping ES+NQ so we’ll continue to go for quick opportunities given the elevated volatility.
Don’t plan on holding overnight inventory unless we see an opportunity for a massive mean reversion to the upside.
Focus on scalp opportunities vs the key levels for execution, level by level approach
Bigger picture:
ES shed -8.8% in April, NQ shed -13.5%. Keeping it simple here.
Negative sentiment at extremes and stocks under 200 day moving average near extremes. The indices are also hovering around 2 standard deviation lows.ES+NQ hovering around multi-month lows of this year. This is often the characteristics of a sharp mean reversion so we need to be aware of the risks to the upside if a deadcat bounce/climax bottom occurs here.
Mostly watching ES 4000-4080 and NQ 12800-12500 area for this potential to occur. We need to see some sort of an attempt to break below the multi-month range, trap new bears/late sellers and reverse back into the multi-month range. If you recall, the range for most of this year has been ES 4100-4600, NQ 13000-15260.
In essence, higher timeframe buyers such as the monthly are looking for an attractive deal here as we head into Weds FOMC + jobs report near end of week.
Eg. if a scenario like piercing multi-month lows 4100~ on ES occur, flush out a new lows into 4080-4000s and then by end of week it closes above/near ES 4250. Then, it would act as a huge clue/confirmation late sellers failed and buyers found a floor to play with for the next couple weeks of May.
Right now, we don’t see risks of limit down action so we’ll shy away from extreme views of some market participants until price proves otherwise. Wait and see mode.