Market Analysis for Apr 25th, 2022
 By
Ricky Wen
By
Ricky Wen
Monday April 25 Gameplan
Context section:
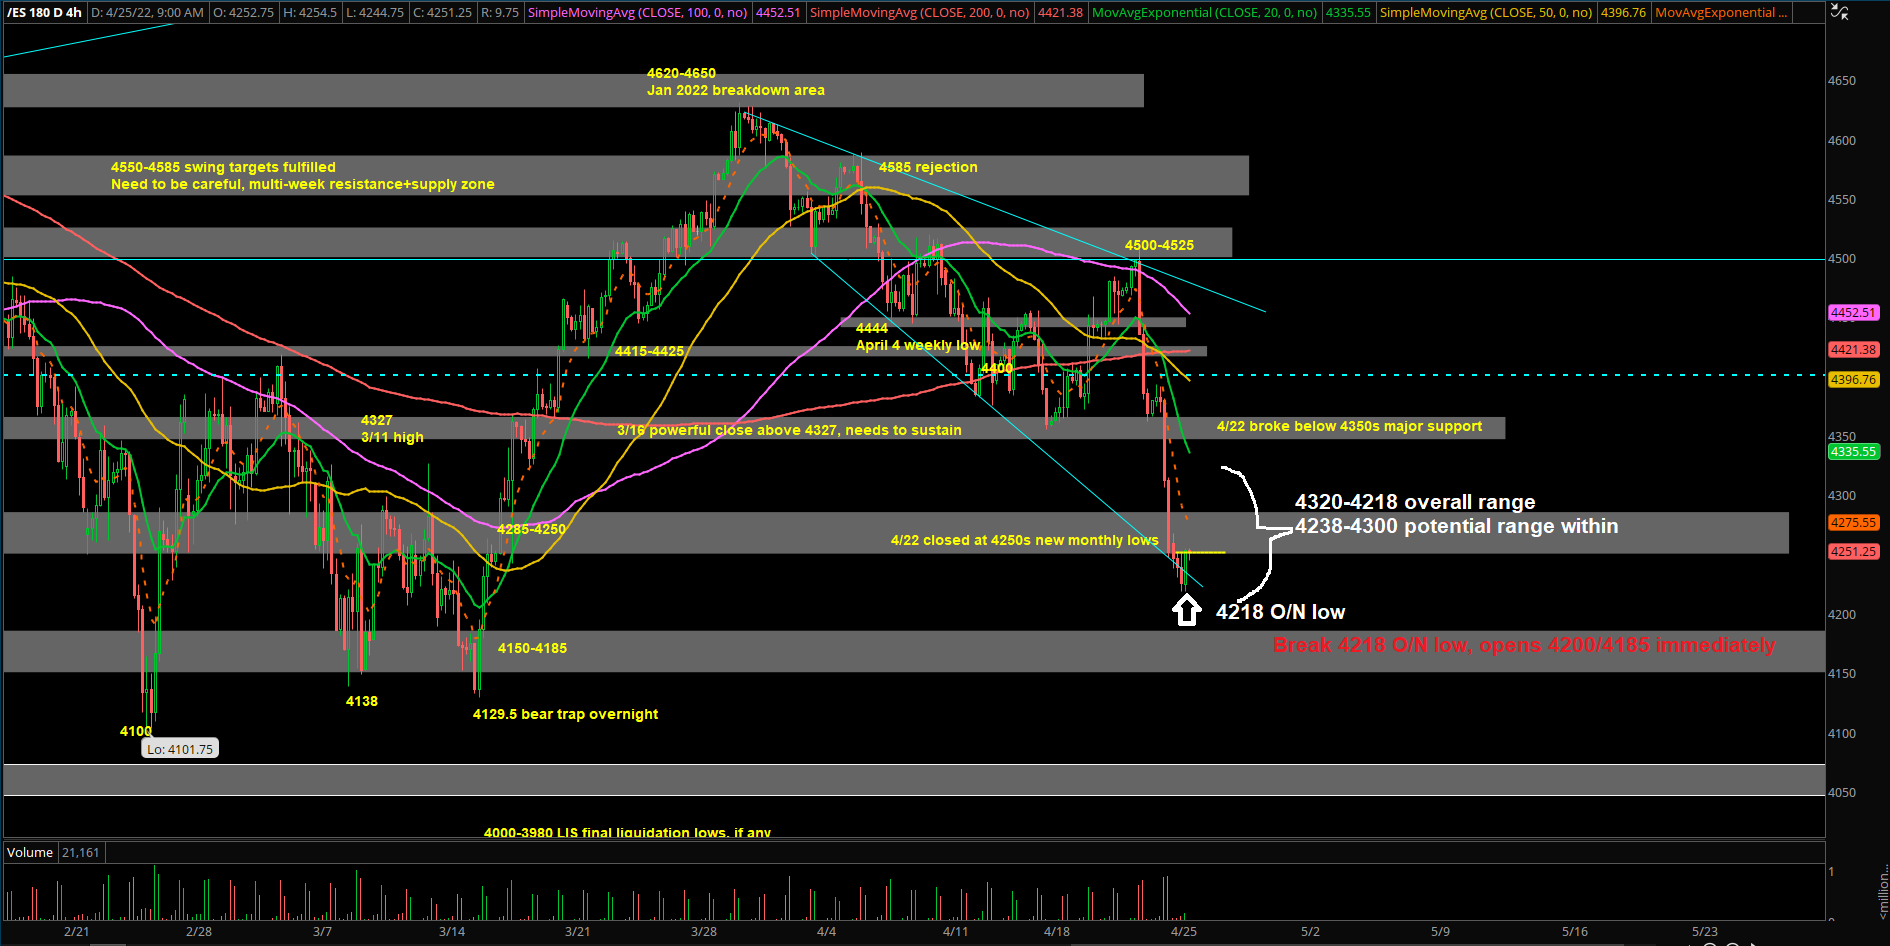
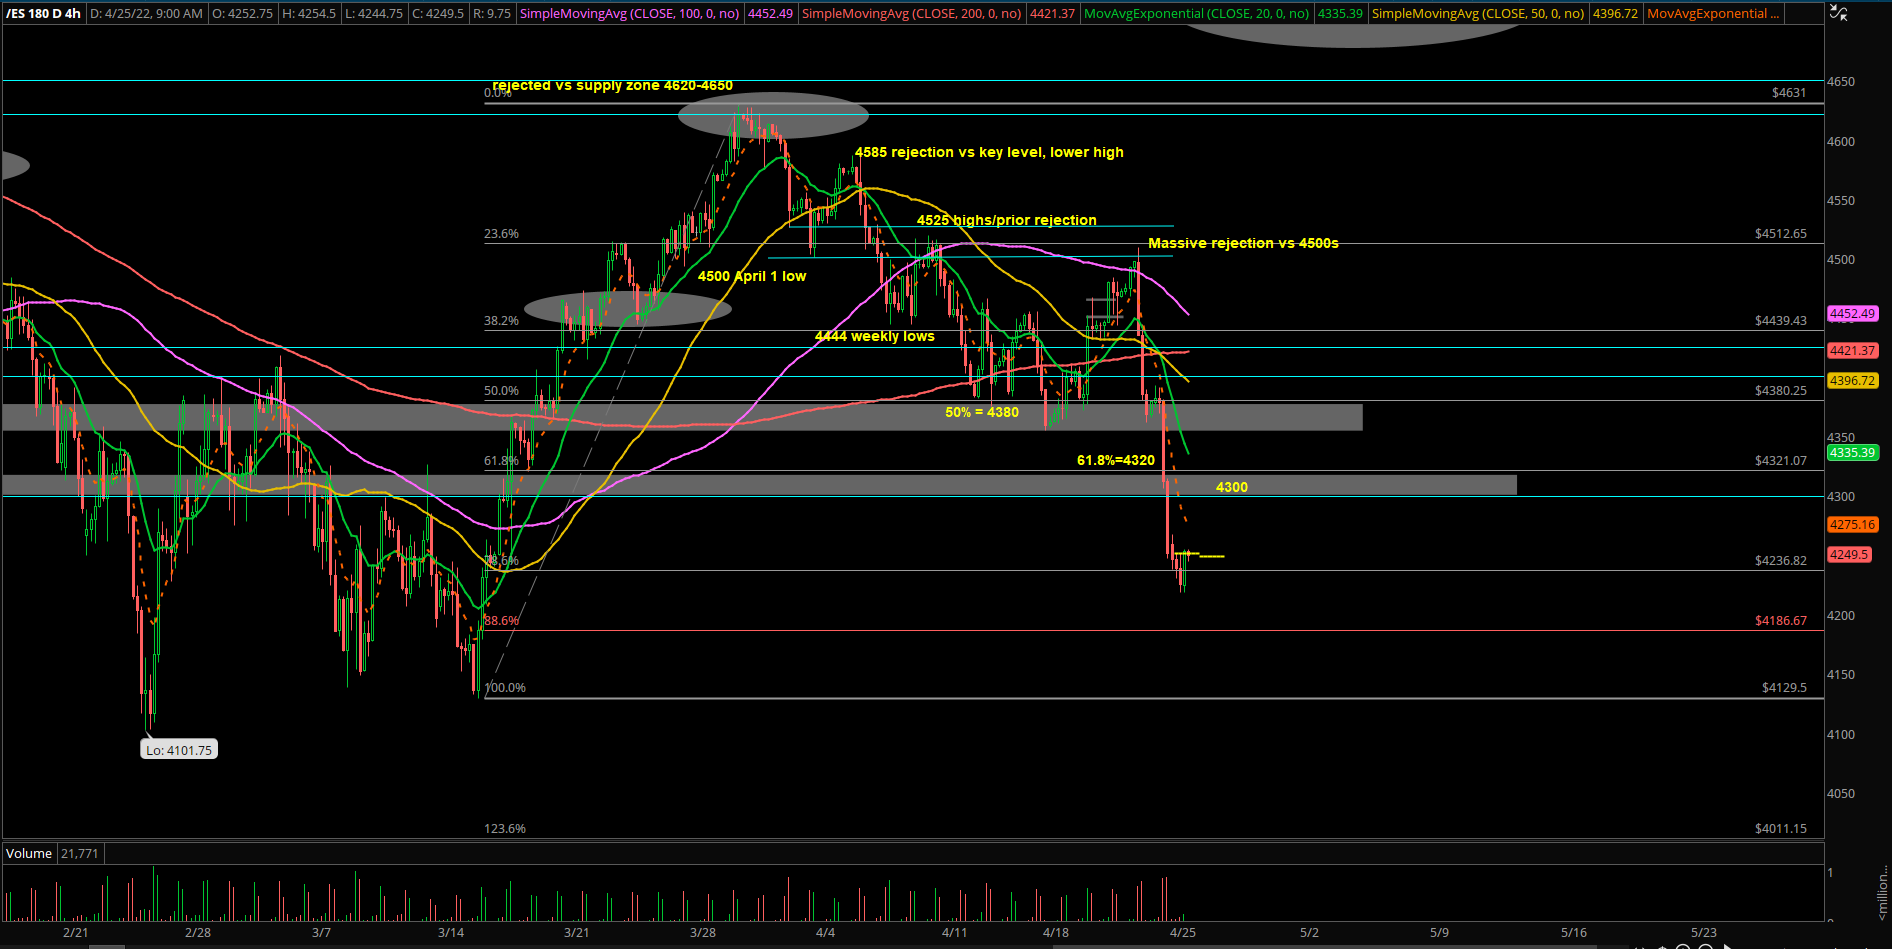
Starting from mid Jan 2022, since the decisive breakdown below the trending daily 20EMA + 4650s area, the market has continued trading in a massive sideways range of 4630s-4100s. And within this period the majority of time has been spent between 4585-4250.
In addition, no short-term directional trend that has outlasted for more than 2 weeks before it reversed into the other side testing extremes. Whipsaw environment/massive rangebound.
- Feb’s monthly range = 4586-4101.75
- March’s monthly range = 4631-4129.5
- Ongoing April month range = 4588-4218.5 (new monthly lows)
April’s monthly price action continue to be trading entirely within the previous month indicating indecision and consolidation before the next decisive monthly move (eventually outside the range)
Thursday April 21 bulls fumbled and failed to sustain a gap up and go breakout above ES 4500 and NQ 14280 key levels and produced a massive intraday rejection that closed at the lows.
Friday April 22 bears took the previous day’s momentum and the week’s context to liquidate further into the downside. Ultimately, price action made new monthly lows for April on both ES+NQ. FYI, ES is down 5.3% from 4500s Thursday high to 4260s Friday close, NQ is down 6.5% from 14280 Thursday high to 13350s Friday close.
Current parameters:
- Previous Friday = massive trend day down by bears which mean sellers still have complete pressure on the daily when below ES 4350s and 13720s. Daily 20EMA bear trend
- In addition, daily charts on indices showing broken technical damage alongside with many important megacap+tech stocks. Must respect the overall downside risk of 4100s that we mentioned in previous report.
- Momentum news: the megacaps MSFT GOOGL FB AAPL AMZN report ER this week, need to be more agile as this week’s earnings could determine how the rest of the quarter/year goes. Let the dust settle first before going into things too heavily
- Overnight range = ES 4267-4218, current price = 4250. Market about to open as -0.4% gap down vs Friday’s close. Short-term continues to be oversold so we’re going to be observing the resistance levels of 4250/4285/4300/4320
- Main stance here is that both ES+NQ have broken daily charts when below 4350s and 13720s. Until price action can close above these key levels, sell pressure regime maintains full control on the higher timeframe.
- In the mean time, we will use intraday levels to look for both buy/sell opportunities given the current ranges (selling continues to be favoured)
2 main scenarios for Monday:
- 1) Expect range day digestion between ES 4218-4320 overall with the bulk trading range being in the 4238-4300 area. This intraday digestion/deadcat bounce could be treated as a little breather before Tuesday’s megacap earnings (MSFT+GOOGL)
- 2) A break below ES 4218 would immediately target into 4200-4185 for next reaction
Bigger picture:
Given April 21 massive intraday rejection from trend day up to trend day down. ES rejected vs 4500s and NQ rejected vs 14280. ES going from +1.1% on the day to down -1.2%, NQ from +2% to down -2% by end of Thursday. In addition, the immediate follow through on Friday April 22 into new monthly lows on both ES+NQ, price closing at 4250s and 13350s.
The biggest risk/concerns here are the weekly breakdown range back into extremes lows of ES 4100 and NQ 13000 in the following week(s). Massive earnings week so must respect the risk.
There are many different aspects to my reports, execute on your own timeframes. KISS.