Market Analysis for Apr 19th, 2022
 By
Ricky Wen
By
Ricky Wen
E-mini S&P 500 Futures: Keep It Simple Stupid – Sellers Remain In Control, Bulls Unable To Sustain Intraday Breakouts
Copying and pasting a section from our ES trade alert room’s premarket gameplan report. FYI, the ES trade room provides real-time entries and exits with pre-determined stoploss and target levels alongside with real-time lessons on strategy/risk management/psychology/momentum. We specialize in quick intraday alpha setups and short-term swings with duration of 2-5 days and occasional 10-15 sessions holding period (some key levels + strategies have been redacted for fairness to subscribers). In addition, we share bonus setups across commodities such as GC/GOLD,CL/Crude oil, PL/platinum,ZS/soybeans and individual stocks from time to time in order to generate more alpha/outperform.
Context section:
Starting from mid Jan 2022, since the decisive breakdown below the trending daily 20EMA + 4650s area, the market has continued trading in a massive sideways range of 4630s-4100s. And within this period the majority of time has been spent between 4585-4250.
In addition, no short-term directional trend that has outlasted for more than 2 weeks before it reversed into the other side testing extremes. Whipsaw environment.
- Feb’s monthly range = 4586-4101.75
- March’s monthly range = 4631-4129.5
- Ongoing April month range = 4588-4355.5
April’s monthly price action continue to be trading entirely within the previous month indicating indecision and consolidation before the next decisive monthly move (eventually outside the range)
Zooming in: If you recall, last week’s expected initial range was 4525-4400 since the Monday April 11th report. In reality, the weekly range played out as 4491-4375.
For the most part, all dips into 4380s-4400s were bought throughout the shortened holiday week. However, by end of the week price confirmed that bears were in full control with the short-term downtrend with Thursday closing around the week’s low.
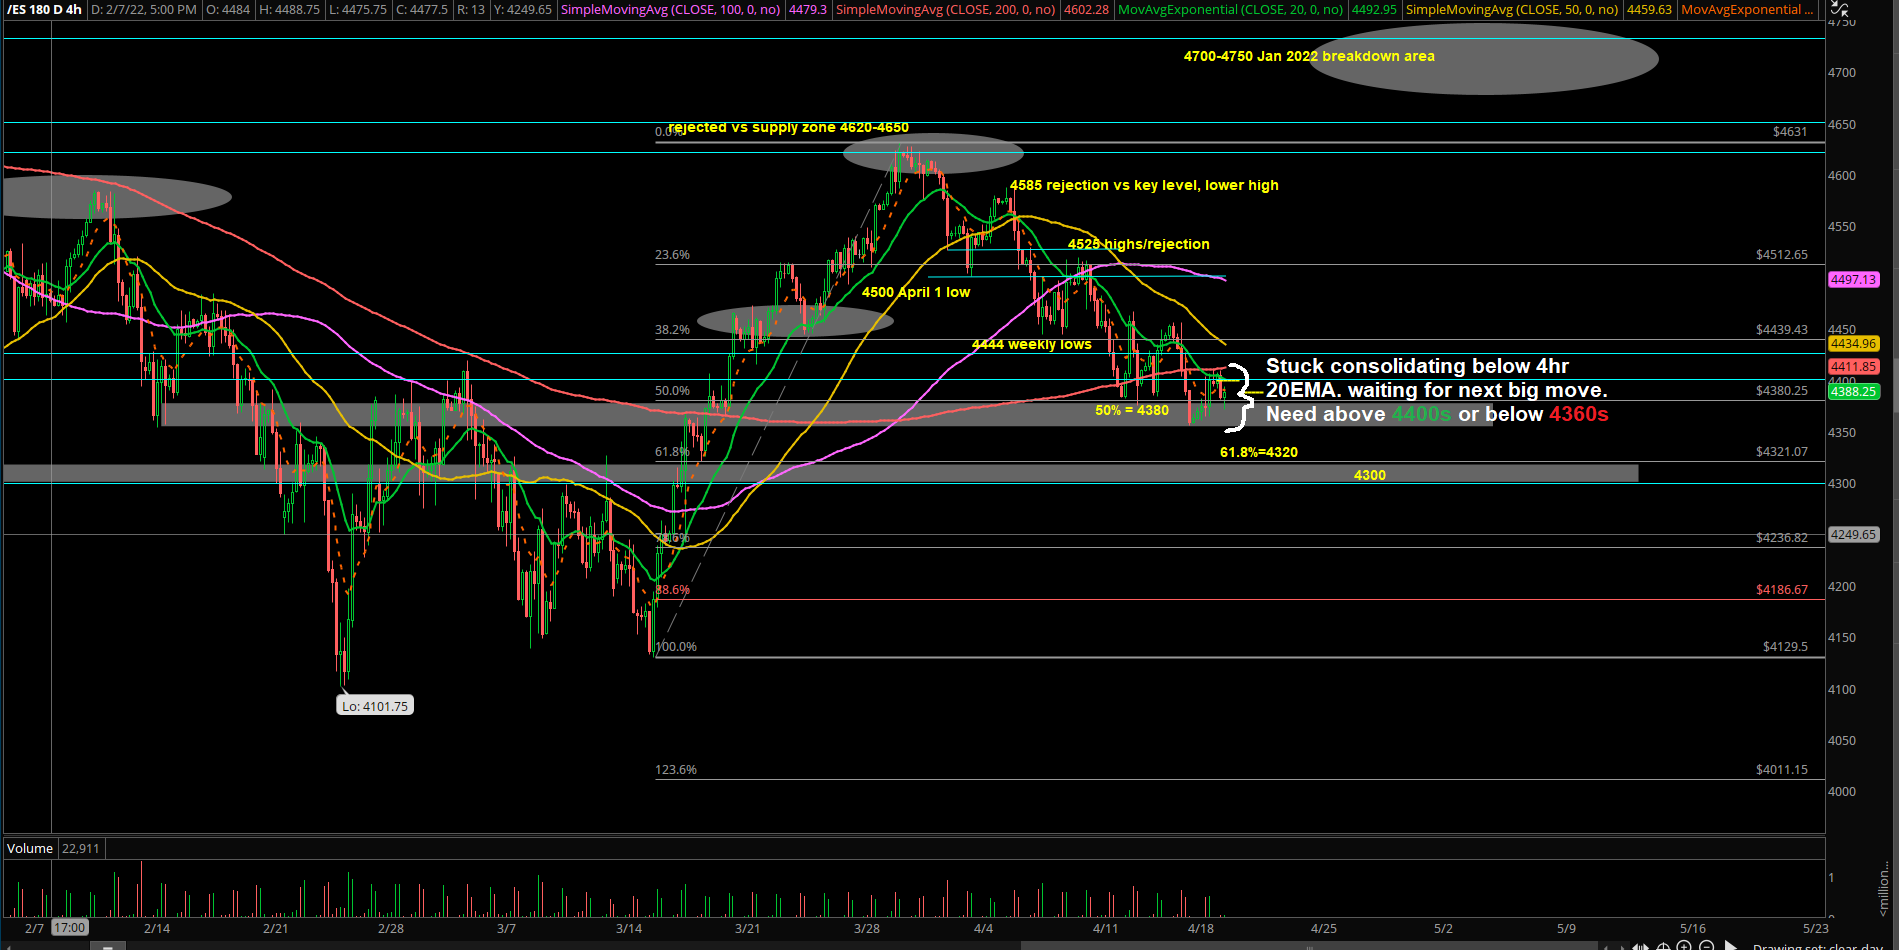
Price is trending below DAILY 20EMA (main trend), and the shorter term has been getting rejected vs 4HR 20EMA resistance every time.
Current parameters:
- Overnight range = 4411-4371, current price = 4391. Market about to open as flat vs yesterday’s close. Indecision/consolidation
- Price is hovering around the 4380 (50% retracement of the March-April monthly ranges)
- Short-term bears remain in favour. Price is trending below daily 20EMA with no confirmed indications of temporary bottom in place at the moment. If you recall, yesterday’s session provided a double bottom off 4365, prices attacked 4400s area for 4 times. Eventually, overnight broke into 4411 highs, but ultimately buyers momentum couldn’t sustain and head into the higher targets of 4425/4444+
- Zooming out to the weekly range, 4350/4320 are key supports/on-trend targets for bearish momentum since last week. If price keeps staying below 4400 and with an immediate break below overnight low of 4371, then we expect continuation into the aforementioned bearish targets
- Conversely, bulls are running out of time given last week’s context, they must provide a daily close above 4425/4444. The latter level represents recent swing high area + trending daily 20EMA resistance + April 4th weekly lows
Three main scenarios for today:
- 1) Stay below 4400s immediate res, break ONL 4371, then attempt 4350 target again, level by level approach. 4320 may open up by then if trend day movement
- 2) Recapture 4400s quickly, open 4425/4444 resistances for trend day possibility
- 3) 4410s-4370s, trappy range day, whip both directions
Execution Adjustments:
- Market has been about rangebound trading lately and our style has suffered given the inherent momentum vs rangebound style differences.
- We need to adjust entry-exit parameters into key levels only and focus more on risk vs reward. Need to be able to fill orders at the intraday range extremes.
- Eg. Monday April 18, range between 4403 and 4365, had multiple opportunities to play the session
- In this environment, harder to chase entries with our previous main momentum setups of higher lows/lower highs because bulk of the potential move/profits is settled already
- Level by level approach, keep it simple stupid
- Gameplan is great, but execution is key, adapt in real-time with the flow. Be water
Bigger picture:
Ongoing short-term bear trend below daily 20EMA. Daily closing prices need to ultimately remain below 4425/4444 in order to keep downside pressure going. The 50% fib retracement of March has been fulfilled at 4380s. Next logical target would be the 4350/4320 area, the latter being 61.8% retracement. (Sunday overnight lots = 4355s)
For bulls to reverse this short-term downtrend, needs a daily close above 4425 (prior couple session’s high area +trending daily 20EMA) for initial confirmation of some sort of range low being in place and having a reference point. This must be followed quickly by a breakout above 4444. Otherwise, we cannot see a sticksave in place because the April 11th week played out as a bearish continuation model. Level by level approach, we cannot revisit 4500-4520 or above without first reclaiming some key resistances.
Also, important to keep an eye on NQ 13800-13850 major support area, higher timeframe buyers may show up and defend this region for a bigger sticksave/bounce. A lot of megacap/tech stocks at an important juncture as well and acting fairly weak. This could change with a +2% trend day up session quickly as we’re starting to see early indications of a temp bottom setups across many important stocks (price has not confirmed/turned yet)
In addition, NQ key resistance for this week is 14280, which represents the high area of past few sessions. Downtrend pressure continues until this level is recaptured on a daily closing basis. (roughly 2-2.5% away from current price os 13930s)
Based on overall context, we’re leaning more towards a temp range low/weekly low for ES+NQ so need to be careful of being overly confident on the bearish side here. Remember, zero confirmation at the moment because of the daily closing prints needed. Just need to be adaptable here because if price action keeps cascading down with lower highs and lower lows on the daily chart, then we have a lot more points to fall before the ES 4100-4200s/NQ 12900-13000s range low. (100% retracement area)