Market Analysis for Apr 8th, 2022
 By
Ricky Wen
By
Ricky Wen
Friday April 8 Gameplan
(could skip to Current Parameters section for actionable part, but context is king)
Context section:
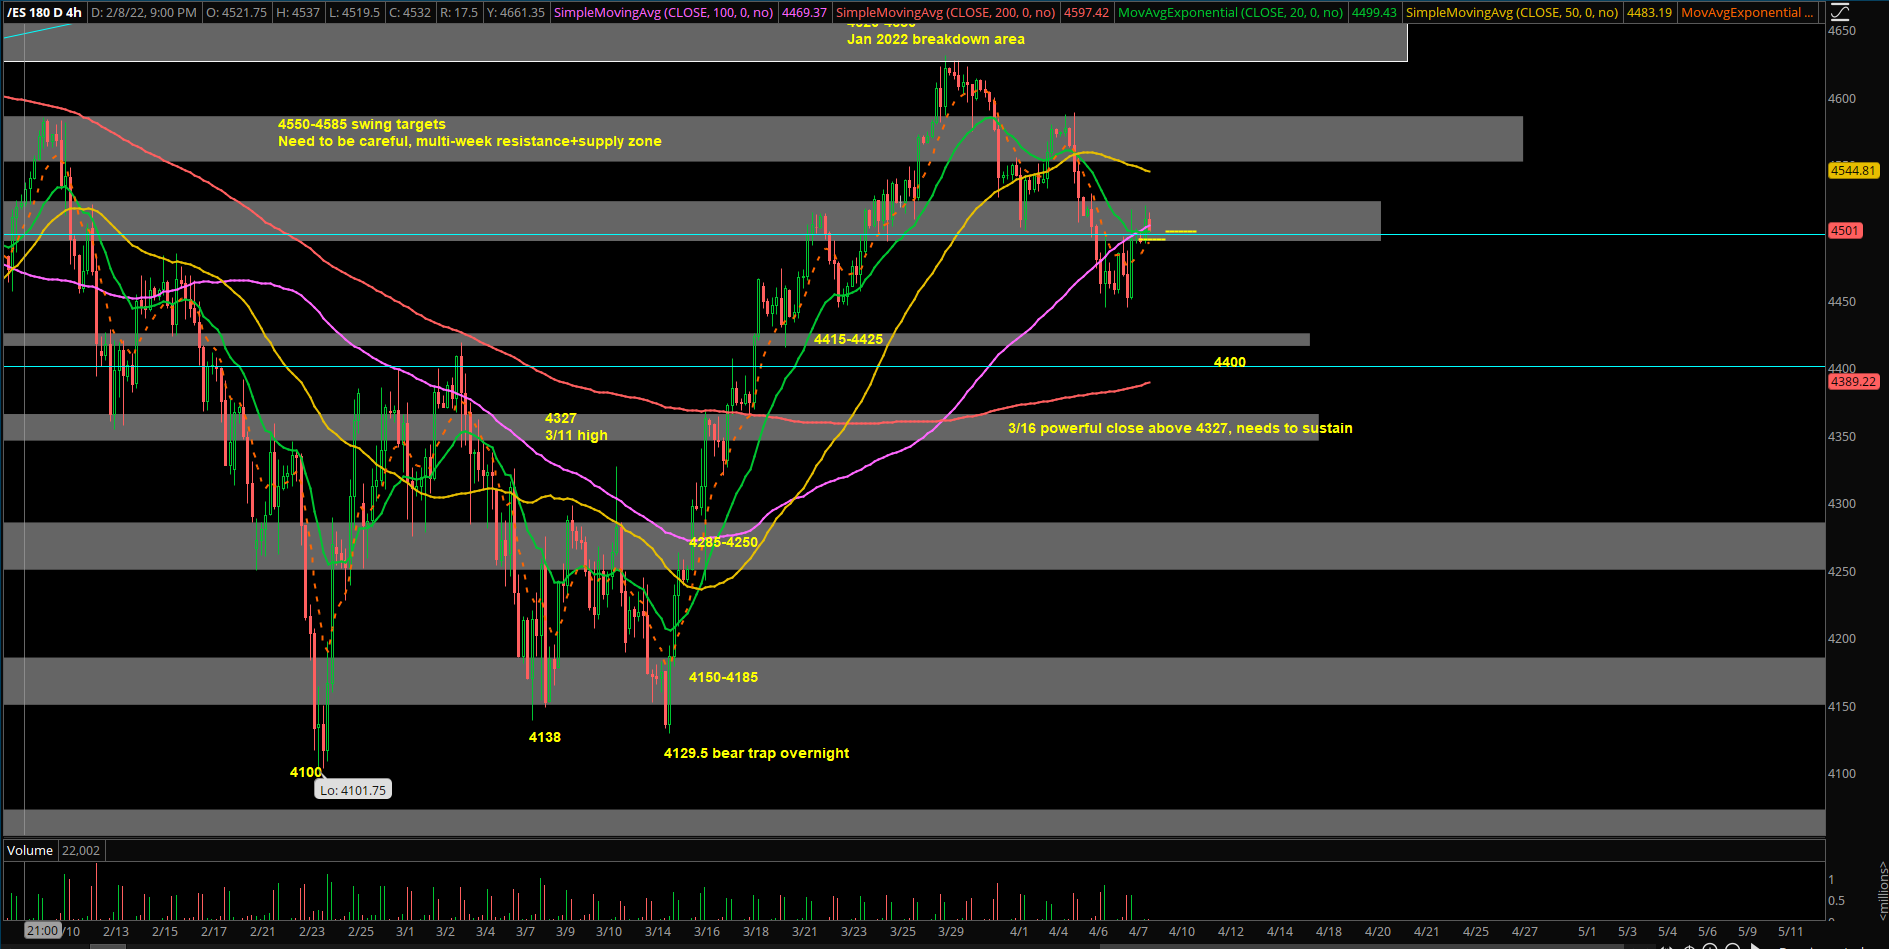
- Ongoing downtrend below the daily 20EMA since mid Jan 2022 breakdown of 4650
- Initial capitulation was observed on Thursday Feb 24th with tech V-shape bottom by 10AM, further confirmed with the strong DAILY close across the board via ES NQ +AAPL+AMZN+GOOGL+TSLA+MSFT…etc. However, no follow through for past 2.5 weeks
- March 7 weekly price action 4327-4138 was an inside week within the massive Feb 21 week boundaries of 4391-4100
- Overall, markets and key tech stocks remain weak and heavy, prices could not reclaim above their respective downtrending daily 20EMA resistances yet. No confirmation of any potential climax, but base building/accumulation phase looks decent for now
An change of scenery since Weds March 16th confirmation:
- FOMC March 16 price action confirmed an initial daily bottom given the follow through into 4350 highs. It was a decisive close above daily 20EMA+last week’s high
- In addition, March 16th, a key number of tech+megacap stocks had showcased their respective DAILY swing bottom setups with great risk vs reward. First time in about 2 months so let’s see if the overall market can build upon this. Know your timeframes!
- For he past 3 weeks, market bounced from our 4150-4185 key support into 4550-4585 swing target, market went according to expectations
- FYI, the entire range from March lows-highs has been 4130-4631 so it’s been ping pong within the overall 550pts rangebound market of this year (4650-4100)
- Overall, we remained prudent and proactive going into the final week of Q1 and was able to trim down a lot of profits with the market strength into the highs of respective tickers that we were trading at the time. Fairly textbook rotations, netting an average gain of +11.68% portfolio approach in 12 sessions via our best in breed names
- Going into the first week of Q2, the main question we have to ask: whether the expected minimum 2-3% dip is enough before another attempt at 4650 or beyond.
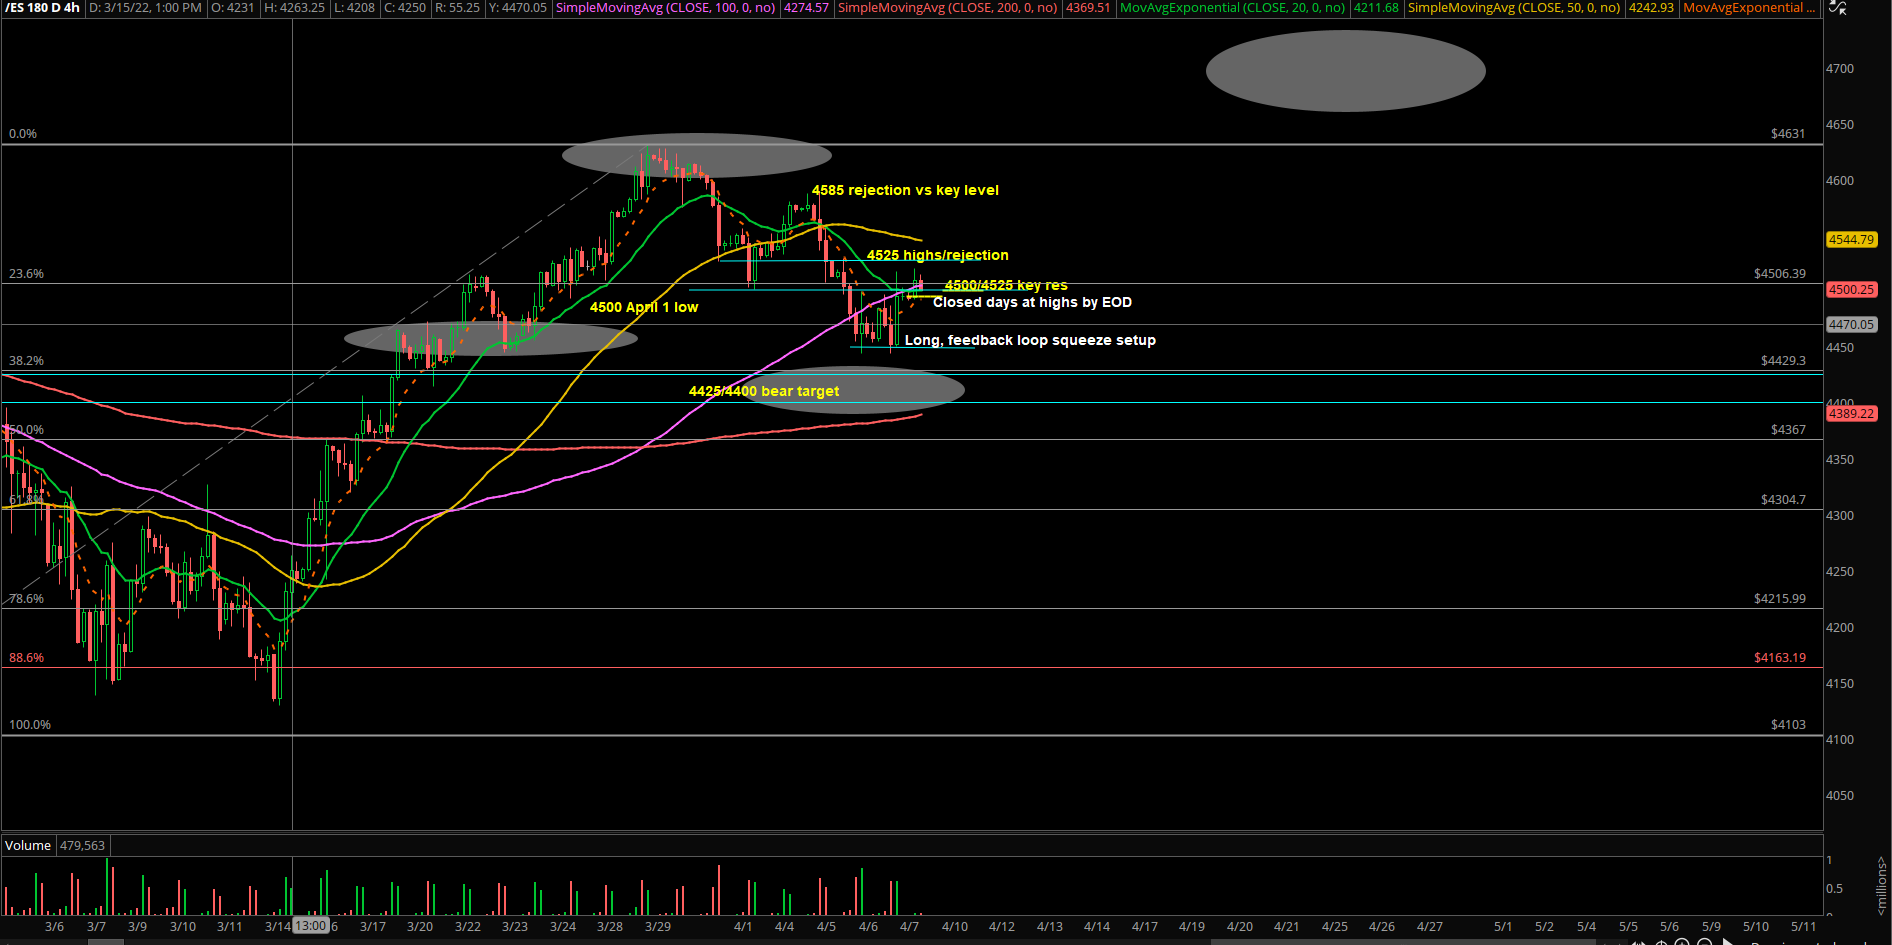
- If you recall, we’ve operated a short-term bearish bias that price action will not go beyond the 4620-4650 multi-month supply zone on first try basis. In reality, the market rejected at 4631 highs last week and dropped 2.5% into a low of 4500s where we took profits during Friday morning and started our weekend early
- Tuesday April 5th confirmed our bearish primary scenario. Price action was rejected twice at 4585 and then got sold for the entire session before settling into EOD lows at 4525 (Monday’s low). NQ also broke below our pre-determined 14950-15000 support zone and stayed below
- NQ Tues 4/5 was -2.2% on the day, erased all of Monday’s +2% gains, confirmed a massive bull trap + daily bearish engulfing
- Wednesday April 6th played out as a continuation day, ES -1% and NQ -2.2%.
- In addition, ES+NQ closed slightly below their respective daily 20EMA trending supports, waiting for the next decisive move. Bears have the ball right now given this week’s context
- Thursday April 8th, price action got rejected vs our key level of 4485 after the RTH open, then tried for the bearish continuation model into lower lows of Wednesday’s huge support zone of 4455-4444. In essence, bears had 1 job to do and that was to break support, but they failed miserably.
- If you recall, we accumulated longs into the day’s lows for a potential feedback loop squeeze setup back into 4500/4520 targets. Essentially, we foresaw the bear trap/failure before it occurred because there were no strong sellers in the morning.
- In reality, price action did a double bottom at 4444 and flew back into 4500s with an intraday high of 4517. We captured 50~ points profit and now waiting for next train ride
Current parameters:
- If you recall, bears failed to break below 4455-4444 key support and therefore failed to hit our 4425/4400 weekly bearish targets. When one side fails, we look the other way immediately… bulls took over and ran it to 4500/4520 targets by end of the day
- O/N range = 4520-4492, market about to OPEN just above yesterday’s closing price. Current price = ES 4507s/NQ 14560s, high level bullish consolidation during overnight
- This indicates we need to be aware of a potential immediate continuation model into 4525/4535/4550, this is especially valid when price remains above 4492
- Our primary concern/thesis for today is that we’re just going to have another range/inside day = 4520-4485 or 4520-4492 stuckfest. Limited upside and downside
- Bulls need to break above 4520 quickly after RTH open to entice buyers for a potential trend-up day. Basically, a day#2 of yesterday’s V-shape recovery.
- Conversely, if 4492 fails quickly after the RTH open, be aware of immediate backtest into 4485/4474/4465/4455 area
- Gameplan is great, but real-time flow of the market+execution is key. Be water, adapt!
Bigger picture:
The rally from 4100s to 4600s has played out in a V-shape recovery mode which was not surprising given our reports from the past 2-3 weeks.
If you recall, we had a major support zone of 4150-4185 alongside with the Feb lows at 4100. Then, the change of scenery/higher lows confirmation that came on 3/16 FOMC with ES price action’s DAILY closing at 4350~. As demonstrated in real-time, during 3/16, we managed to scoop up 8 best in breed names at the lows when ES backtested the pre-determined intraday 4250-4285 support where ES bottomed at 4242 and closed at 4350! Also, played some longs on indices and VX/vol collapse shorts. Now, market is back to top end of the range so need to be careful, won’t be as easy imho.
- A daily close above 4525 is first step to becoming a full fledged bull targeting 4620-4650. In this scenario, it would eventually open up 4700+ for continuation on-trend model. In this particular case, we would want to see NQ keep leading the market higher and then small caps/RTY/IWM rotations start outperforming as well. (eg. massive bull daily hammer/reversal pattern)
- A daily close below 4525, you need to be very careful of a quick liquidation break into 4425/4400 or much lower given the context of this year has been spent in a 550~ point range (4650-4100). That’s a massive 12-13% rangebound market that could wipe out many accounts!
- As of writing on 4/8 morning, price action is sitting right above DAILY 20EMA. Current price = 4500s. Ongoing double bottom from 4444 so we’re mostly in neutral mode + slight edge for intraday bulls if support holds. Wait and see.
- Lastly, the most important thing that occurred yesterday was the daily close back ABOVE the trending DAILY 20EMA. This means that the chart is still reacting to the recent change of trend up from 4100s into 4600s. It also means that, the recent 4444 low has potential to be a multi-day swing low. *unconfirmed (needs >4525 close)
- Ask yourself: (1) can price hold yesterday’s momentum and sustain to setup higher lows+higher highs next week back into 4585/4620+ vs. (2) we have unfinished business to our original 4425/4400 weekly bear targets
There are multiple different timeframes in this report, know which one you are operating and executing on. Very different gameplans and goals, know yourself.
What are the key levels to be aware of?
- Resistances 4500, 4525, 4535, 4550, 4565, 4585, 4600, 4620, 4640, 4650, 4685, 4700, 4713, 4728, 4740, 4750,
- Supports 4500, 4485, 4473, 4455, 4445, 4425, 4415, 4400, 4385, 4375, 4365, 4350, 4348, 4335, 4325, 4300, 4285, 4250, 4238, 4225, 4212 4200,4185, 4165, 4150, 4100, 4080, 4050, 4000, 3980