Market Analysis for Apr 4th, 2022
 By
Ricky Wen
By
Ricky Wen
Monday April 4 Gameplan
Context section:
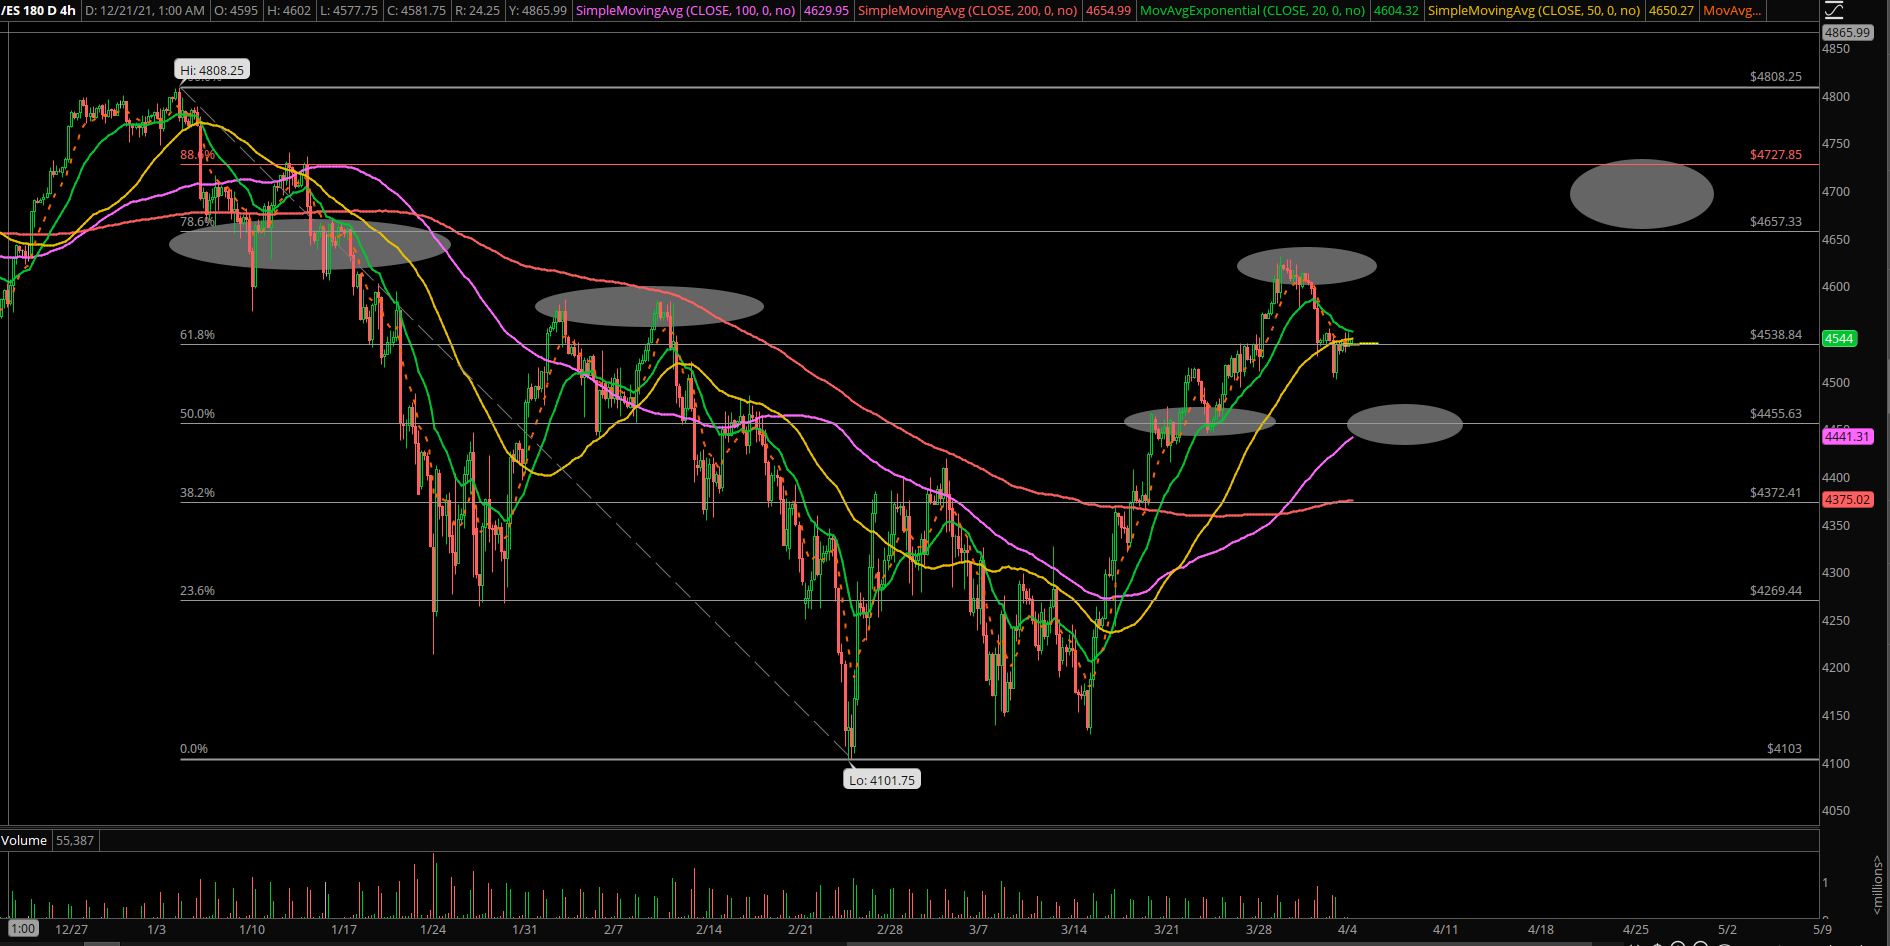
- Ongoing downtrend below the daily 20EMA since mid Jan 2022 breakdown of 4650
- Initial capitulation was observed on Thursday Feb 24th with tech V-shape bottom by 10AM, further confirmed with the strong DAILY close across the board via ES NQ +AAPL+AMZN+GOOGL+TSLA+MSFT…etc. However, no follow through for past 2.5 weeks
- March 7 weekly price action 4327-4138 was an inside week within the massive Feb 21 week boundaries of 4391-4100
- Overall, markets and key tech stocks remain weak and heavy, prices could not reclaim above their respective downtrending daily 20EMA resistances yet. No confirmation of any potential climax, but base building/accumulation phase looks decent for now
An change of scenery since Weds March 16th confirmation:
- FOMC March 16 price action confirmed an initial daily bottom given the follow through into 4350 highs. It was a decisive close above daily 20EMA+last week’s high
- In addition, March 16th, a key number of tech+megacap stocks had showcased their respective DAILY swing bottom setups with great risk vs reward. First time in about 2 months so let’s see if the overall market can build upon this. Know your timeframes!
- For he past 3 weeks, market bounced from our 4150-4185 key support into 4550-4585 swing target, market went according to expectations
- FYI, the entire range from March lows-highs has been 4130-4631 so it’s been ping pong within the overall 550pts rangebound market of this year (4650-4100)
- Overall, we remained prudent and proactive going into the final week of Q1 and was able to trim down a lot of profits with the market strength into the highs of respective tickers that we were trading at the time. Fairly textbook rotations, netting an average gain of +11.68% portfolio approach in 12 sessions via our best in breed names
- Going into the first week of Q2, the main question we have to ask: whether the expected minimum 2-3% dip is enough before another attempt at 4650 or beyond.
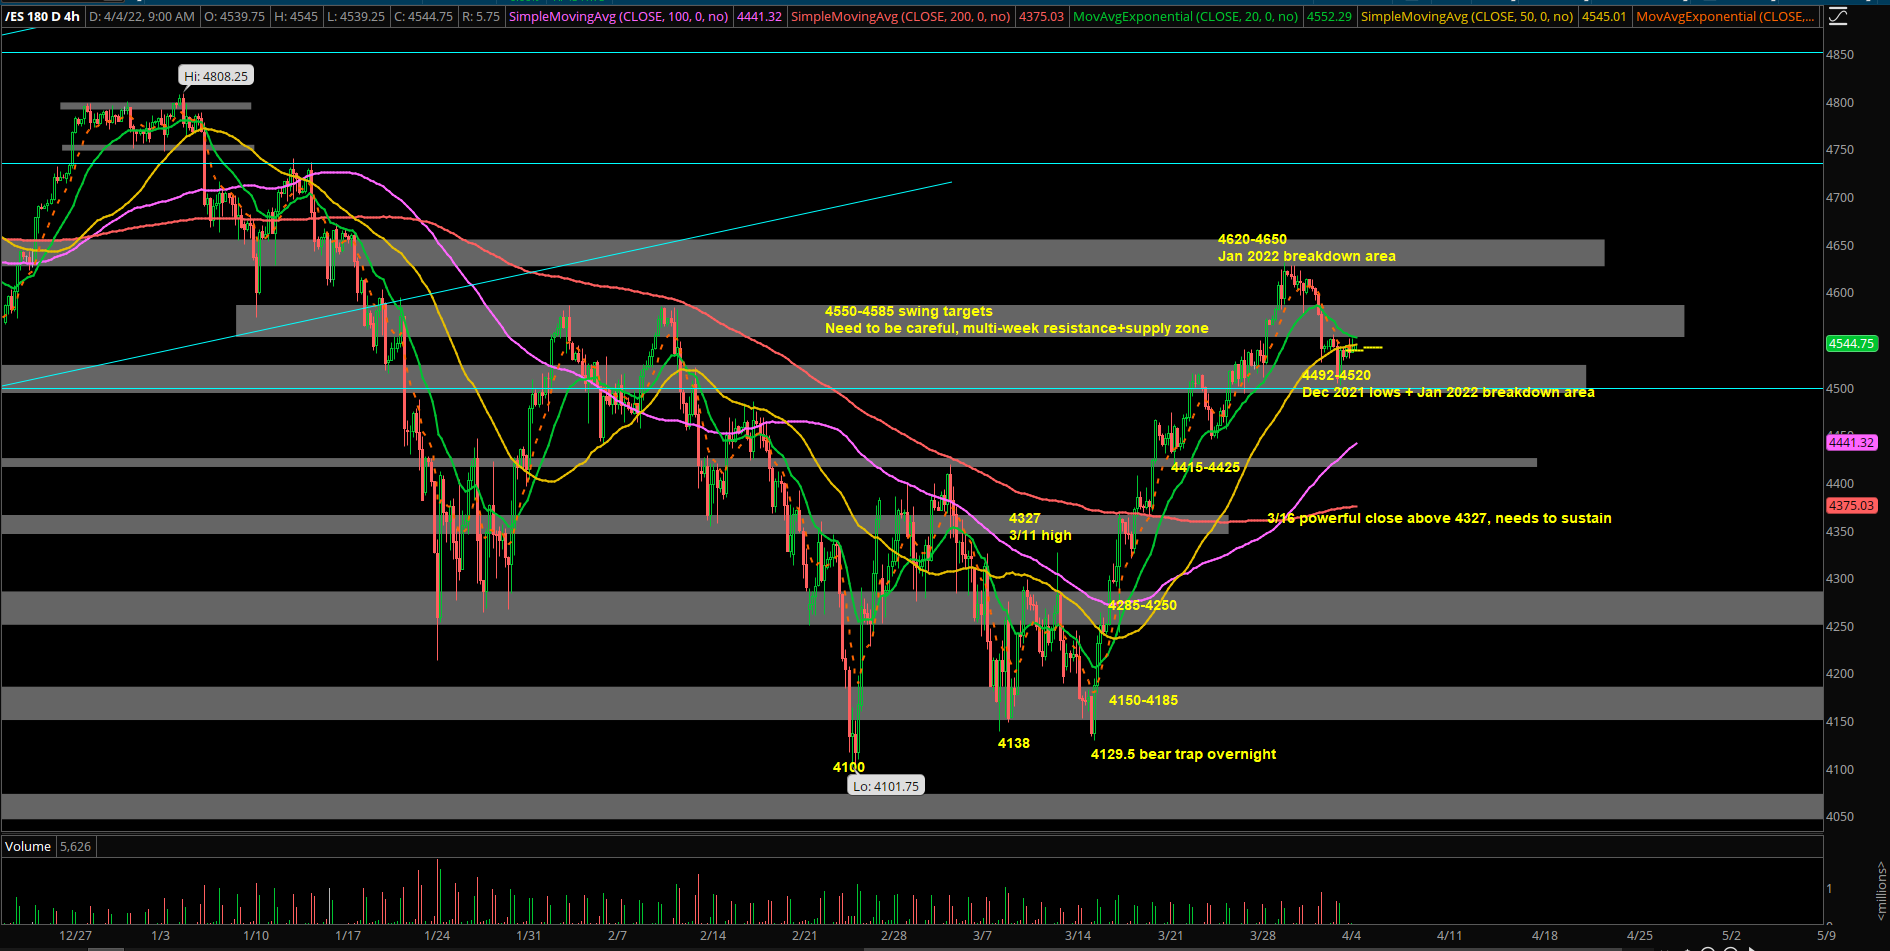
- If you recall, we’ve operated a short-term bearish bias that price action will not go beyond the 4620-4650 multi-month supply zone on first try basis. In reality, the market rejected at 4631 highs last week and dropped 2.5% into a low of 4500s where we took profits during Friday morning and started our weekend early
Current parameters:
- Overnight range = 4551-4527, super tight consolidation as market waits for price action to get out of this horizontal consolidation range and give a decisive winner
- Primary scenario: expecting rallies into 4565/4585 to be sold this early week, look for sell setups in this case given our short-term bearish bias since 4620s rejection
- 2nd scenario: an intraday or DAILY break below 4500 immediately opens 4485/4450/4400 for a level by level approach. Then, bigger sell setup potential into effect. Be mindful of bears coming out in full force for a deadly assault
- Final scenario, a daily close back above 4585 would confirm 4500 low is likely it for now and market is getting ready to attack 4620-4650 again where the latter number is critical for bigger picture. Focus on BTFD opportunities if so. See more in next section
Bigger picture:
The rally from 4100s to 4600s has played out in a V-shape recovery mode which was not surprising given our reports from the past 2-3 weeks.
If you recall, we had a major support zone of 4150-4185 alongside with the Feb lows at 4100. Then, the change of scenery/higher lows confirmation that came on 3/16 FOMC with ES price action’s DAILY closing at 4350~. As demonstrated in real-time, during 3/16, we managed to scoop up 8 best in breed names at the lows when ES backtested the pre-determined intraday 4250-4285 support where ES bottomed at 4242 and closed at 4350!
- A daily close above 4585 is first step to becoming a full fledged bull targeting 4620-4650. In this scenario, it would eventually open up 4700+ for continuation on-trend model
- A daily close below 4500, you need to be very careful of liquidation break into 4400 or much lower given the context of this year has been spent in a 550~ point range (4650-4100). That’s a massive 12-13% rangebound market that could wipe out many accounts!
FWIW, S&P 500 April seasonality has been historically quite bullish with an avg return of +2.4% for the past 20 years with a 80% win rate. Keeping our minds open if price action starts to confirm on whichever scenario the market clues us into. Very different timeframes in various sections of this report, know your own timeframes and execution ruleset. KISS.
What are the key levels to be aware of?
- Resistances 4550, 4565, 4585, 4600, 4620, 4640, 4650, 4685, 4700, 4713, 4728, 4740, 4750,
- Supports 4550, 4535, 4520, 4500, 4485, 4473, 4450, 4445, 4425, 4415, 4400, 4385, 4375, 4365, 4350, 4348, 4335, 4325, 4300, 4285, 4250, 4238, 4225, 4212 4200,4185, 4165, 4150, 4100, 4080, 4050, 4000, 3980