Market Analysis for Jun 1st, 2021
 By
Ricky Wen
By
Ricky Wen
E-mini S&P 500 Futures: Keep It Simple Stupid – Déjà vu, Another All Time Highs Attempt
Copying and pasting a section from our ES trade alert room’s premarket gameplan report. FYI, the ES trade room provides real-time entries and exits with pre-determined stoploss and target levels alongside with real-time lessons on strategy/risk management/psychology/momentum. We specialize in quick intraday alpha setups and short-term swings with duration of 2-5 days holding period. (some key levels + strategies have been redacted for fairness to subscribers)
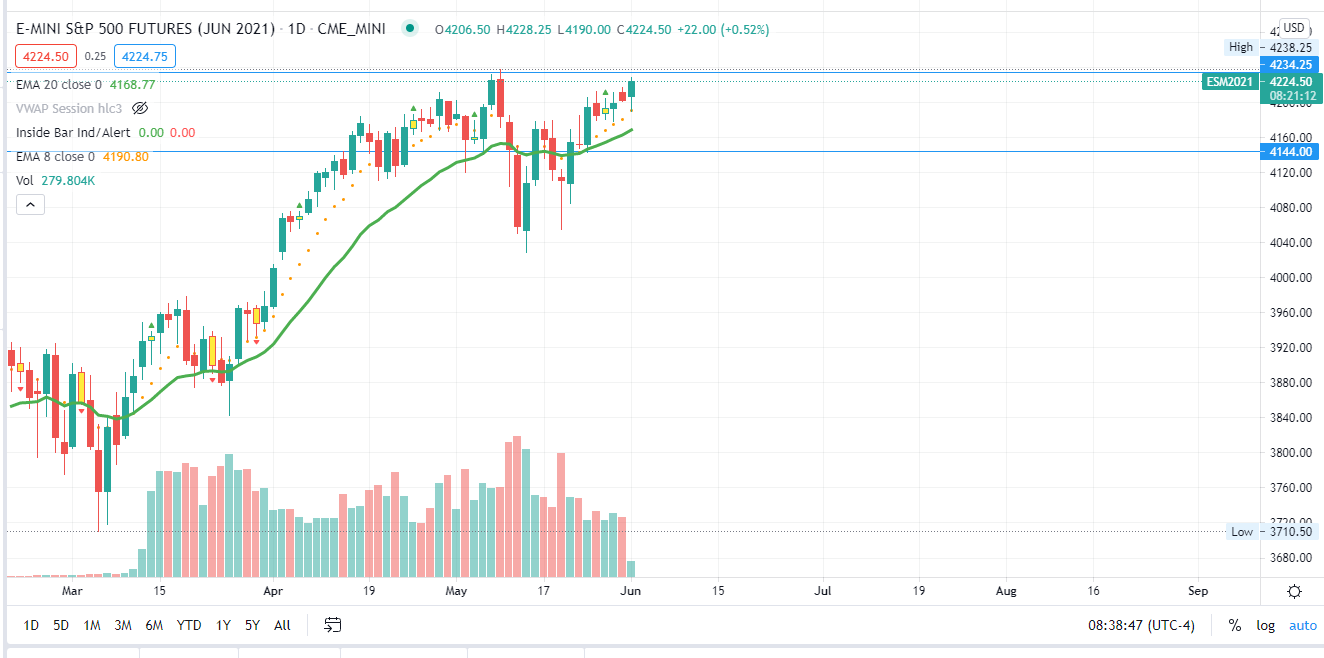
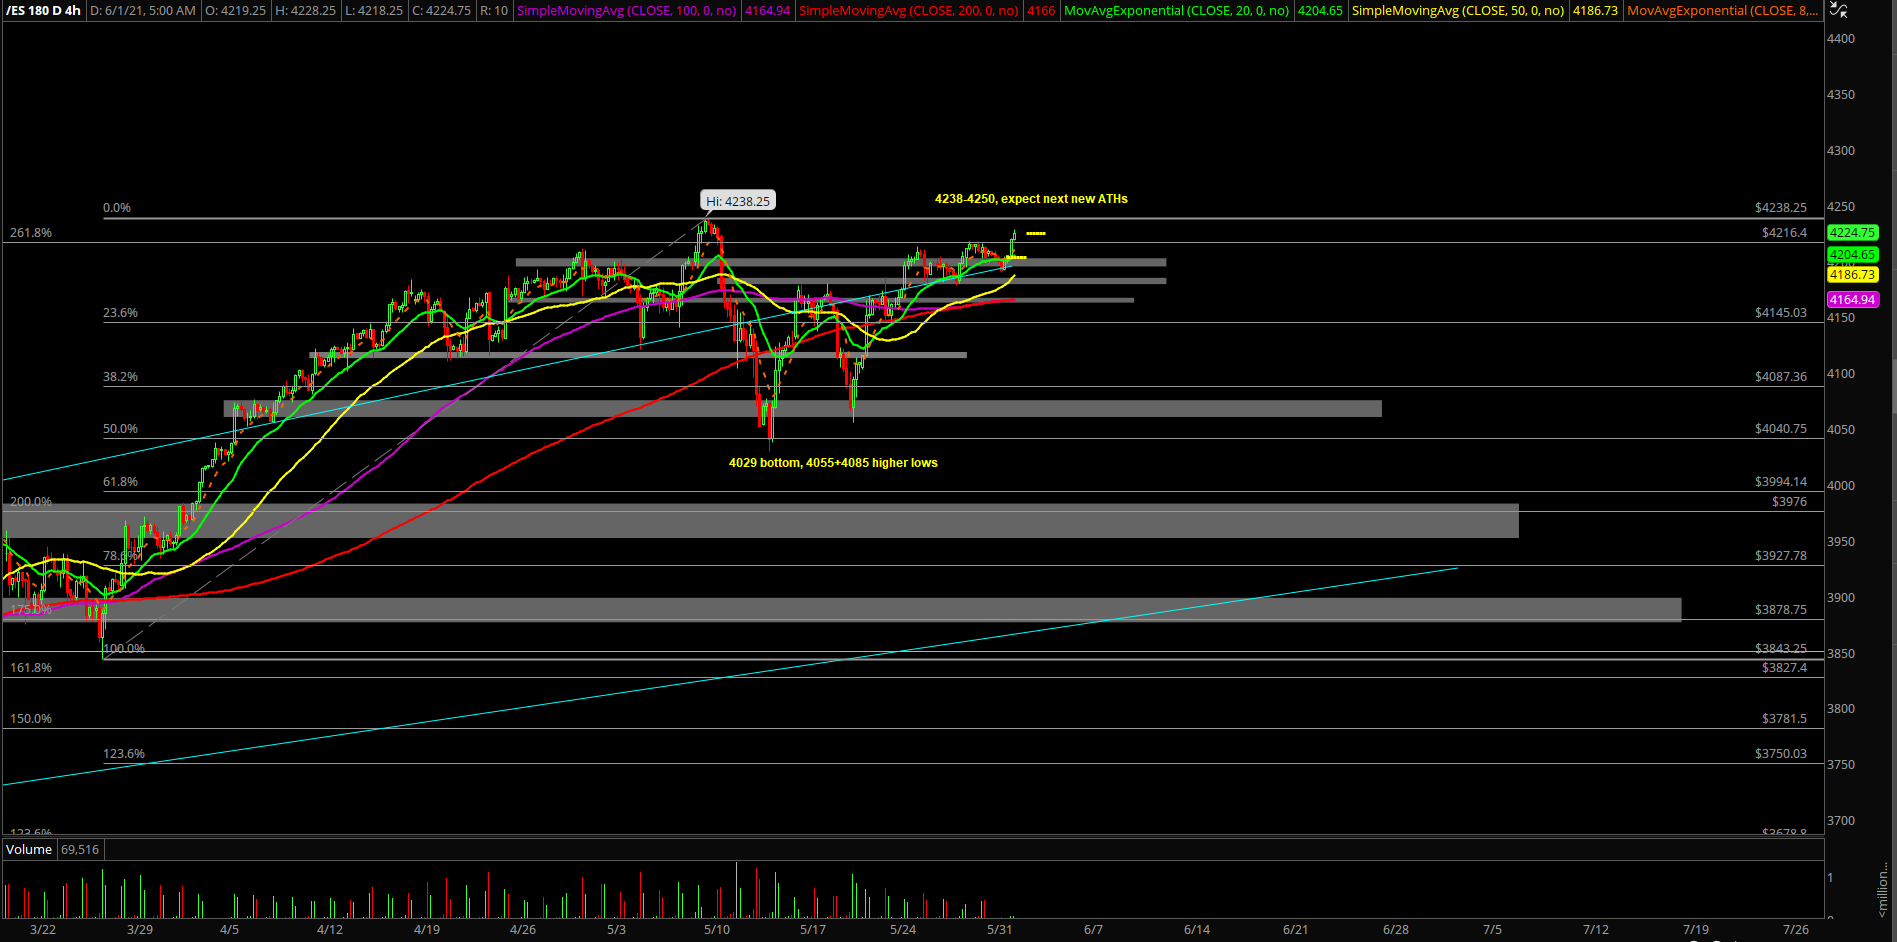
- Last week closed at 4203.25 as a weekly bullish breakout formation vs. the prior week’s 4185-4055 range. This meant that price action was expected to gap up after the long weekend and accelerate towards our 4230-4250 target
- As o writing, action hovering at 4225 which is the lower end of the target zone so bulls cannot let loose and must continue their breakout
- We maintain the same basis going into this week+June; ES 4238-4250 target when above our key trending supports, every dip is an opportunity given the clear risk vs reward for the next 5-10 sessions. If below supports, adapt or die as price action is dynamic not static
- If/when 4238/4250 targets get fulfilled, then we move onto 4280/4300/sky is the limit
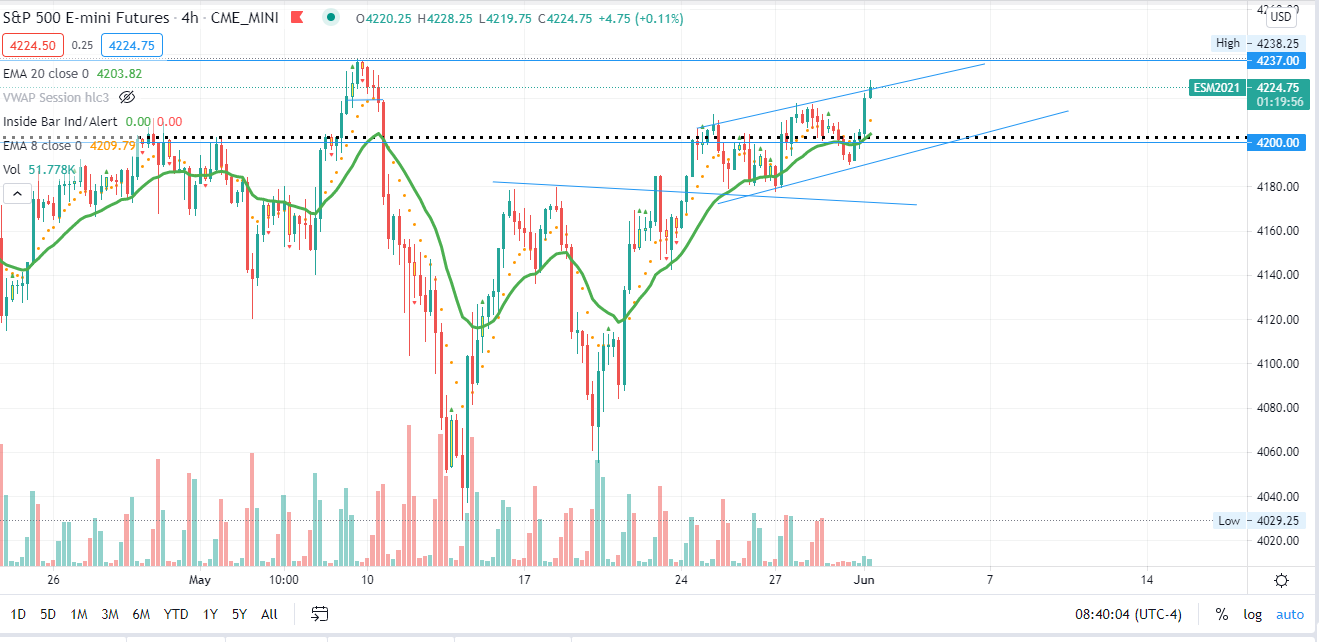
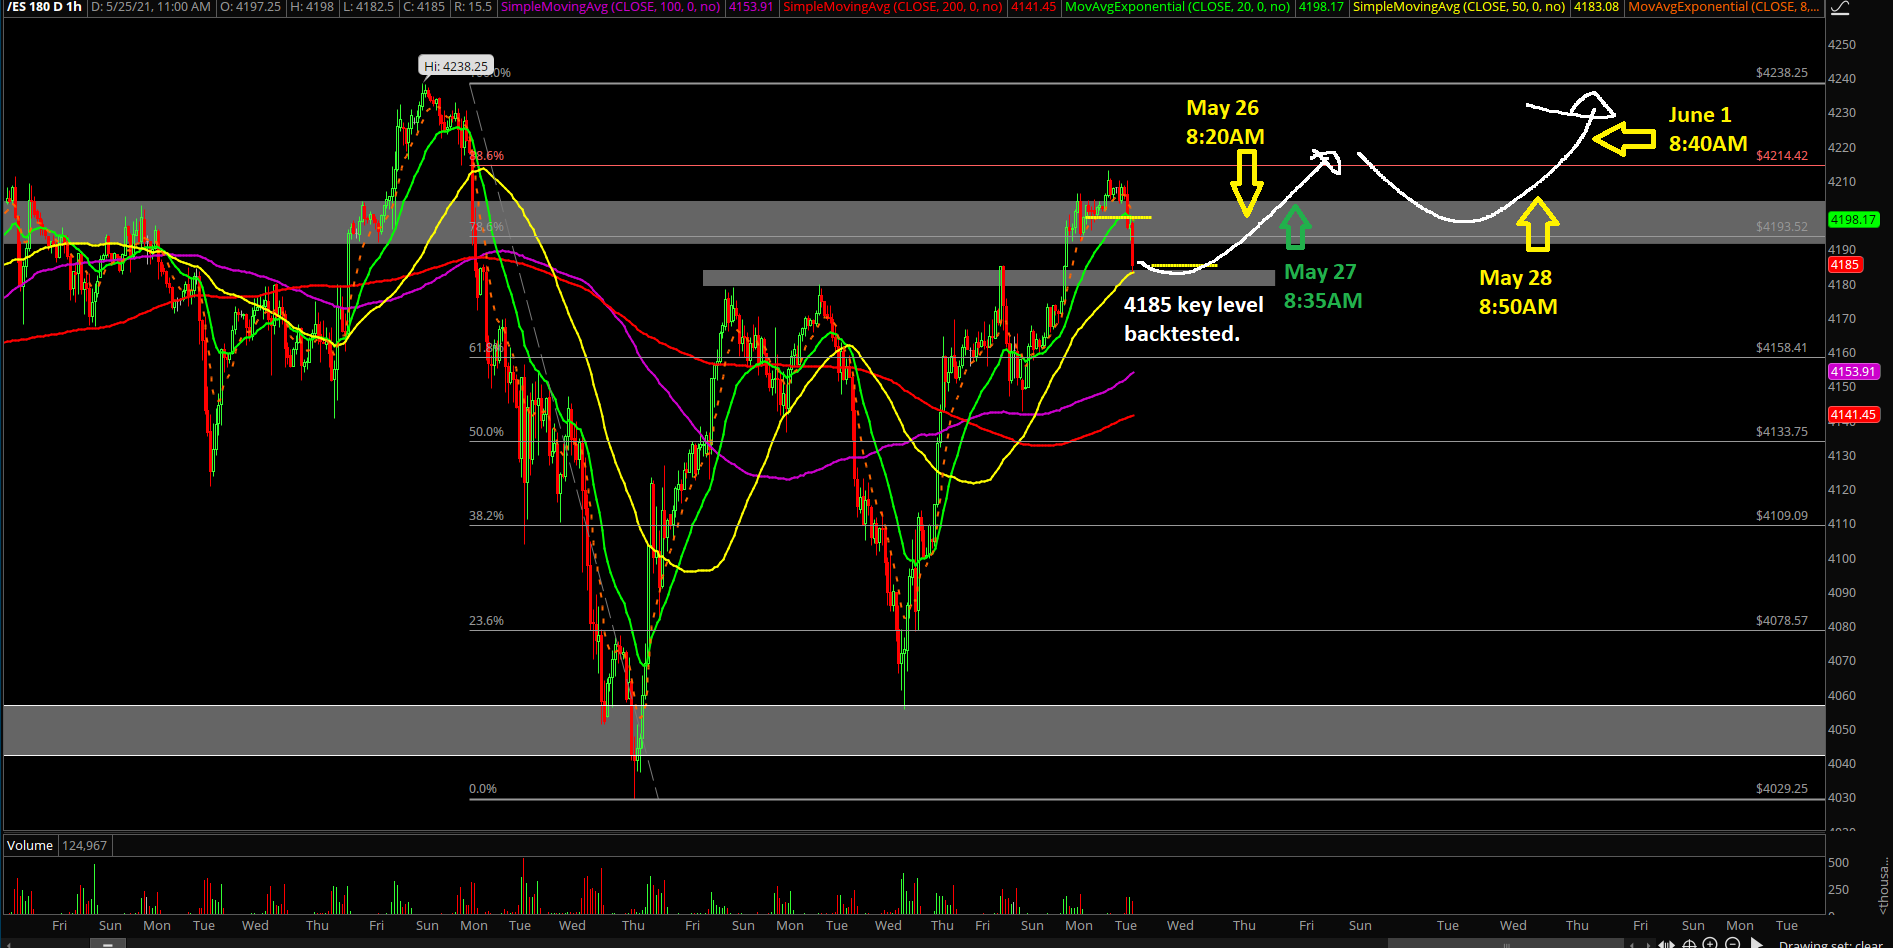
- Overall, zero surprises for now as price action continues to follow our 1hr white line projection chart perfectly from last week. Subject to change, adapt accordingly
- Again, ES+NQ have formed their multi-day/week low given the context of ES 4029 vs 4055 lows and NQ 12915 vs 12954. We remain long and strong when above trending immediate supports
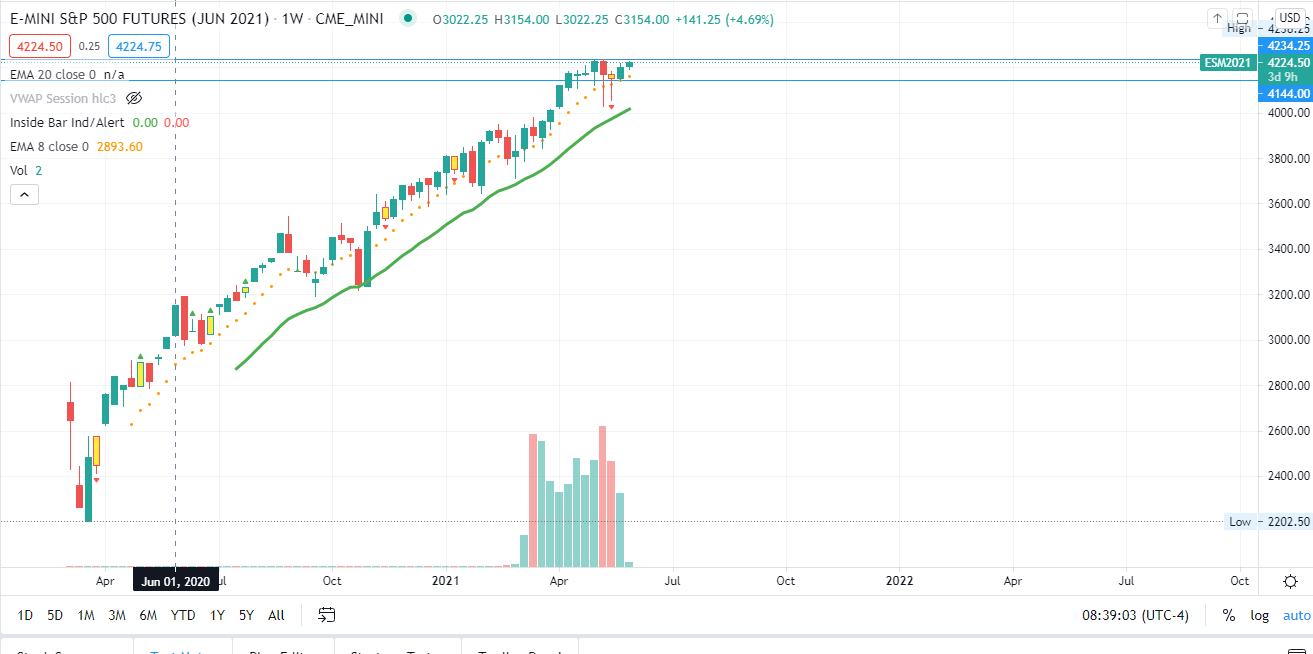
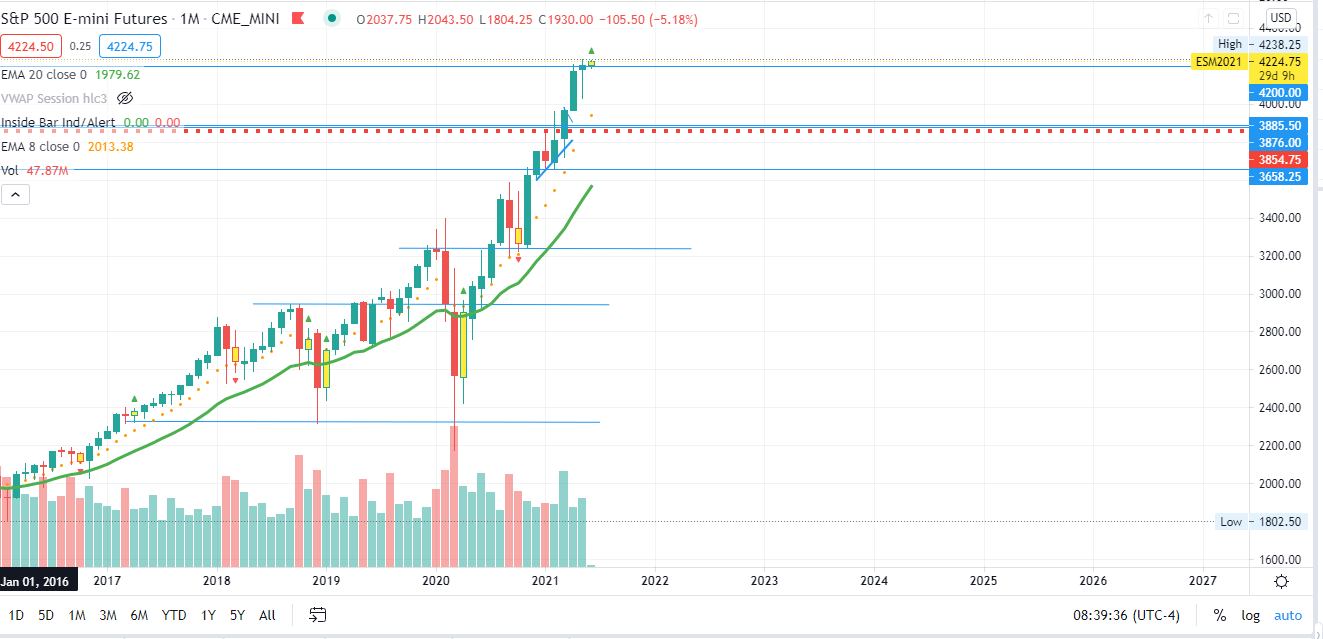
- Bigger picture wise, month of May was just a consolidation setup in a massive bullish trending monthly context. It’s resting/digesting before the market attempts higher highs into rest of this year (when above 3965 SHTF). Pull up our/your monthly chart and you can clearly see it.
Bonus note from prior reports: RTY/small caps may be playing catch up as we noted in real-time via Monday May 24th setup, see if it confirms an acceleration today/tomorrow.
Need to see >2245 to fast forward towards 2300+. Otherwise, more consolidation/basing pattern and need more time (May 25th broke above 2245, but couldn’t sustain…now May 27th hovering around 2250s premarket…acceleration attempt!)
Now, May 28th as of writing, price action hovering at 2280s, train ride heading into destination
Now, June 1st as of writing, price action basing and hovering at 2290s, ready to head into 2300+
Additional context from past months remain mostly unchanged (copied and pasted):
- The shit hits the fan (SHTF) level has moved up to 3965 from 3650, a daily closing print below 3965 is needed in order to confirm a temp top setup/reversal for the daily+weekly timeframe. (the current April 2021 lows which was the breakout acceleration point of the past few weeks)
- A break below 3965 would be a strong indication of weakness given the multi-week trend of being above the daily 20EMA train tracks. For reference, the first week of April, the price ation has accelerated on top of the daily 8EMA to indicate that the bulls are in full control and continuously making higher lows and higher highs every couple sessions bottomed
- Different timeframes in this report so it may be overwhelming, make sure you know which timeframes you are participating and adjust gameplan + execution accordingly