Market Analysis for May 24th, 2021
 By
Ricky Wen
By
Ricky Wen
E-mini S&P 500 Futures: Keep It Simple Stupid – Inside Week Confirmed Stabilization, Route Into New ATHs Part 2
Copying and pasting a section from our ES trade alert room’s premarket gameplan report. FYI, the ES trade room provides real-time entries and exits with pre-determined stoploss and target levels alongside with real-time lessons on strategy/risk management/psychology/momentum. We specialize in quick intraday alpha setups and short-term swings with duration of 2-5 days holding period. (some key levels + strategies have been redacted for fairness to subscribers)
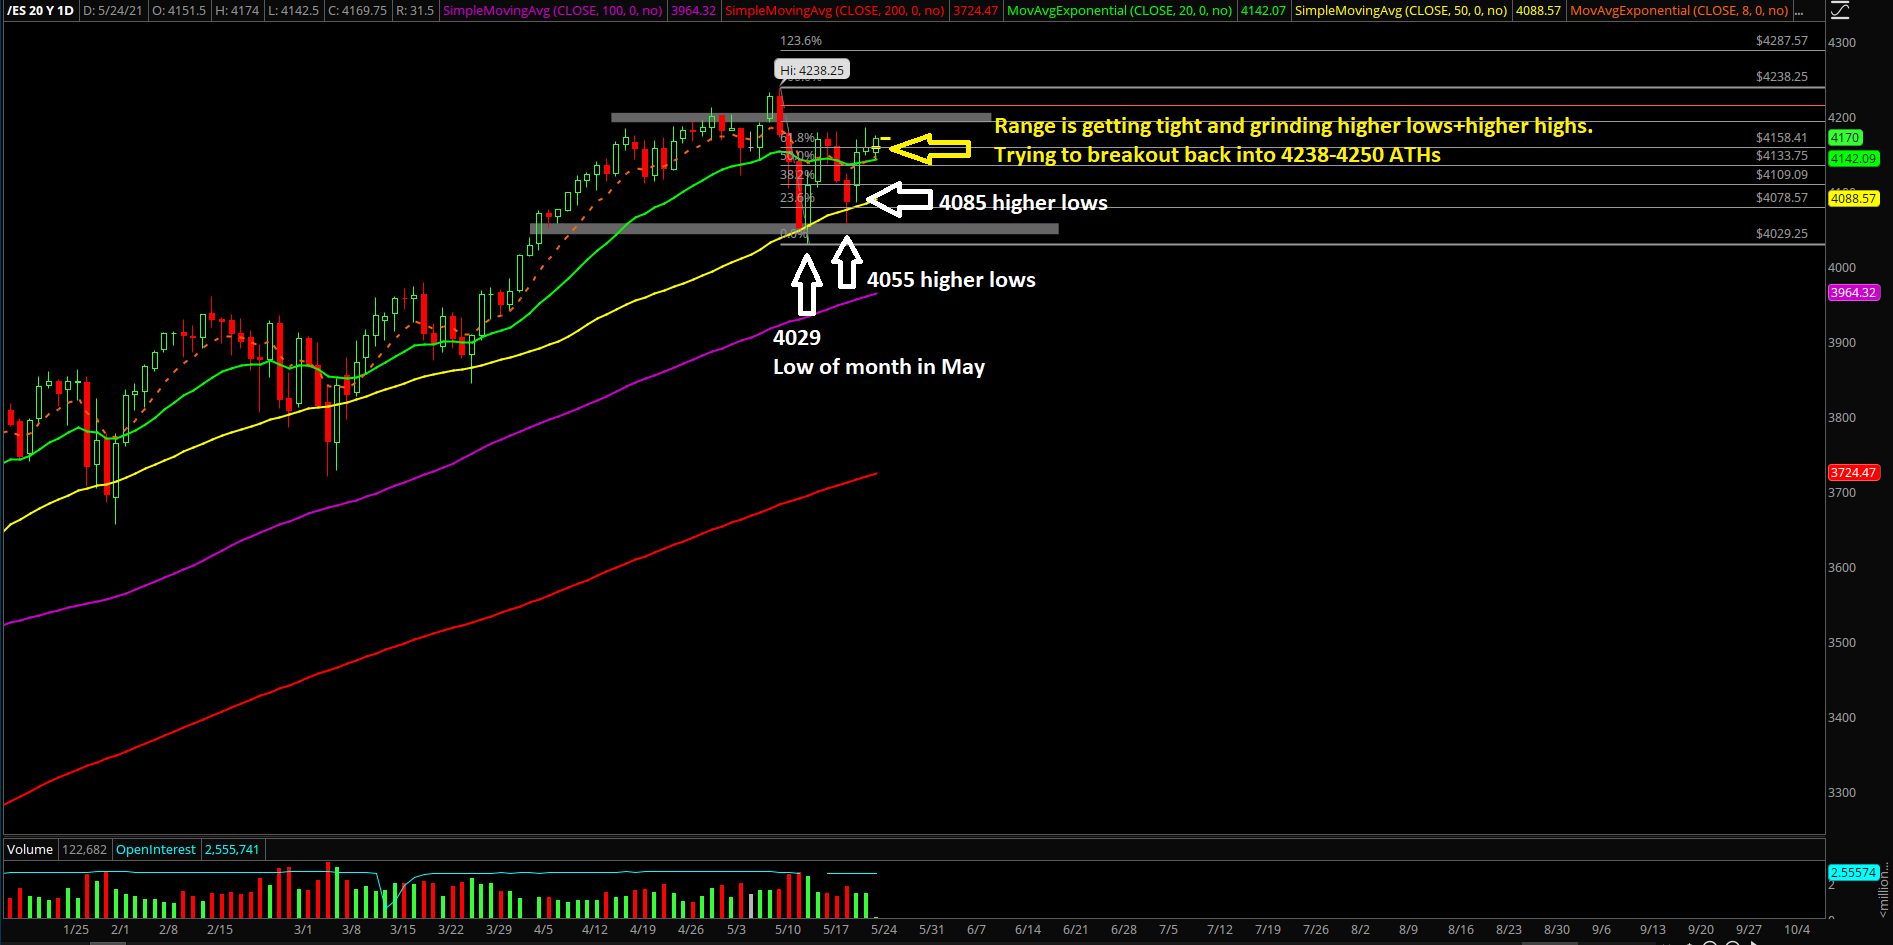
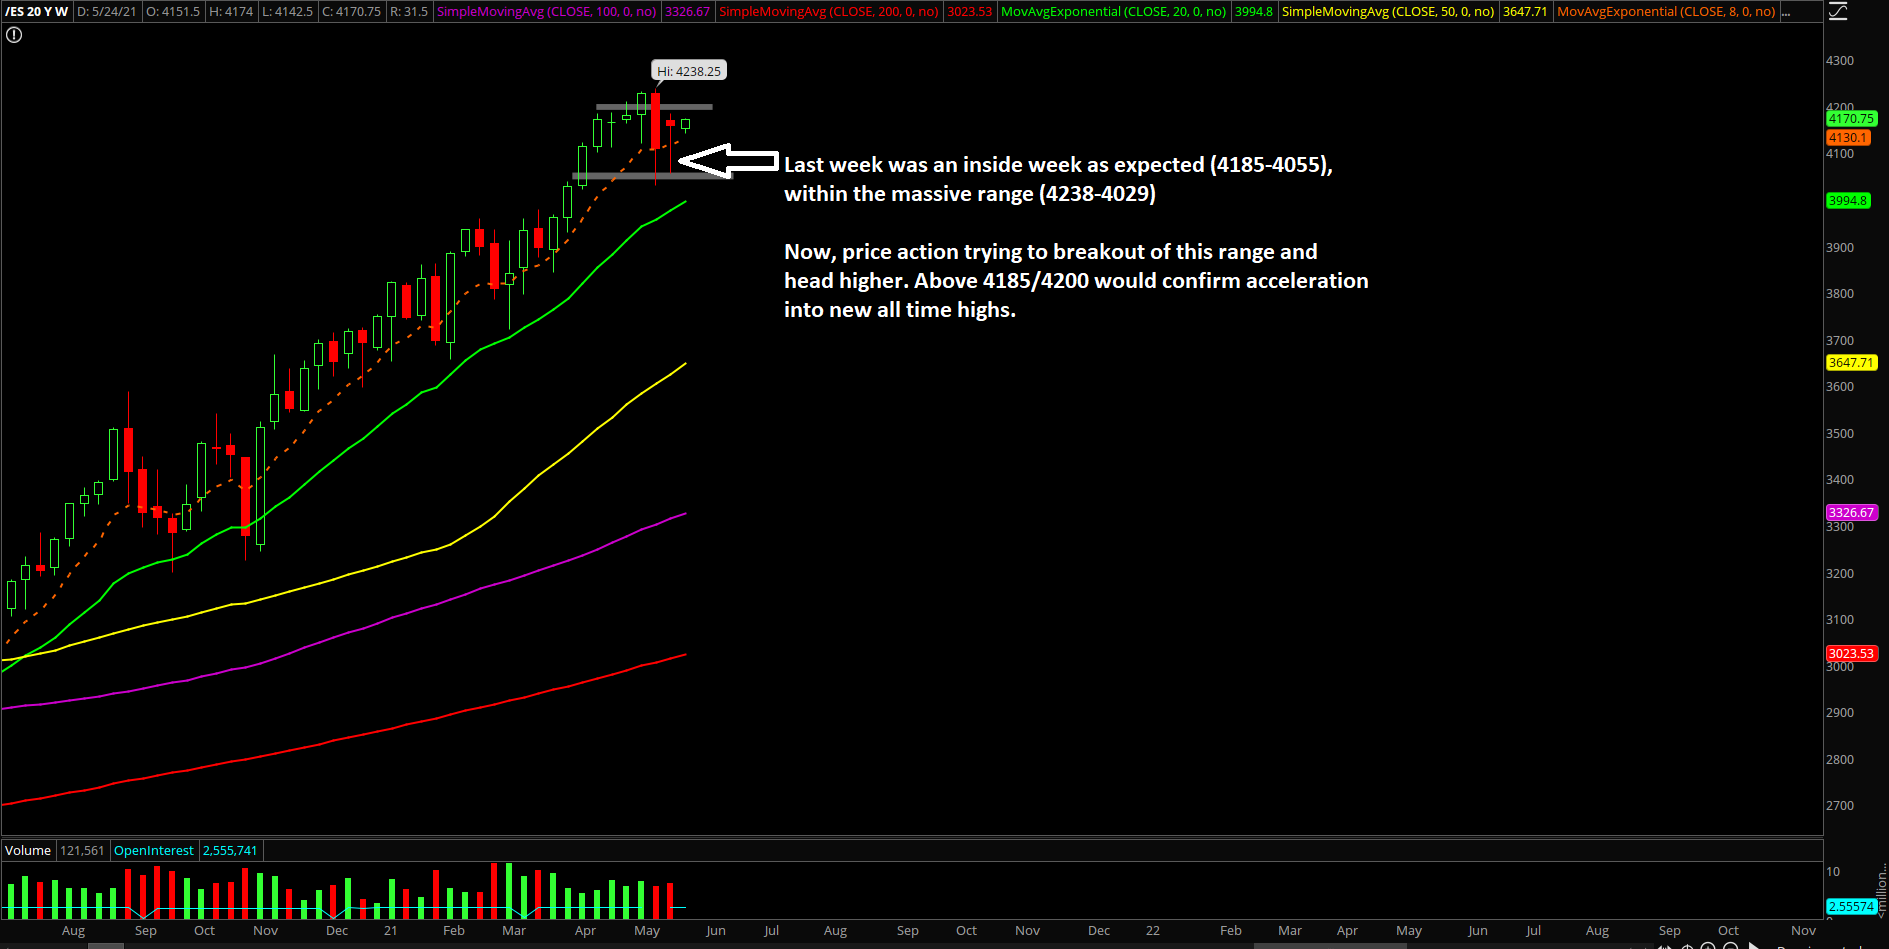
- Last week closed at 4157.75 and it played out as an inside week as expected. This week is month end within a bullish trend context so you already know what both sides are trying to do; bulls end high, bears try to reject
- If you recall, last week’s range was 4185-4055 within the second week of May’s 4238-4029
- This means that once price action goes above 4185 or below 4055, there will be an acceleration
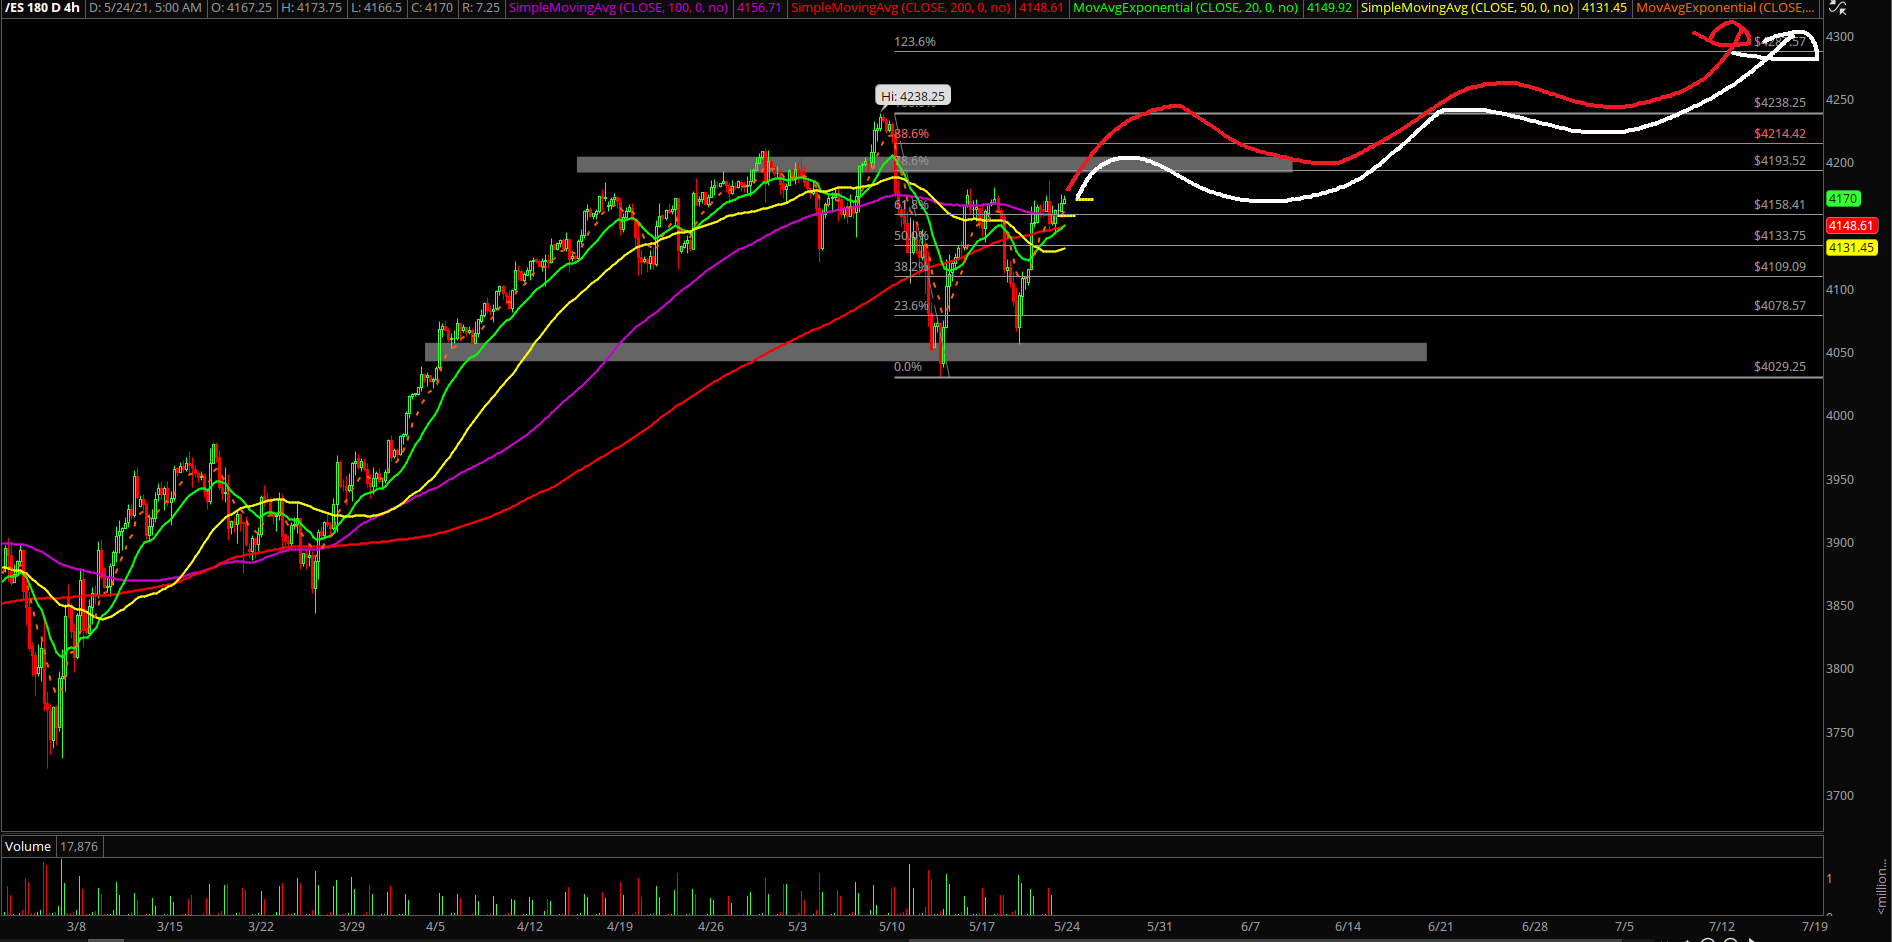
- 4hr white line projection = primary, red line = alternative. Same end goal/target zone
- We maintain the same basis going into this week+June; ES 4238-4250 target when above our key trending supports, every dip is an opportunity given the clear risk vs reward for the nexst 5-15 sessions. If below supports, adapt or die as price action is dynamic not static
- Again, ES+NQ have formed their multi-day/week low given the context of ES 4029 vs 4055 lows and NQ 12915 vs 12954
- Bigger picture wise, month of May is just a consolidation setup in a massive bullish trending monthly context. It’s resting/digesting before the market attempts higher highs into rest of this year (when above 3965 SHTF). Pull up our/your monthly chart and you can clearly see it.
Additional context from past months remain mostly unchanged (copied and pasted):
- The shit hits the fan (SHTF) level has moved up to 3965 from 3650, a daily closing print below 3965 is needed in order to confirm a temp top setup/reversal for the daily+weekly timeframe. (the current April 2021 lows which was the breakout acceleration point of the past few weeks)
- A break below 3965 would be a strong indication of weakness given the multi-week trend of being above the daily 20EMA train tracks. For reference, the first week of April, the price ation has accelerated on top of the daily 8EMA to indicate that the bulls are in full control and continuously making higher lows and higher highs every couple sessions bottomed
- Different timeframes in this report so it may be overwhelming, make sure you know which timeframes you are participating and adjust gameplan + execution accordingly
ES MAY24_REVIEW
ES MAY24_REVIEW2
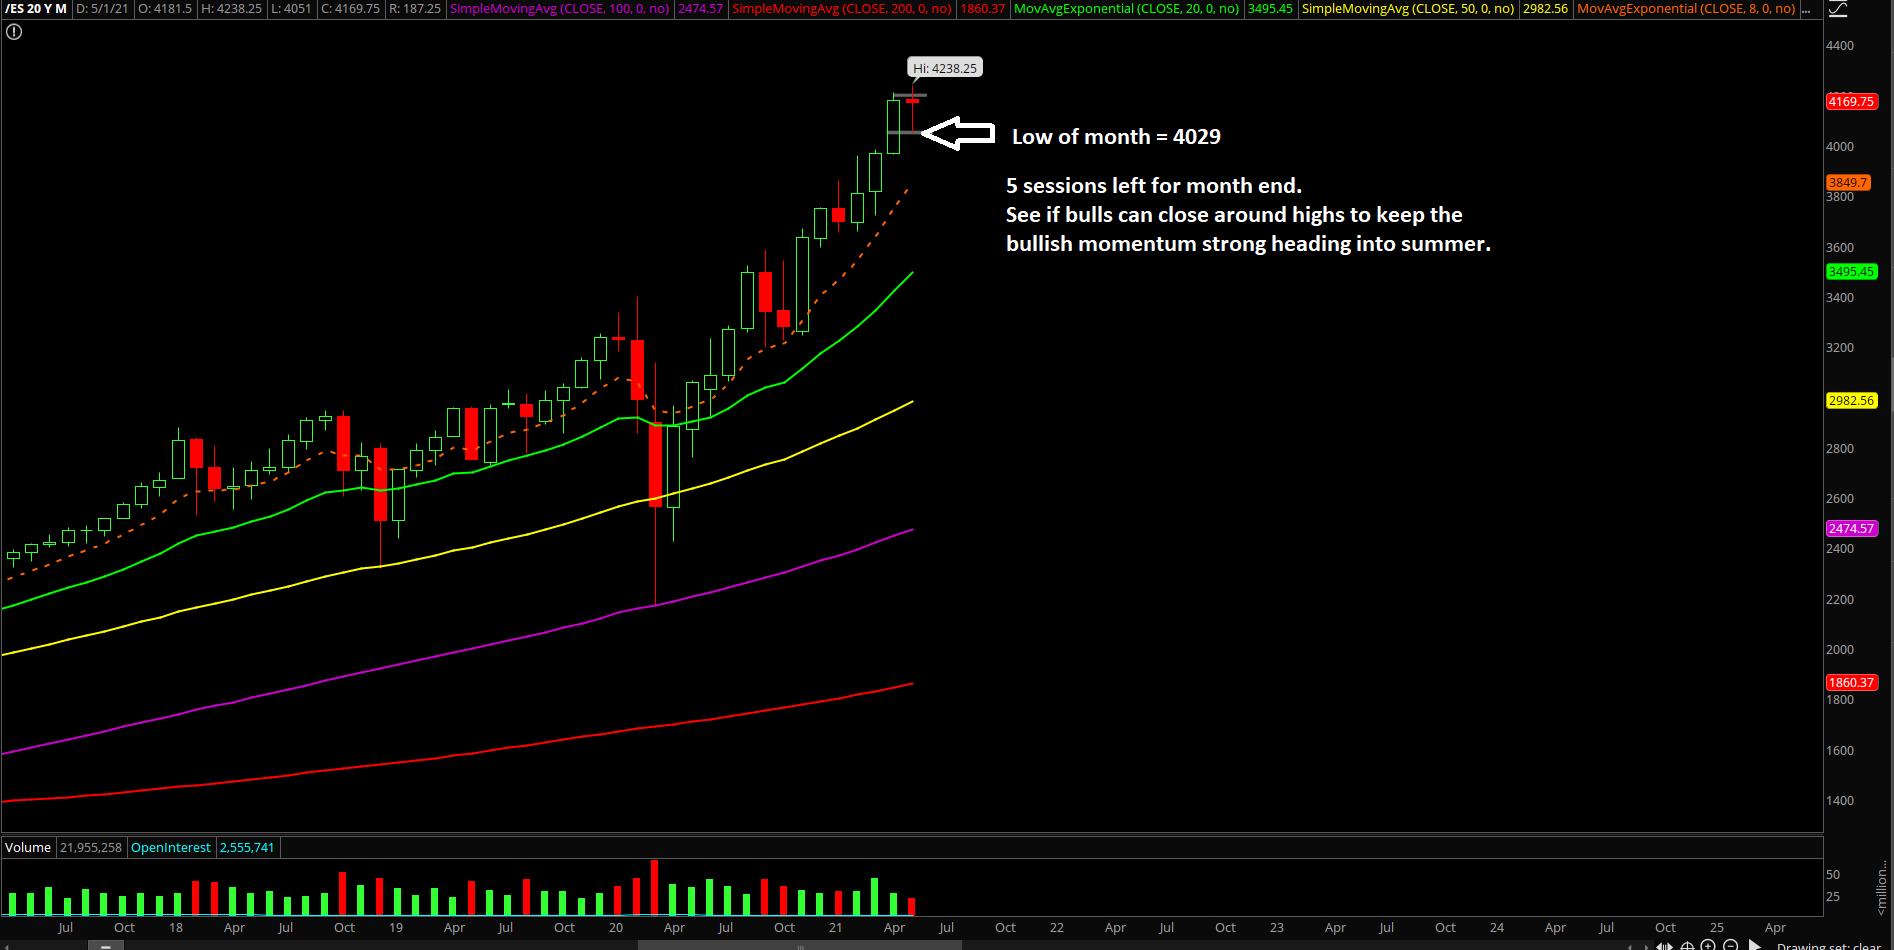
ES MAY24_REVIEW3
ES MAY24_REVIEW4
