Market Analysis for Mar 29th, 2021
 By
Ricky Wen
By
Ricky Wen
E-mini S&P 500 Futures: Keep It Simple Stupid –Quarter End Closing, Buyers Need To Win It All
Copying and pasting a section from our ES trade alert room’s premarket gameplan report. FYI, the ES trade room provides real-time entries and exits with pre-determined stoploss and target levels alongside with real-time lessons on strategy/risk management/psychology/momentum. (some key levels + strategies have been redacted for fairness to subscribers)
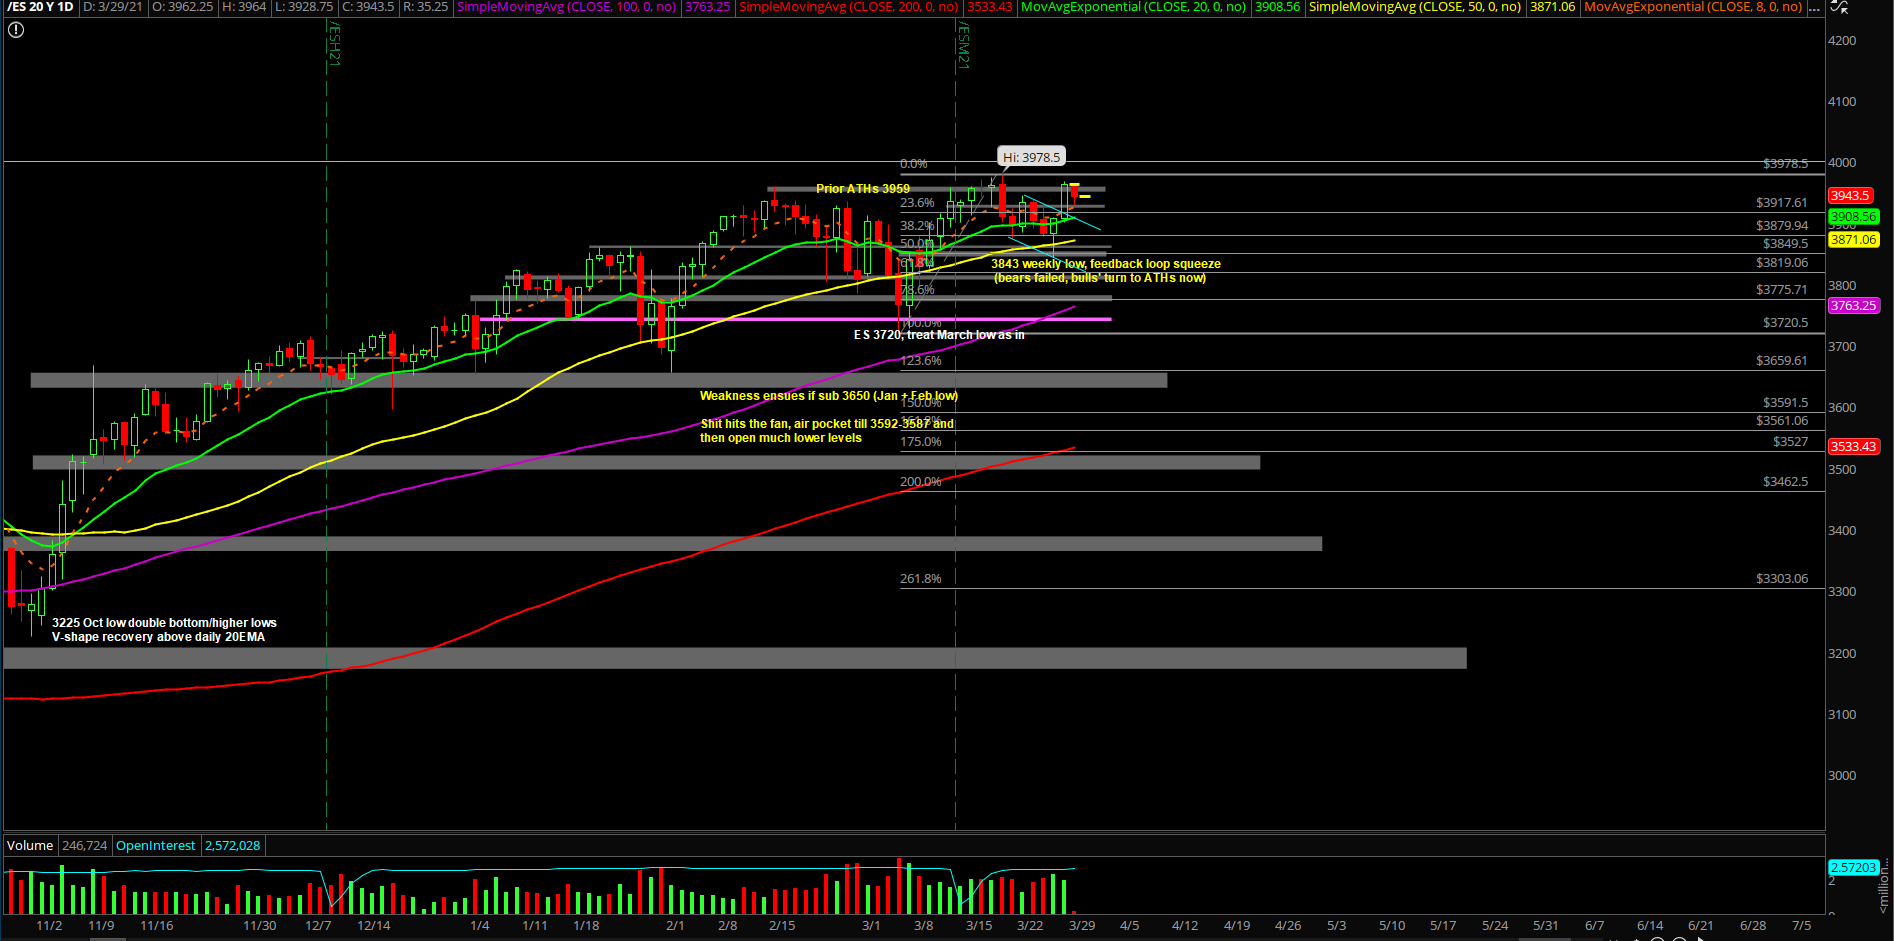
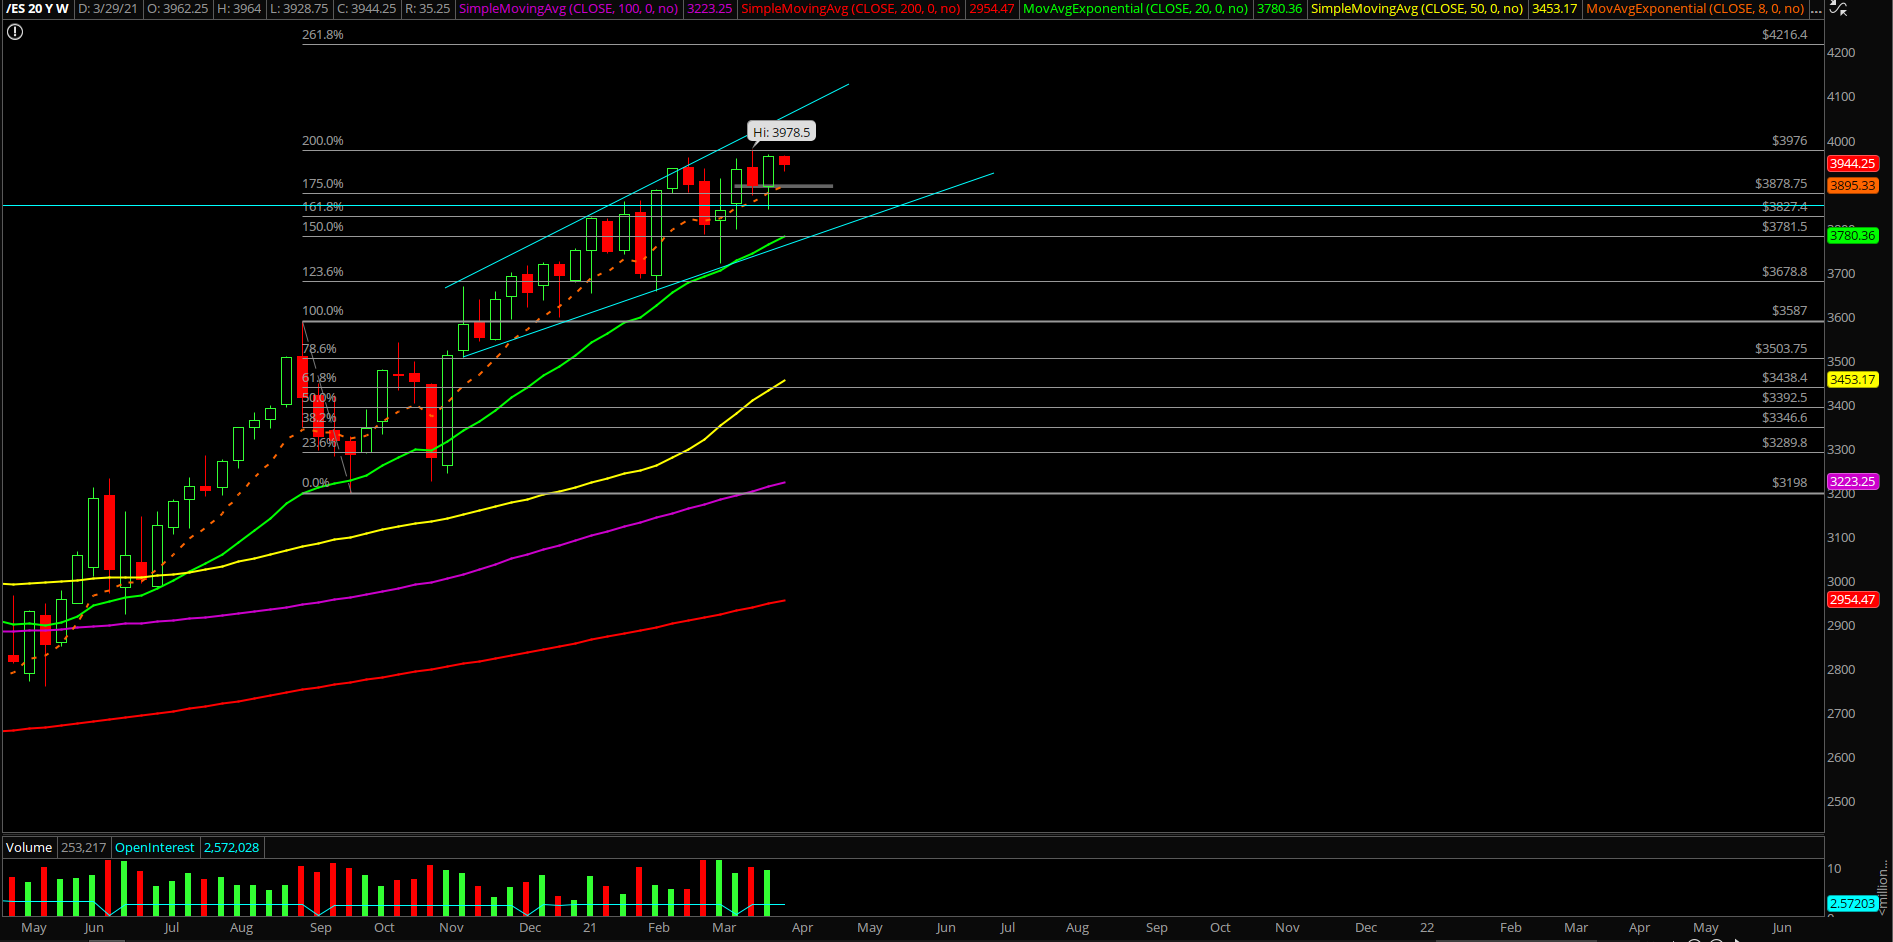
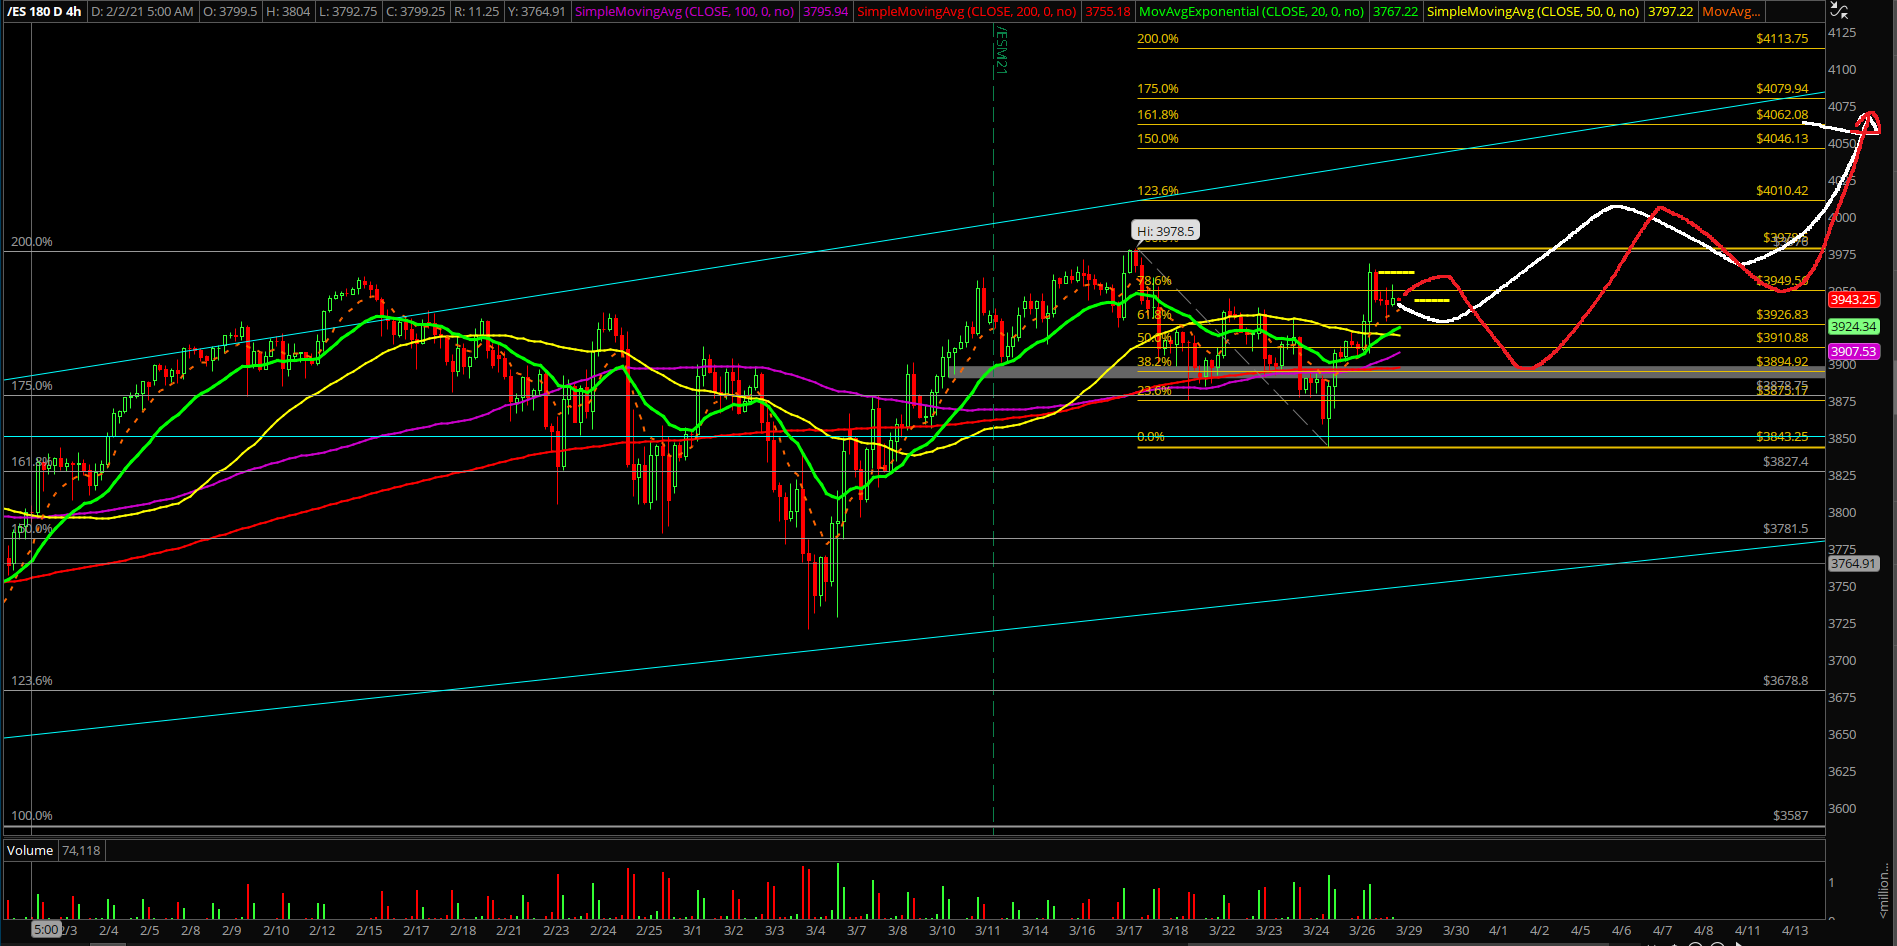
- Friday closed at 3962.25 which was a new all time high weekly closing print
- We’re treating last week’s low of 3843 as the higher lows setup on daily+weekly chart
- This means that it’s very crucial for the bull train to keep continuing higher lows and higher highs this week. Otherwise, things fall apart again and we’re back to consolidation/shakefest
- Price action currently is above the trending daily8+20EMA again indicating shakefest/consolidation may be over. Bulls need new all time highs to wipe out bears/sellers
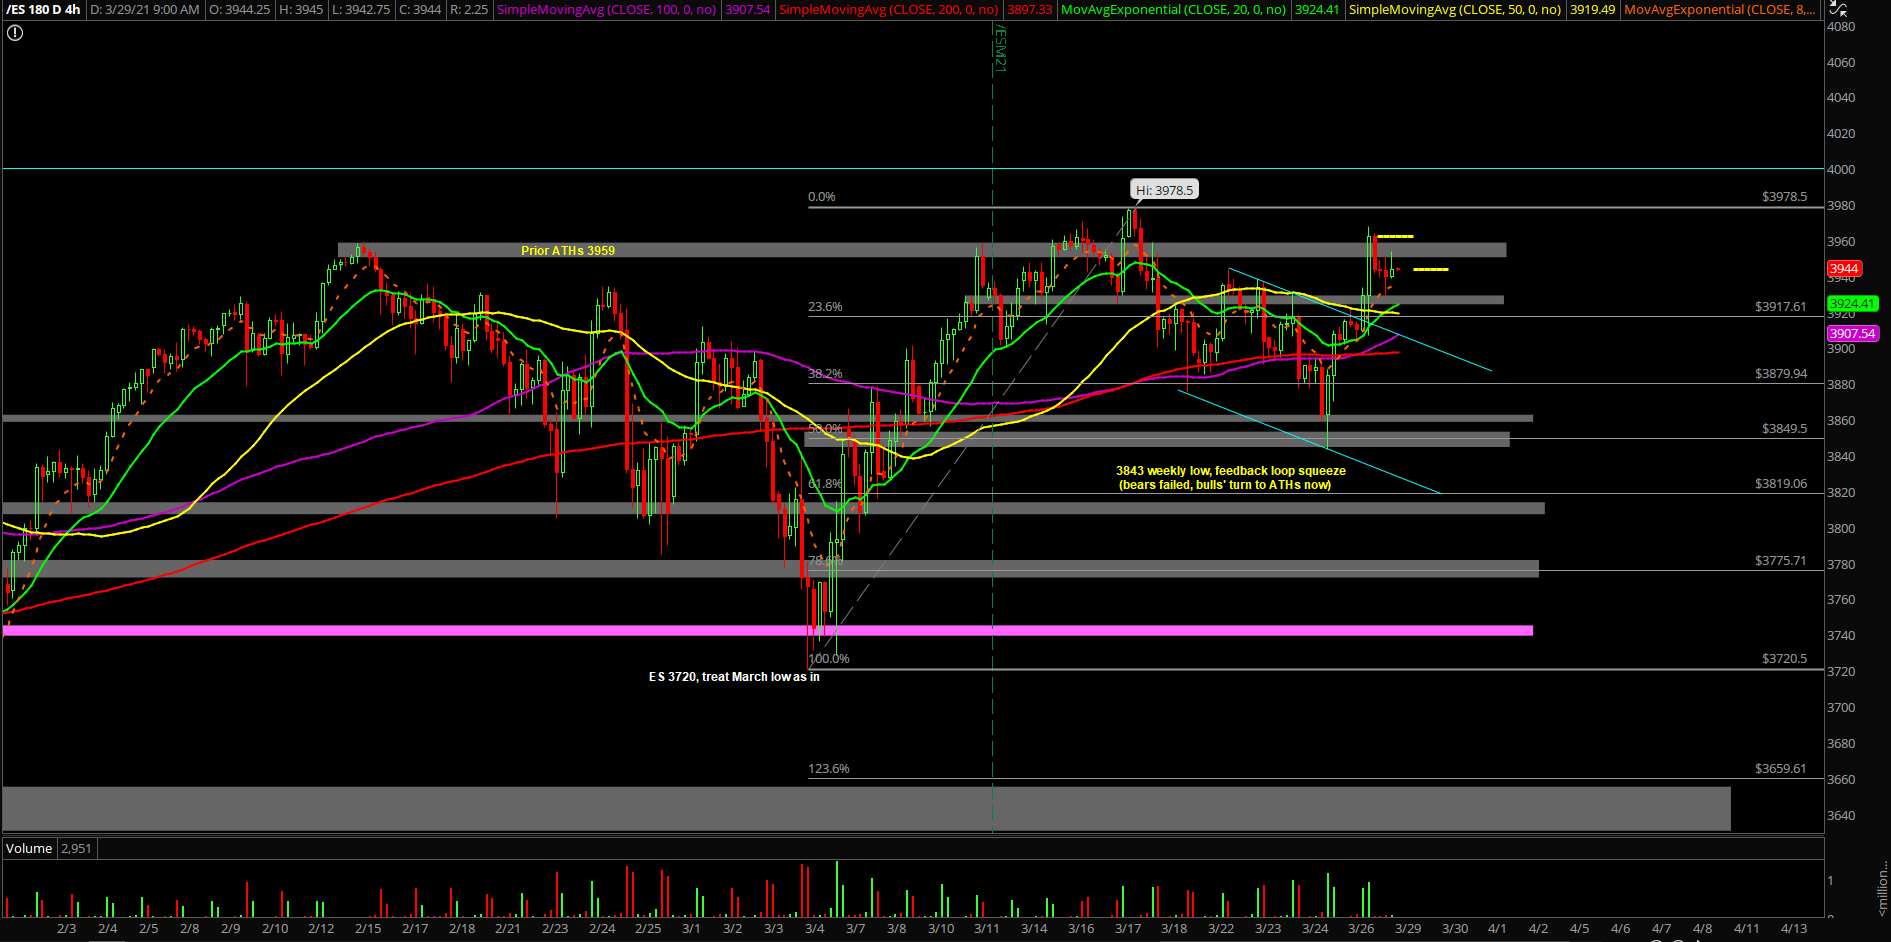
- Bullish when above the 3925-3925 key support zone with 3976/4000+ targets being in play
- If you recall, last week’s sellers/bears temporarily broke below 3885-3875 support, but their downside continuation/follow through setup ultimately failed. Price action bottomed at 3843 which was near the important 3850 confluence zone (50% fib + multi-week support/res + prior breakout zone)
- Basically, bears failed their job so now it’s bulls’ turn for the quarter end closing print at or near the highs given the context+trend of this market. Also known as feedback loop squeeze setup
- If below 3925-3935, opens up 3900/3885 being at risk again….consolidation/weakness
- 4hr white line projection primrary, 4hr red line = alternative. Same end goal 4000+, valid when above supports
Additional context from past months remain mostly unchanged (copied and pasted):
- The shit hits the fan (SHTF) level has moved up to 3650 from 3592, a daily closing print below 3650 is needed in order to confirm a temp top setup/reversal for the daily+weekly timeframe. (Janurary lows + Feb lows)
- A break below 3650 would be a strong indication of weakness given the multi-month trend of being above the daily 20EMA train tracks. For reference, the first week of 2021 (Jan 4th) bottomed out at 3650s vs the daily 20EMA/major support confluence area and then swiftly made new all time highs per our expectations as support held
ES MARCH29_REVIEW
ES MARCH29_REVIEW2
ES MARCH29_REVIEW3
ES MARCH29_REVIEW4
ES MARCH29_REVIEW5
