Market Analysis for Mar 15th, 2021
 By
Ricky Wen
By
Ricky Wen
E-mini S&P 500 Futures: Keep It Simple Stupid – March Lows V-Shape +6%, Likely ATHs Into End of Q1
Copying and pasting a core section from our ES trade alert room’s premarket gameplan report where we demonstrate real-time trades and educational lessons. FYI, the ES trade room provides real-time entries and exits with pre-determined stoploss and target levels alongside with real-time lessons on strategy/risk management/psychology/momentum. (some key levels have been redacted for fairness to subscribers)
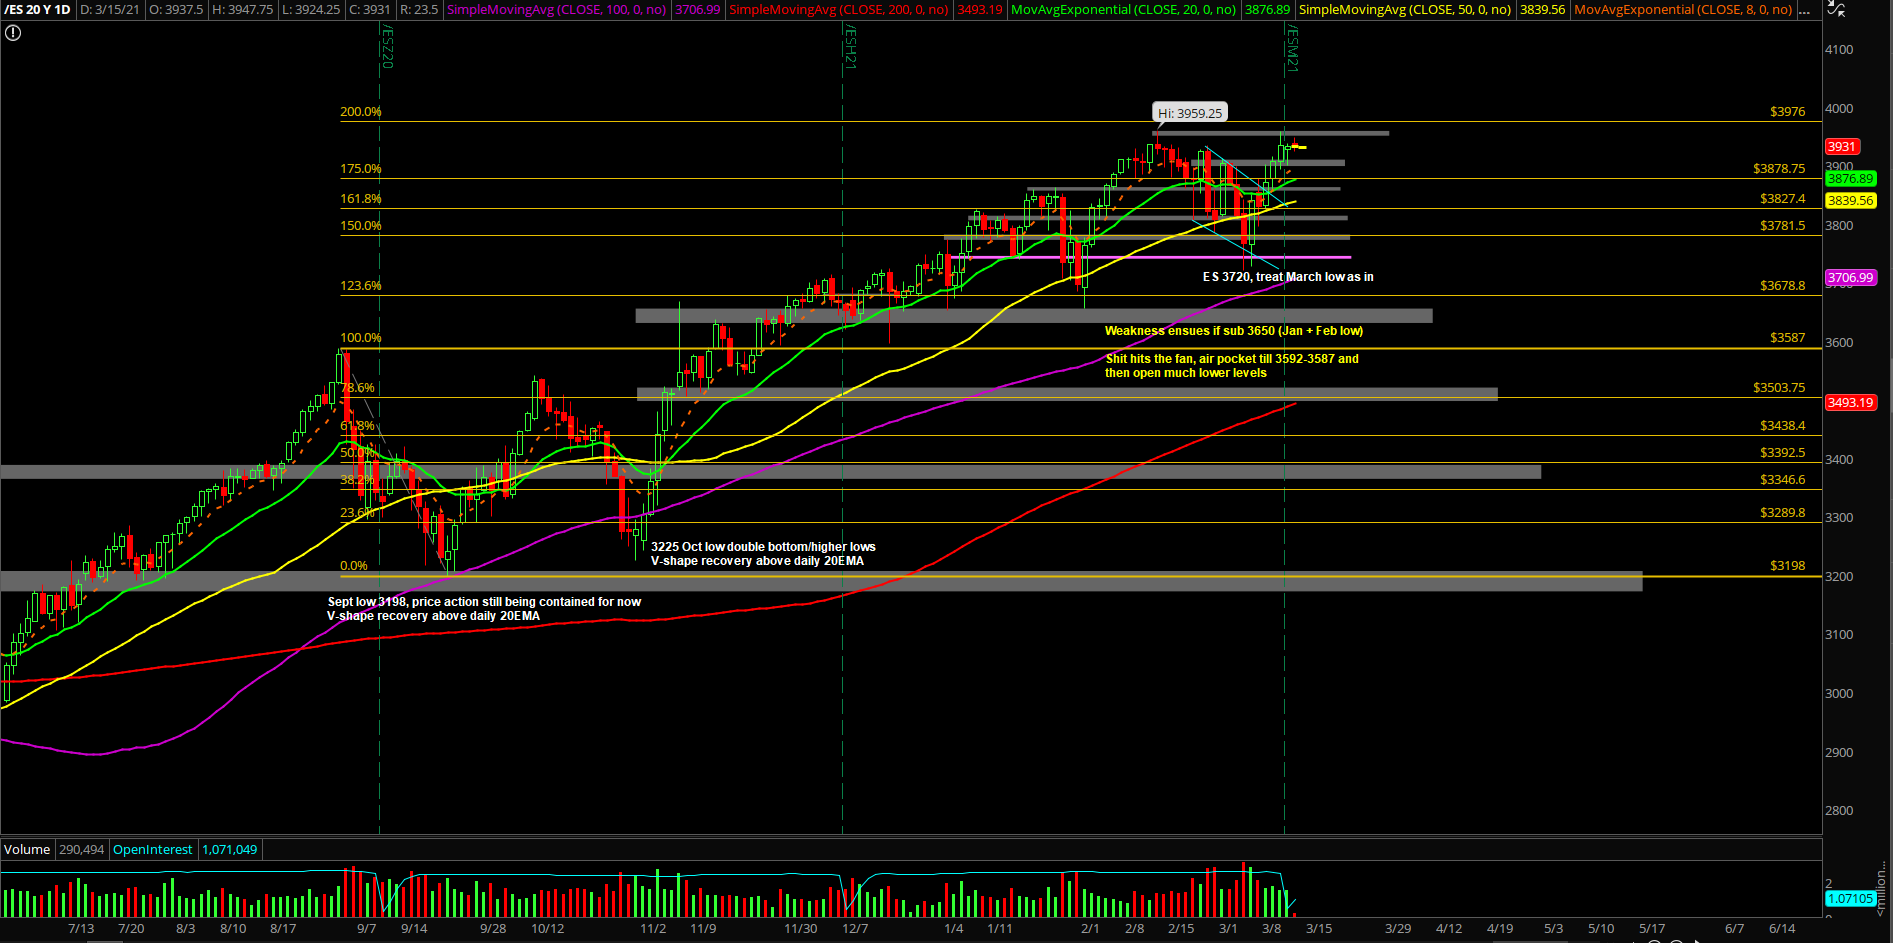
- Heading into this week, we’re definitely bullish biased given the first half of March completing a +6% quick bounce off the lows. Look for BTFD opps vs our key levels
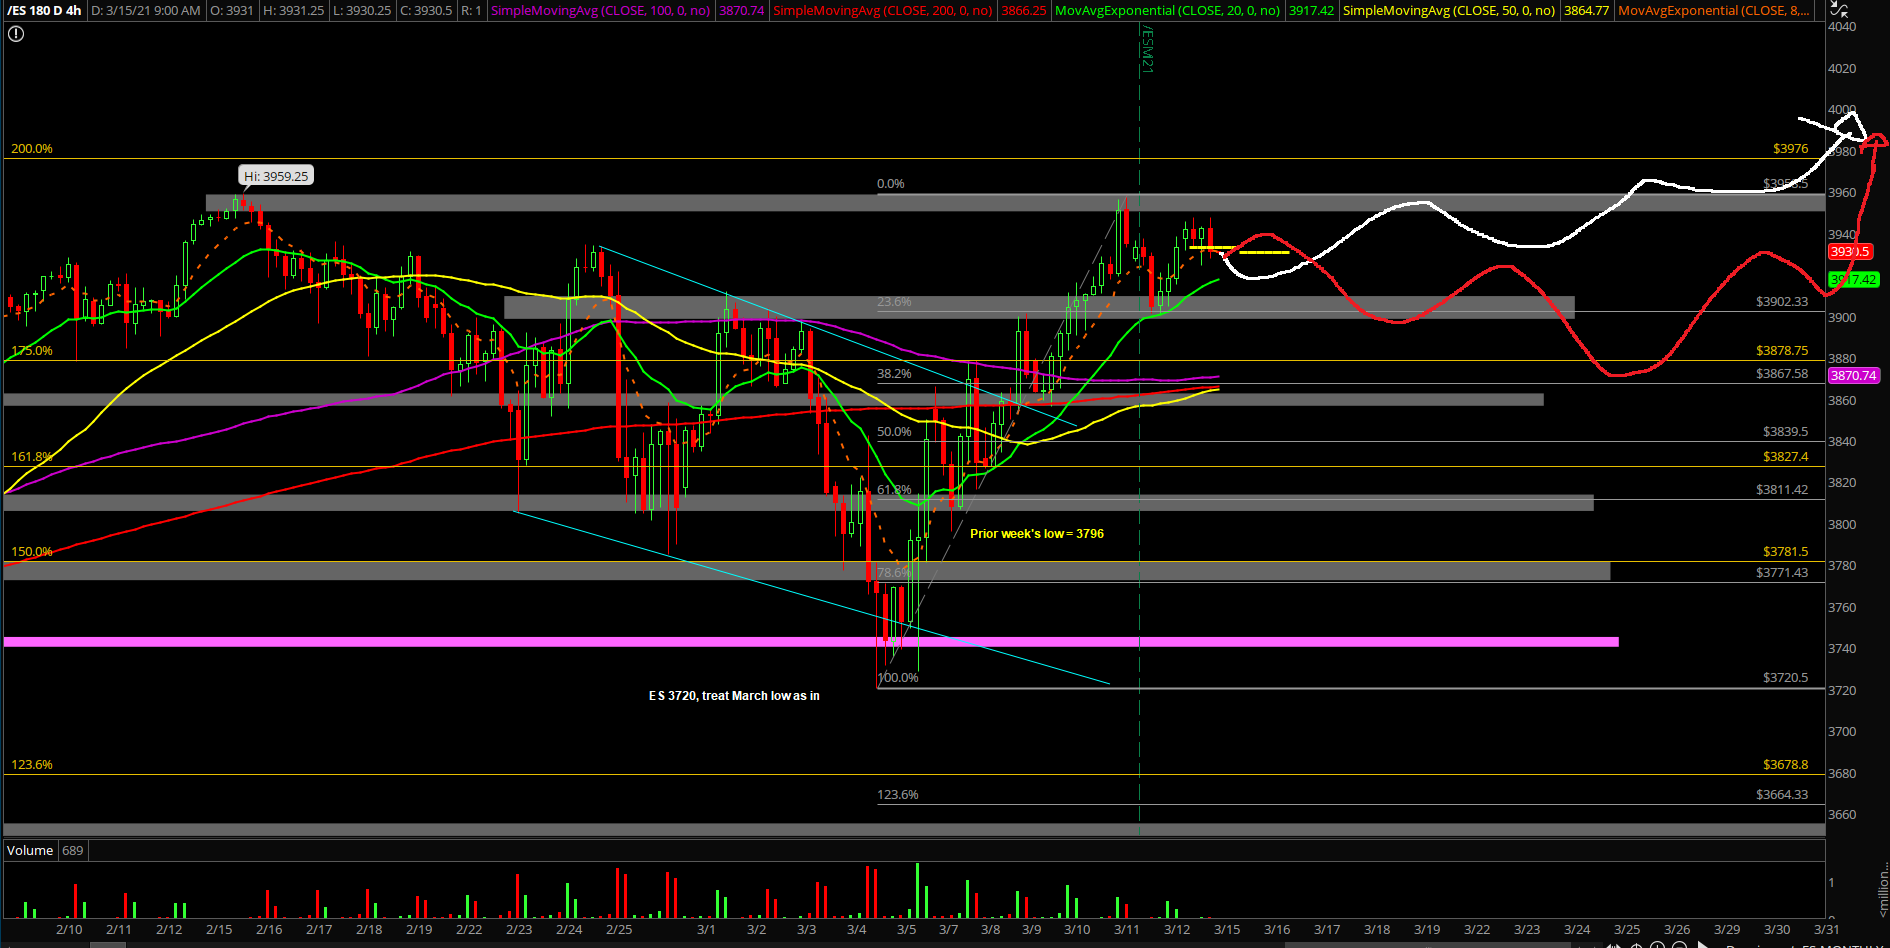
- We included our price projections for visual aid (white line = primary, red alternative. Adapt as things could change with new info)
- If you recall, the second week of March’s bullish continuation structure confirmed the 3720 low of March. As discussed, we’re treating the first week of March as the foreseeable low
- Daily timeframe: 3950s-3900s bull flag/digestion before the next ramp up towards target
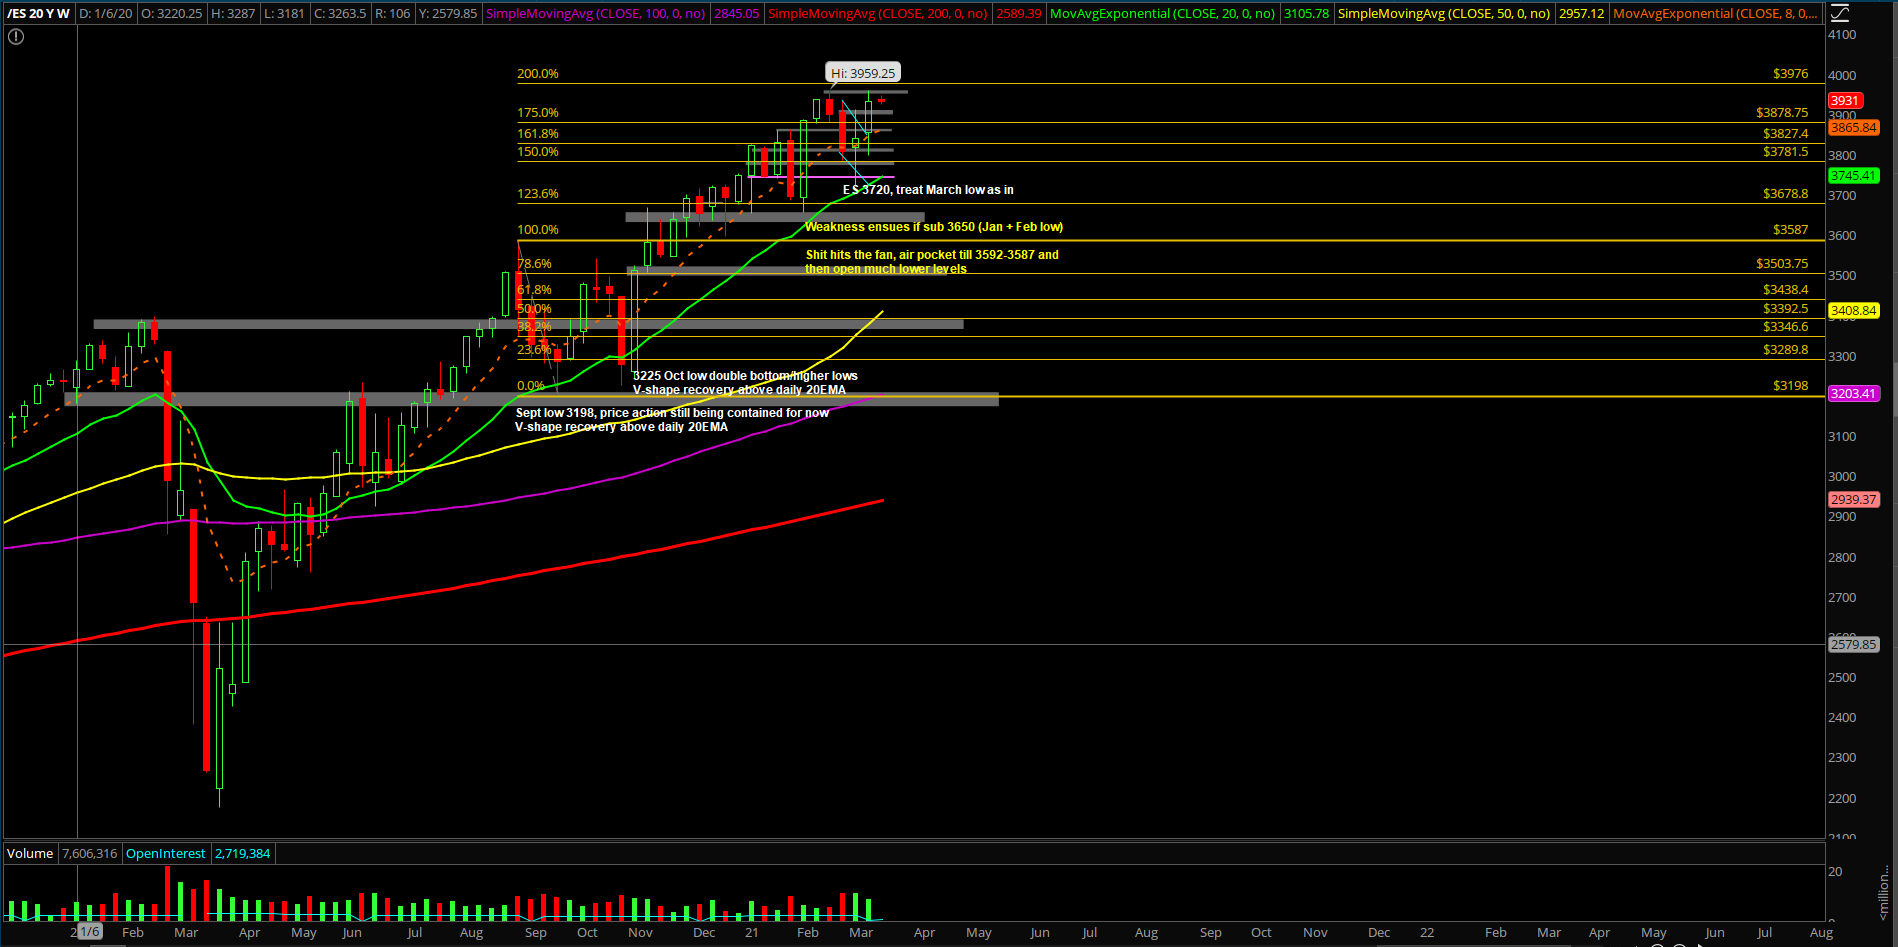
- Weekly timeframe: last week’s low was 3796; we expect bulls to hold above 3800 at all times. Otherwise, need to adapt to a range of 3950s-3720s or much lower
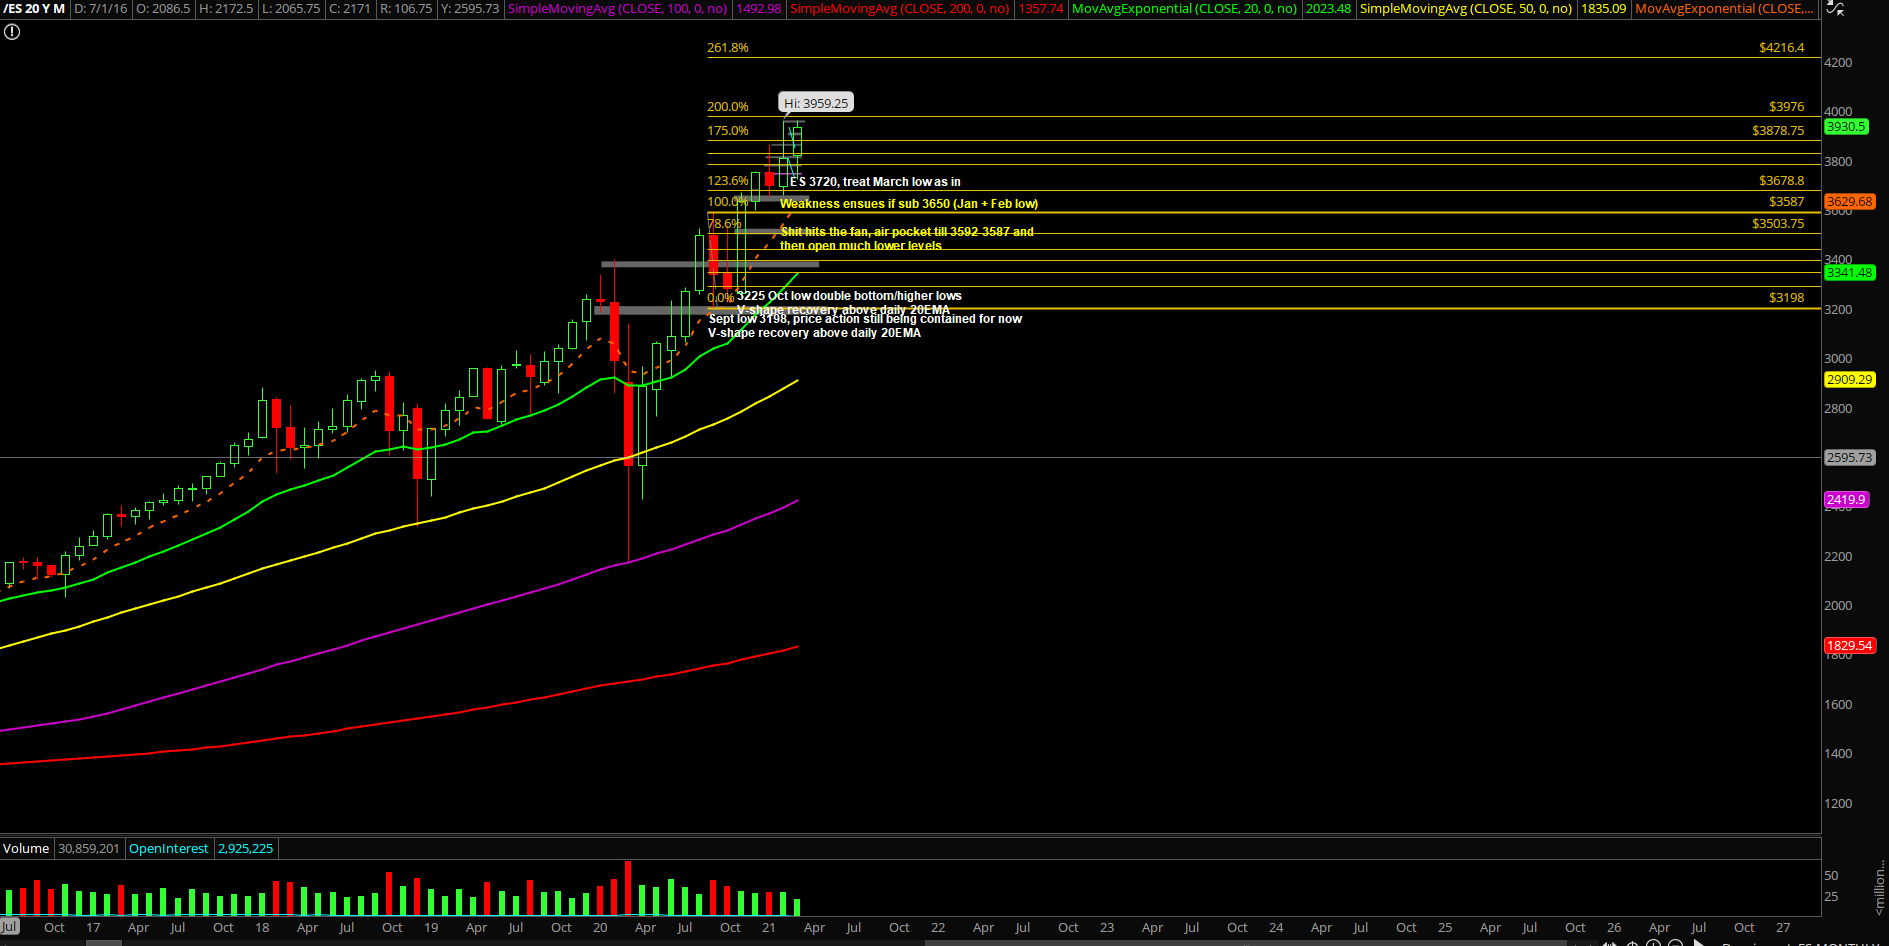
- Monthly timeframe: we’re expecting bull train to continue towards 3976/4000 targets into end of Q1 as the low of March is likely in from 3720 given the context+trend. At this point, there should be no breakdown below 3720 as higher lows and higher highs structure take place
- 3976/4000 on-trend targets need to be fulfilled in the coming days before we include the next high probability setups, level by level approach. Know your timeframes here
Additional context from past few weeks remain mostly unchanged (copied and pasted):
- The shit hits the fan (SHTF) level has moved up to 3650 from 3592, a daily closing print below 3650 is needed in order to confirm a temp top setup/reversal for the daily+weekly timeframe. (Janurary lows + Feb lows)
- A break below 3650 would be a strong indication of weakness given the multi-month trend of being above the daily 20EMA train tracks. For reference, the first week of 2021 (Jan 4th) bottomed out at 3650s vs the daily 20EMA/major support confluence area and then swiftly made new all time highs per our expectations as support held
ES MARCH15_REVIEW
ES MARCH15_REVIEW2
ES MARCH15_REVIEW3
ES MARCH15_REVIEW4
