Market Analysis for Feb 24th, 2021
 By
Ricky Wen
By
Ricky Wen
E-mini S&P 500 Futures: Keep It Simple Stupid – Temp Bottom Established, Needs To Solidify
Tuesday’s session was a gap down and full reversal back into gap fill. Basically, the market stabilized on day#6 of the pullback/consolidation pattern and things are going as expected for now.
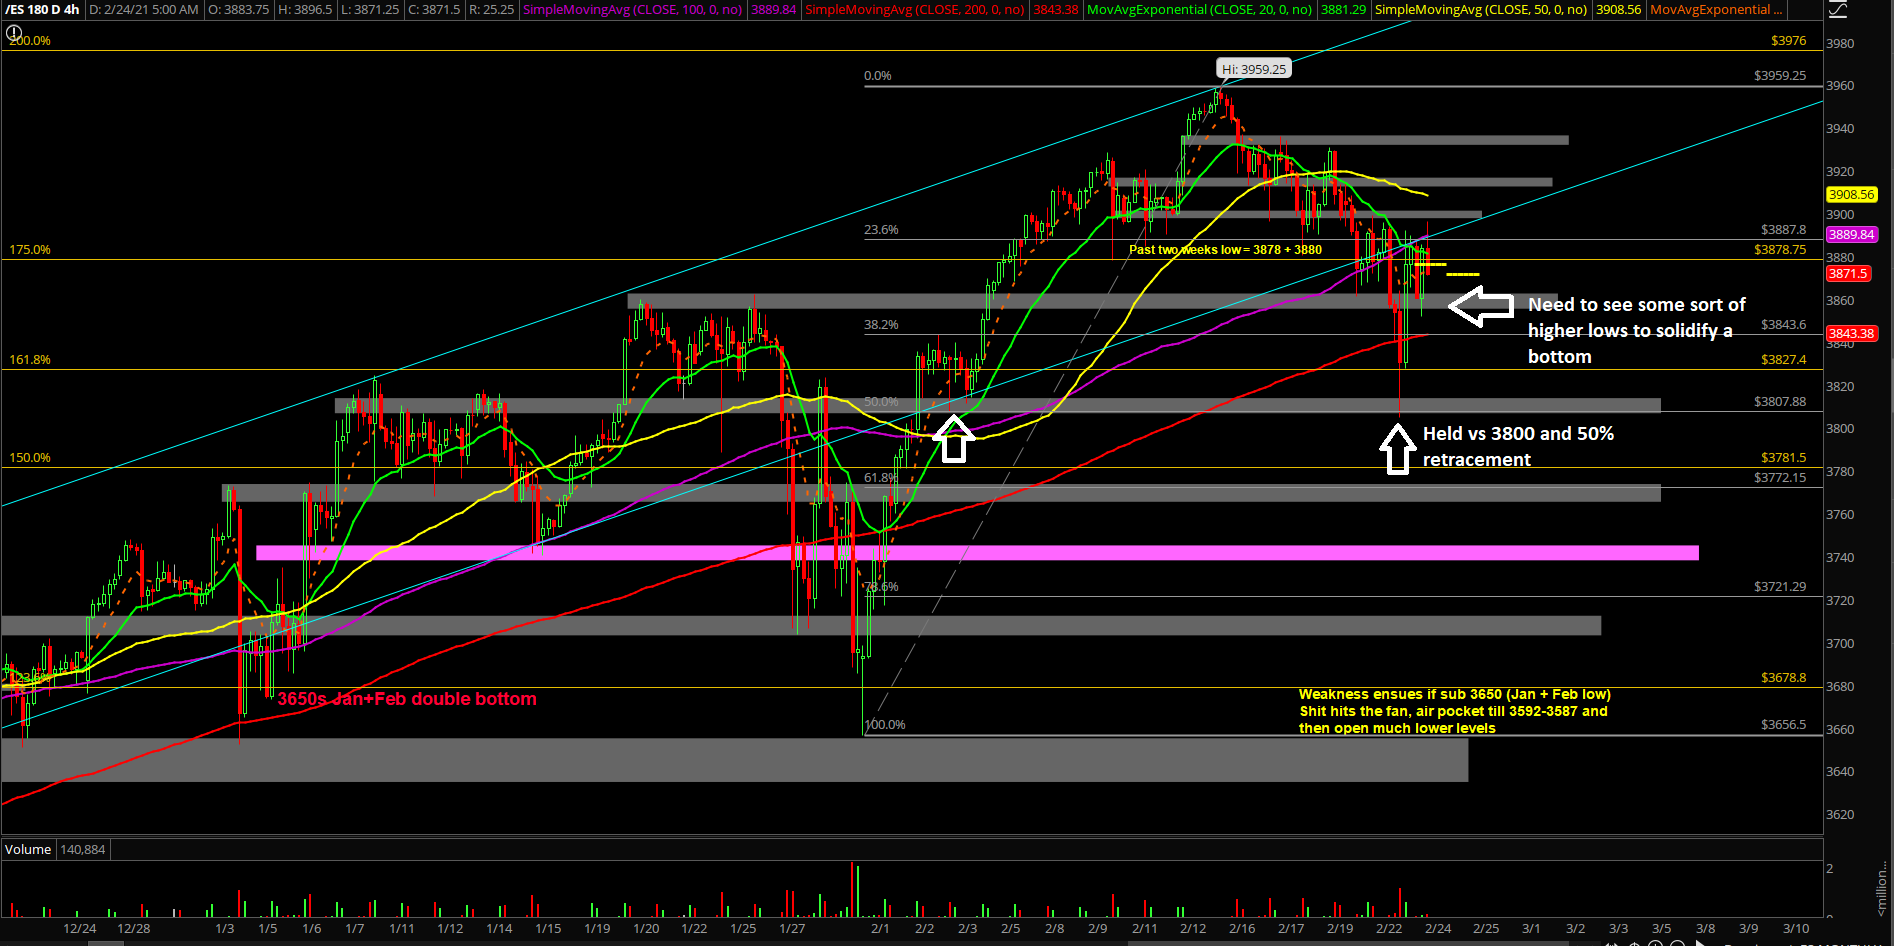
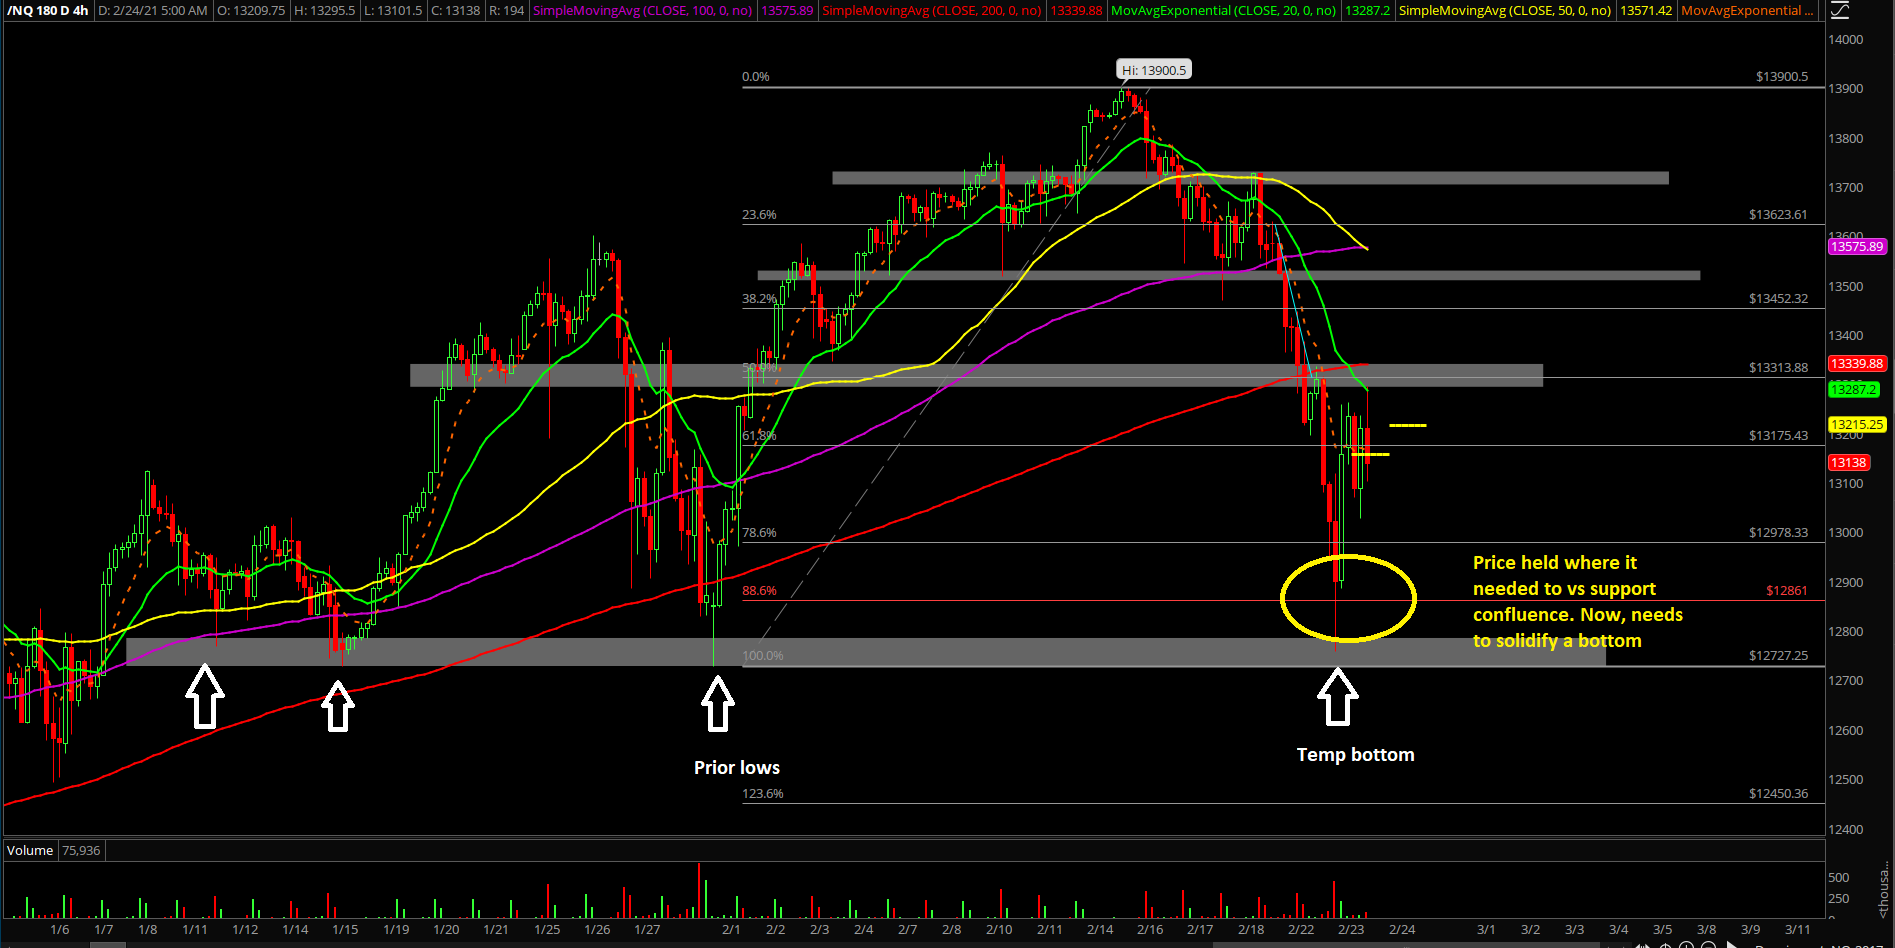
The main takeaway is that traders have a reference point with the current temporary bottom that acts as this week’s low for the foreseeable future until price action invalidates this thesis. Look out for price action to solidify yesterday’s bottom with some sort of higher lows and higher highs playbook in the coming day(s).
What’s next?
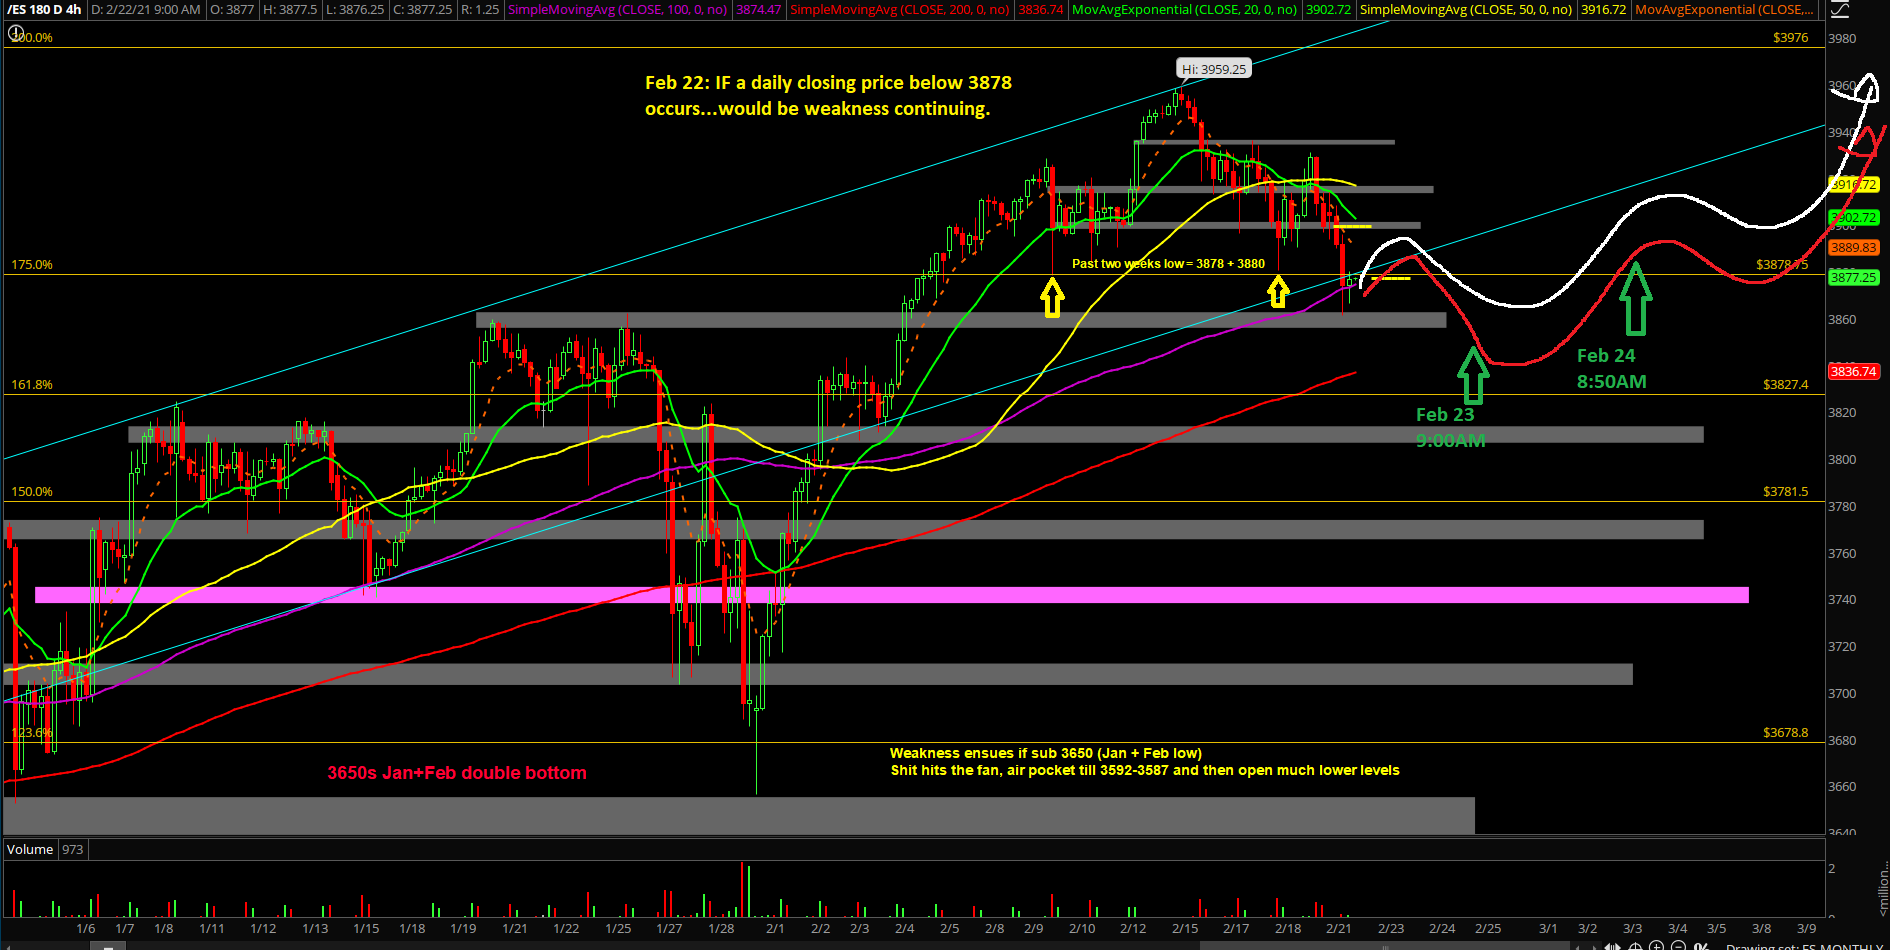
Tuesday closed at 3876 which is the second day flirting with our key 3878 level. If you recall, the 3878 level has been instrumental for the past 2 weeks given the prior week’s bottom. We will keep monitoring these daily closing prints as that’s what truly matters. Intraday is just about shaking the tree.
Copying and pasting a core section from our ES trade alert room’s premarket gameplan report where we demonstrate real-time trades and educational lessons. FYI, the ES trade room provides real-time entries and exits with pre-determined stoploss and target levels alongside with real-time lessons on strategy/risk management/psychology/momentum. (some key levels have been redacted for fairness to subscribers)
- Yesterday played out per expectations as price action established a temporary bottom vs the support confluence. ES found a low at the 3804~ vs 3800 key level and NQ found a low at 12757 vs the 12727 monthly lows+2 standard deviation lows. It was critical for markets to stabilize
- As discussed, we’re treating the current temp low as this week’s low for now as we navigate this price action level by level and day by day using our timeframe alignment approach
- The 4hr red line projection from Monday remains valid as price action overshot into 3804 yesterday and formulated the beginning of a bottoming pattern; inverted head and shoulders
- For today, treating it mostly like a range day/digestion of ES 3900-3850 where the latter number matches with the overnight low area that held the 50% retracement of yesterday’s range
- Bulls would need a daily closing print above 3900 to really confirm a solid bottom. Until then, just stay nimble as things are a ‘work in progress’ given the structure of the pattern+context
- There’s currently a feedback loop squeeze that started from yesterday at the 3800s and it has played out into the 3900 resistance. Wait and see if the basing pattern develops like our 4hr red line projection forming higher lows and higher highs for rest of week
Repeat Feb context:
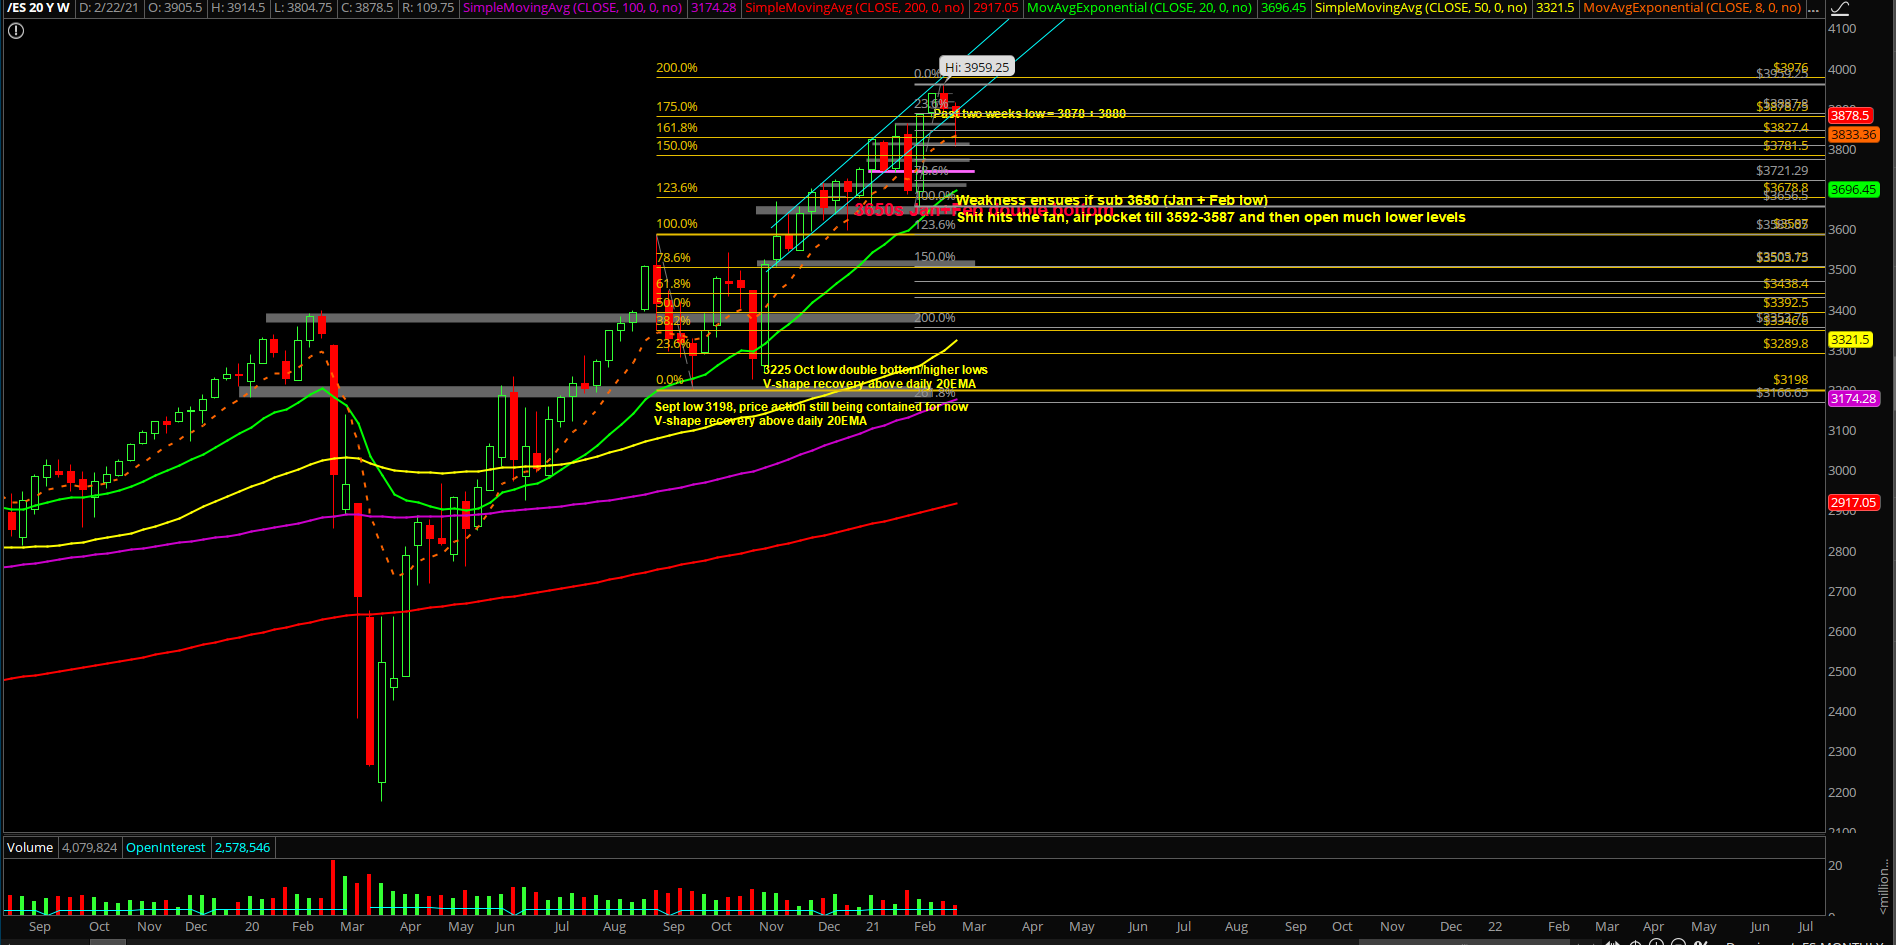
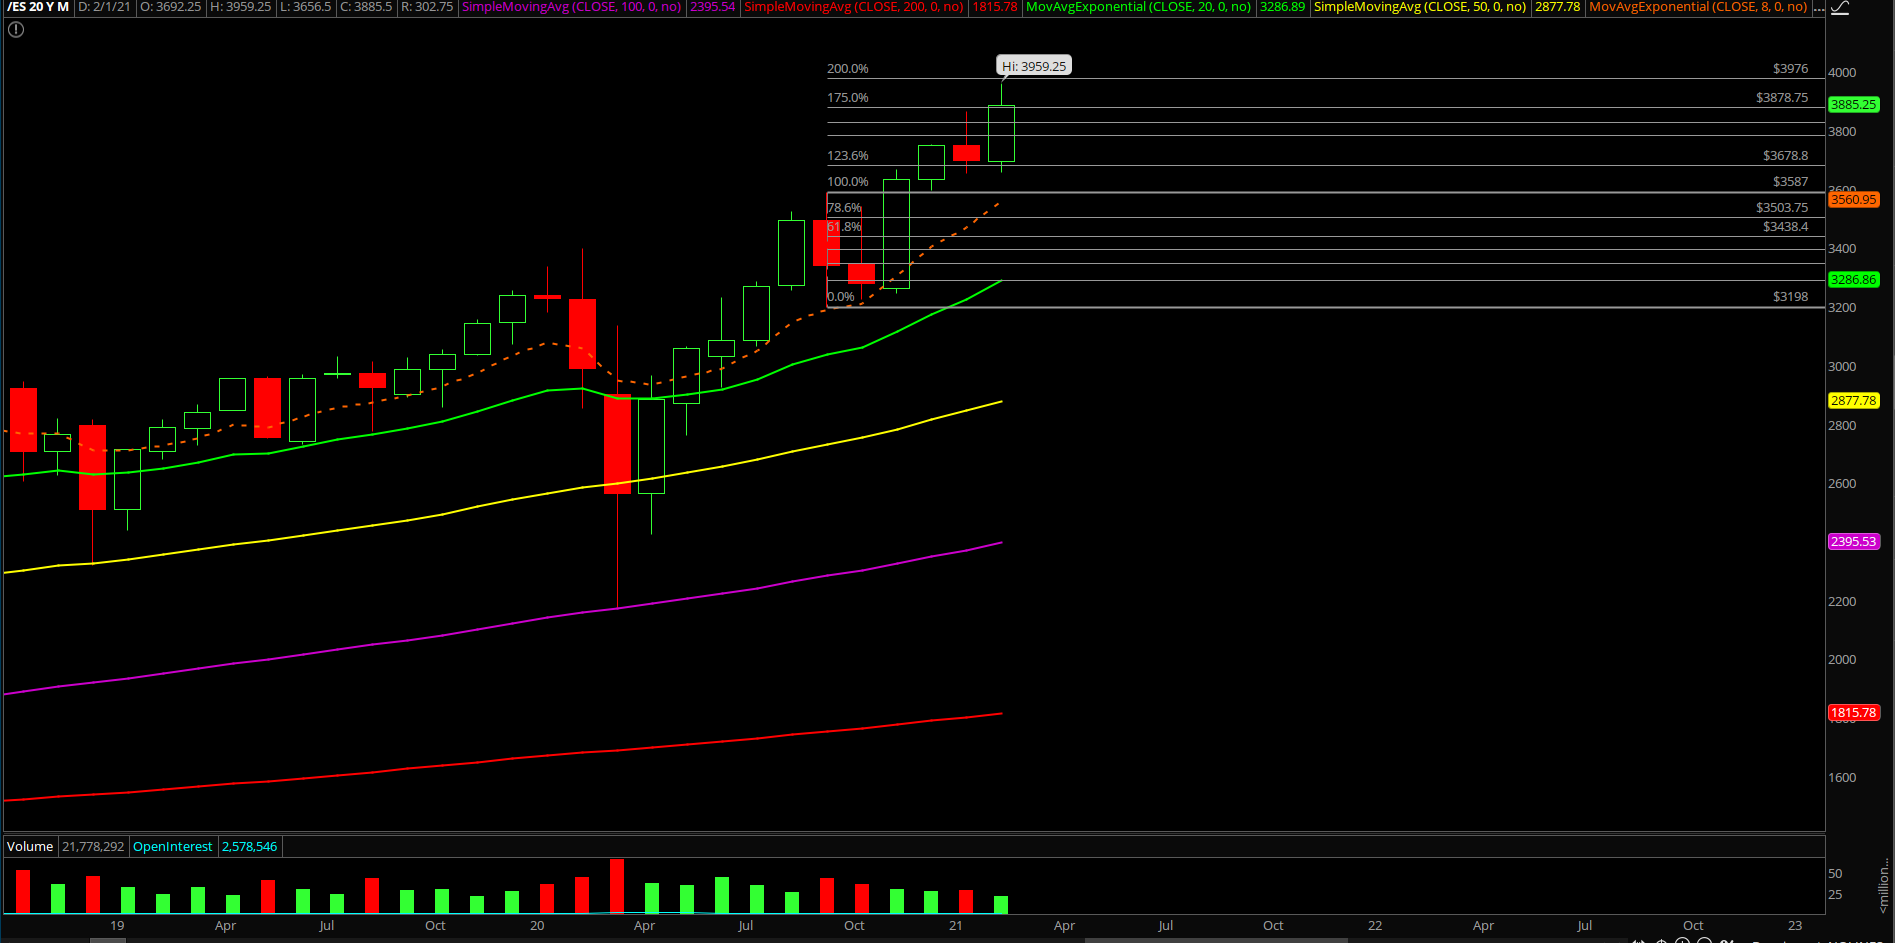
- The overall context for Feb has been an uptrend grind up month that made new all time highs at 3950s vs Janurary. This week is month end so we’re not expecting anything too crazy unless price action can showcase more downside momentum. Intraday weakness /=/ daily closing print weakness
- The general theme will likely be that the bulls will likely try their best to stabilize into the month end closing print by finding a bid. We’re watching this 3830~ area as our projections indicated
- Given that Tuesday Feb 23 stabilized at 3800s for a temporary low/current week’s low, traders have a reference point for rest of this week to judge ongoing short-term momentum
- We must adapt accordingly if price action remains weak, let price dictate your actions
Additional context from past few weeks remain mostly unchanged (copied and pasted):
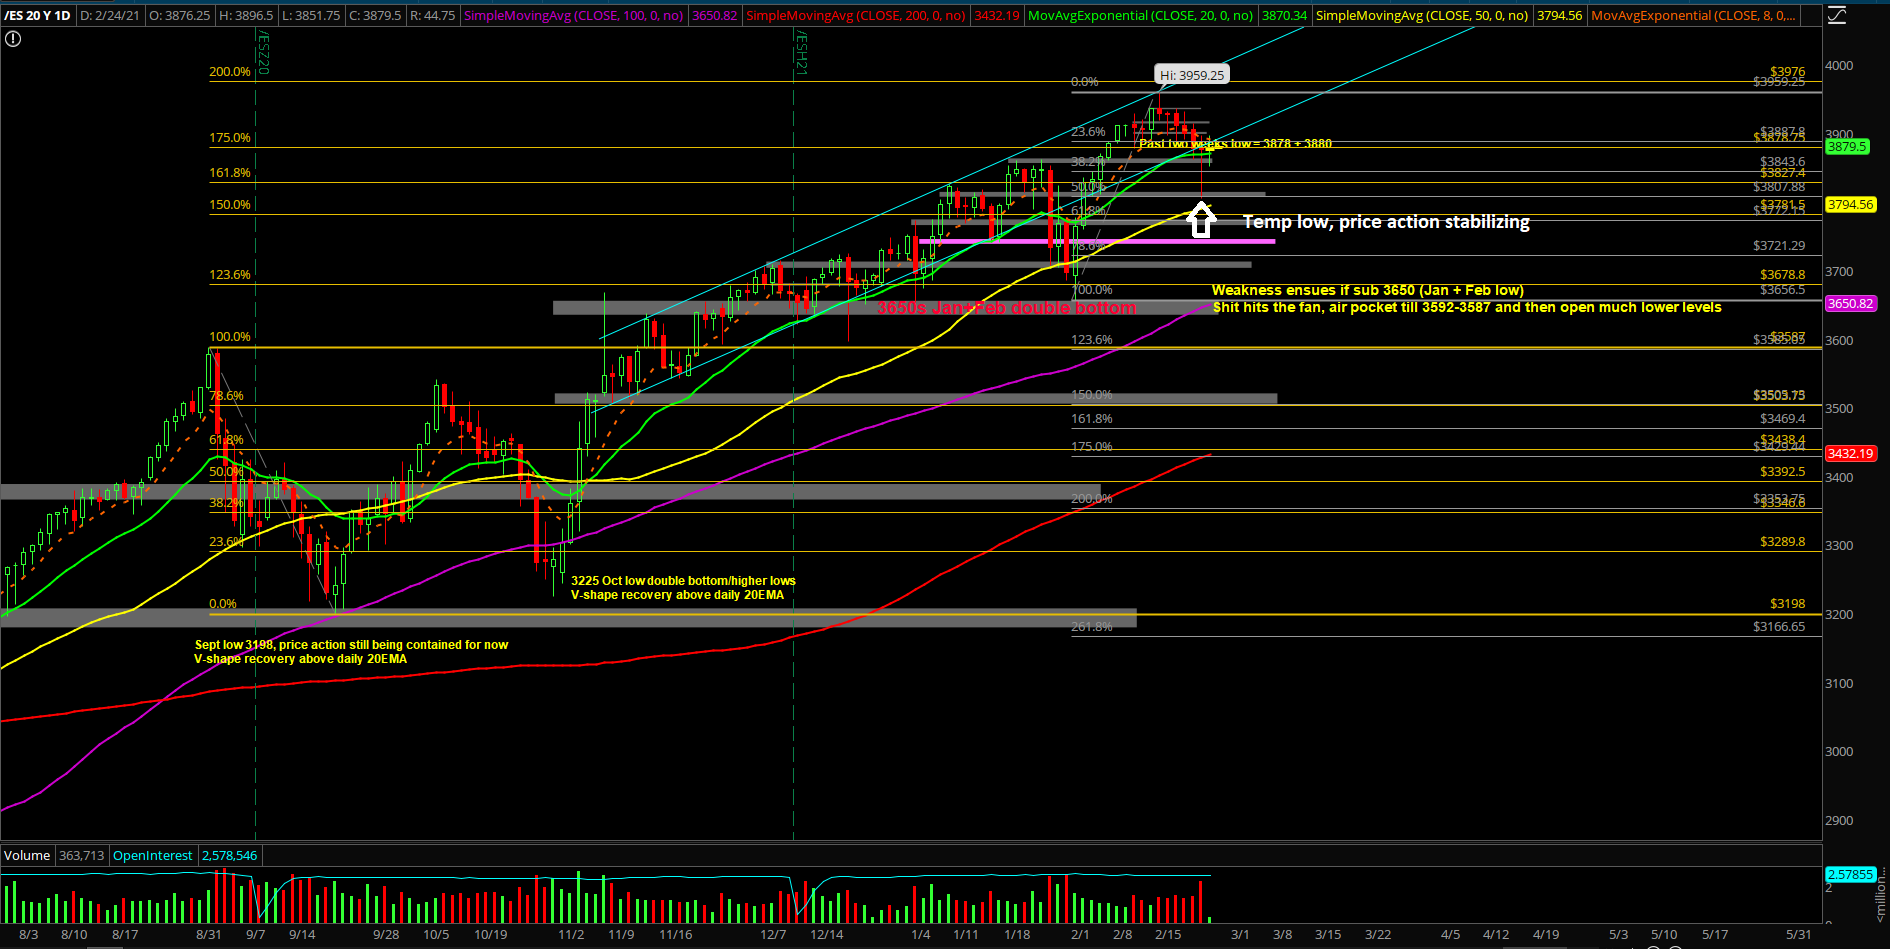
- The shit hits the fan (SHTF) level has moved up to 3650 from 3592, a daily closing print below 3650 is needed in order to confirm a temp top setup/reversal for the daily+weekly timeframe. (Janurary lows + Feb lows)
- A break below 3650 would be a strong indication of weakness given the multi-month trend of being above the daily 20EMA train tracks. For reference, the first week of 2021 (Jan 4th) bottomed out at 3650s vs the daily 20EMA/major support confluence area and then swiftly made new all time highs per our expectations as support held