Market Analysis for Feb 16th, 2021
 By
Ricky Wen
By
Ricky Wen
E-mini S&P 500 Futures: Keep It Simple Stupid –Nearing 3976 Target + Multi-Month Channel
Copying and pasting a core section from our ES trade alert room’s premarket gameplan report where we demonstrate real-time trades and educational lessons. FYI, the ES trade room provides real-time entries and exits with pre-determined stoploss and target levels alongside with real-time lessons on strategy/risk management/psychology/momentum. (some key levels have been redacted for fairness to subscribers)
Tuesday Feb 16 Gameplan
Did the bulls/bears fail overnight? What is the next highest probability plan
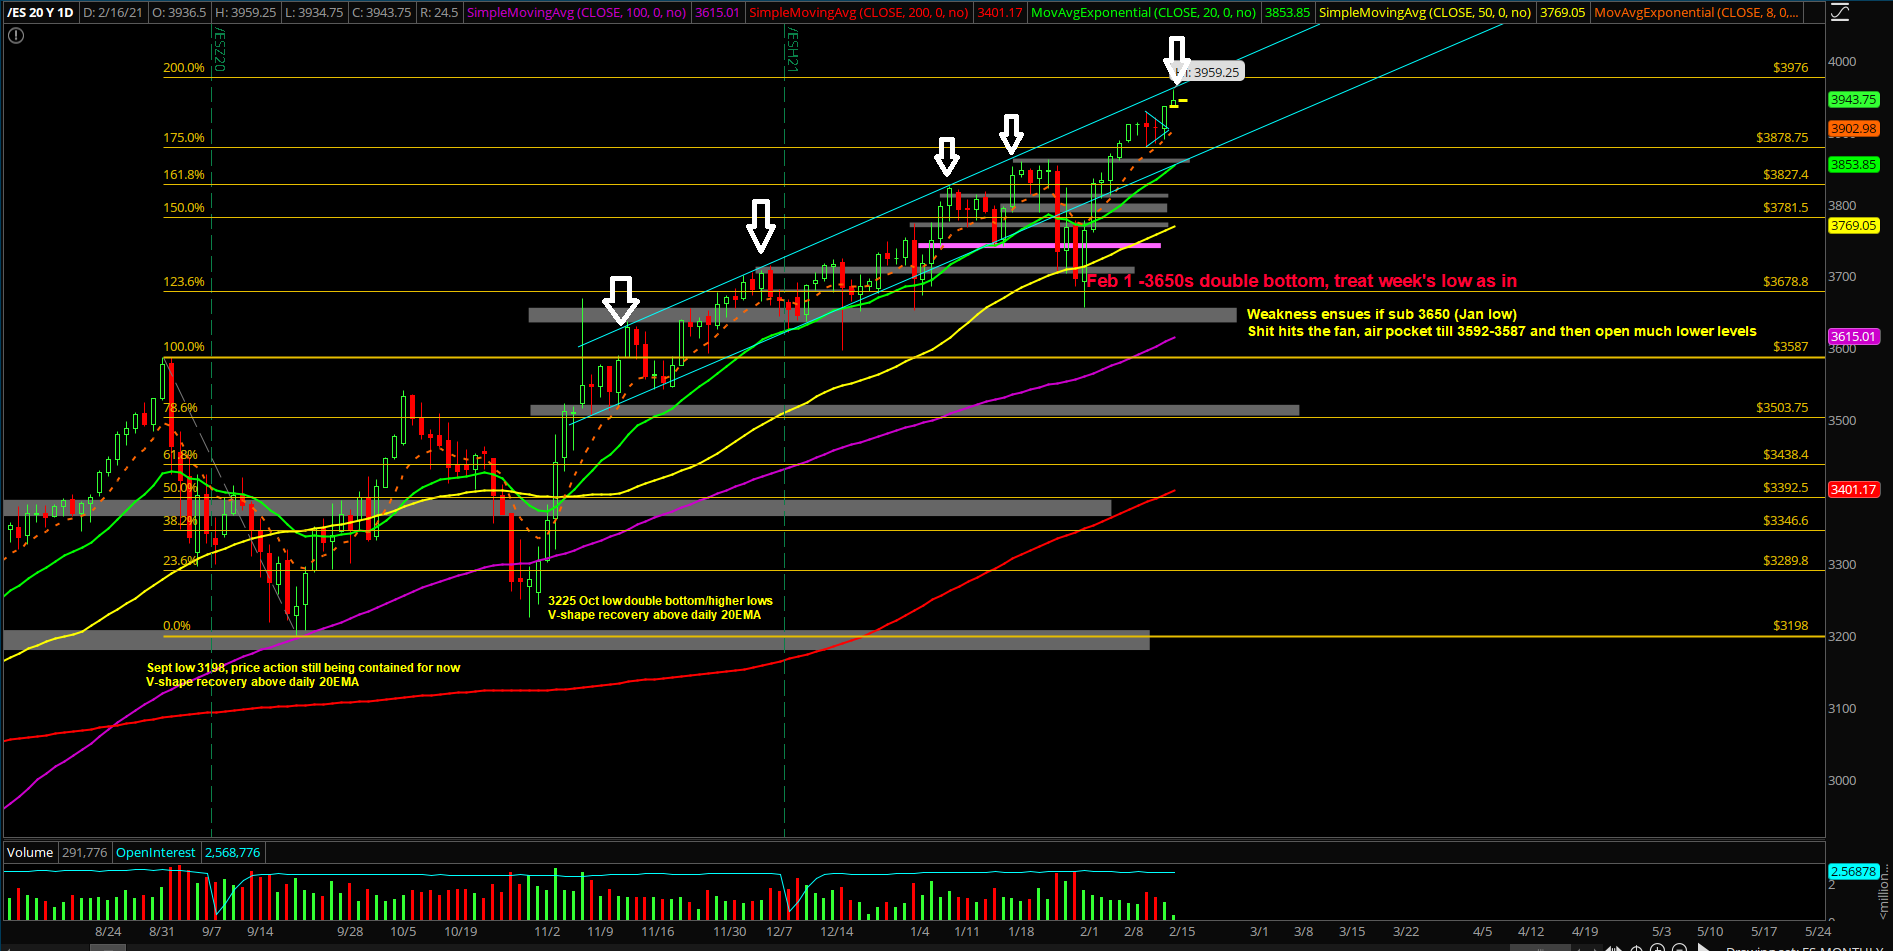
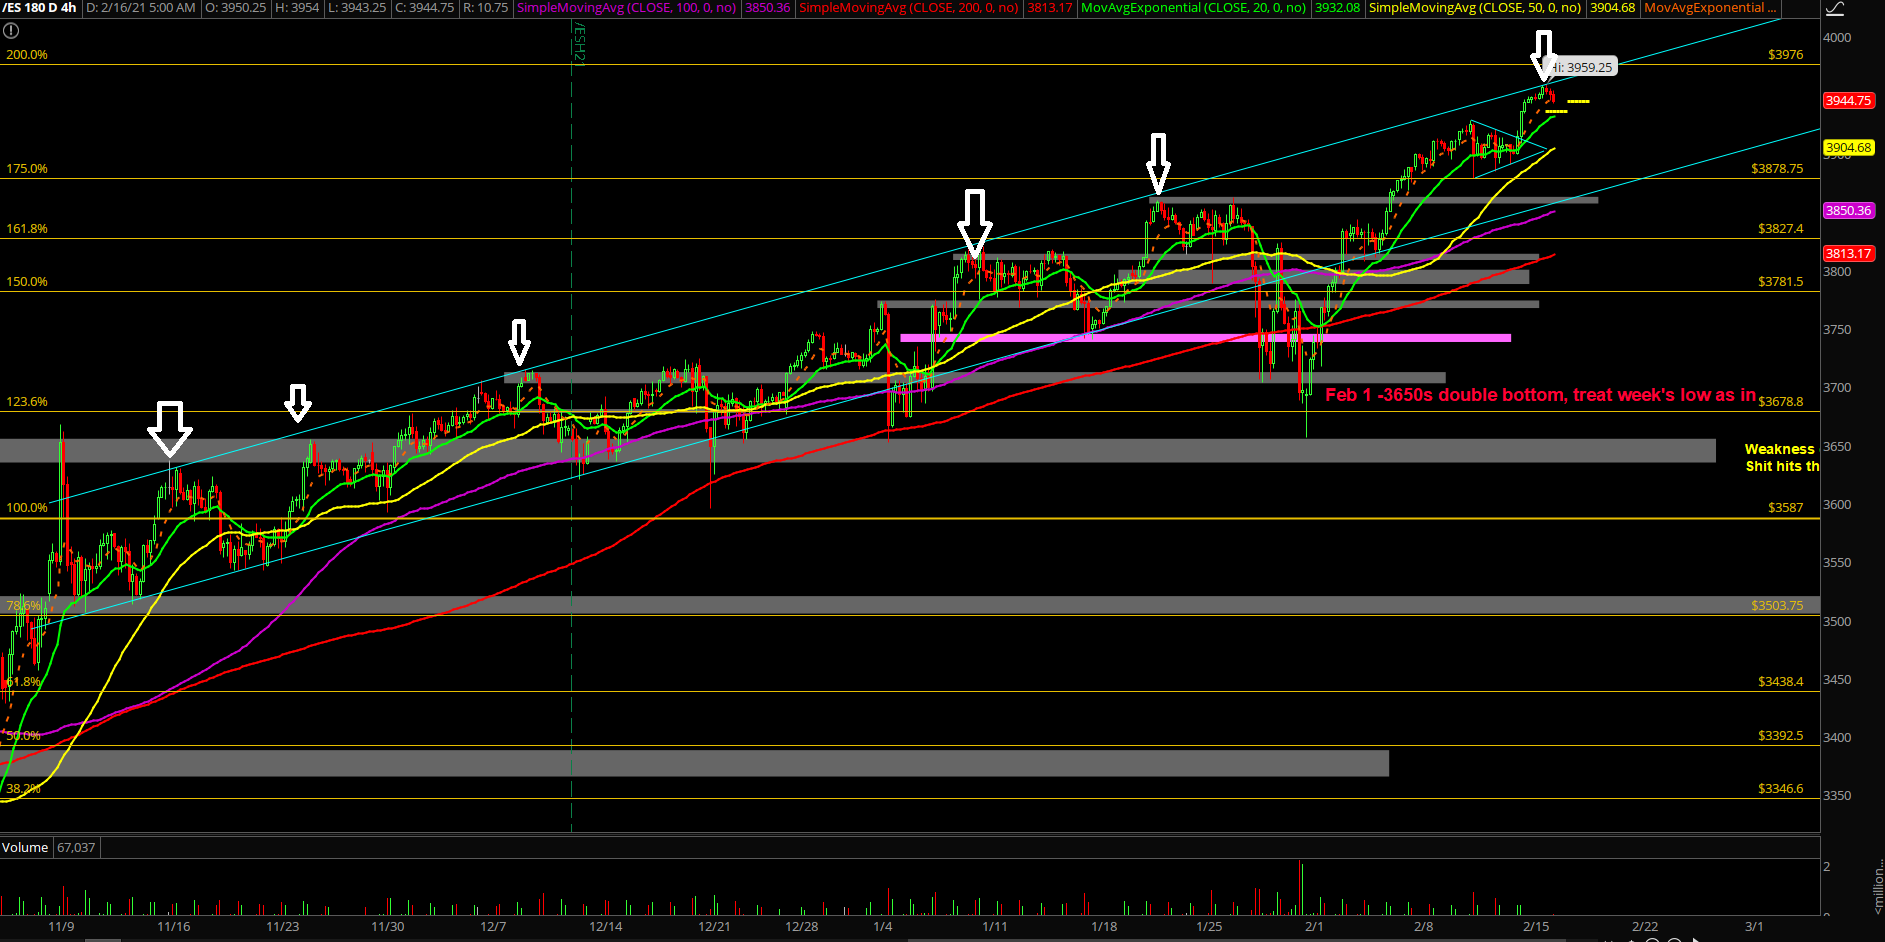
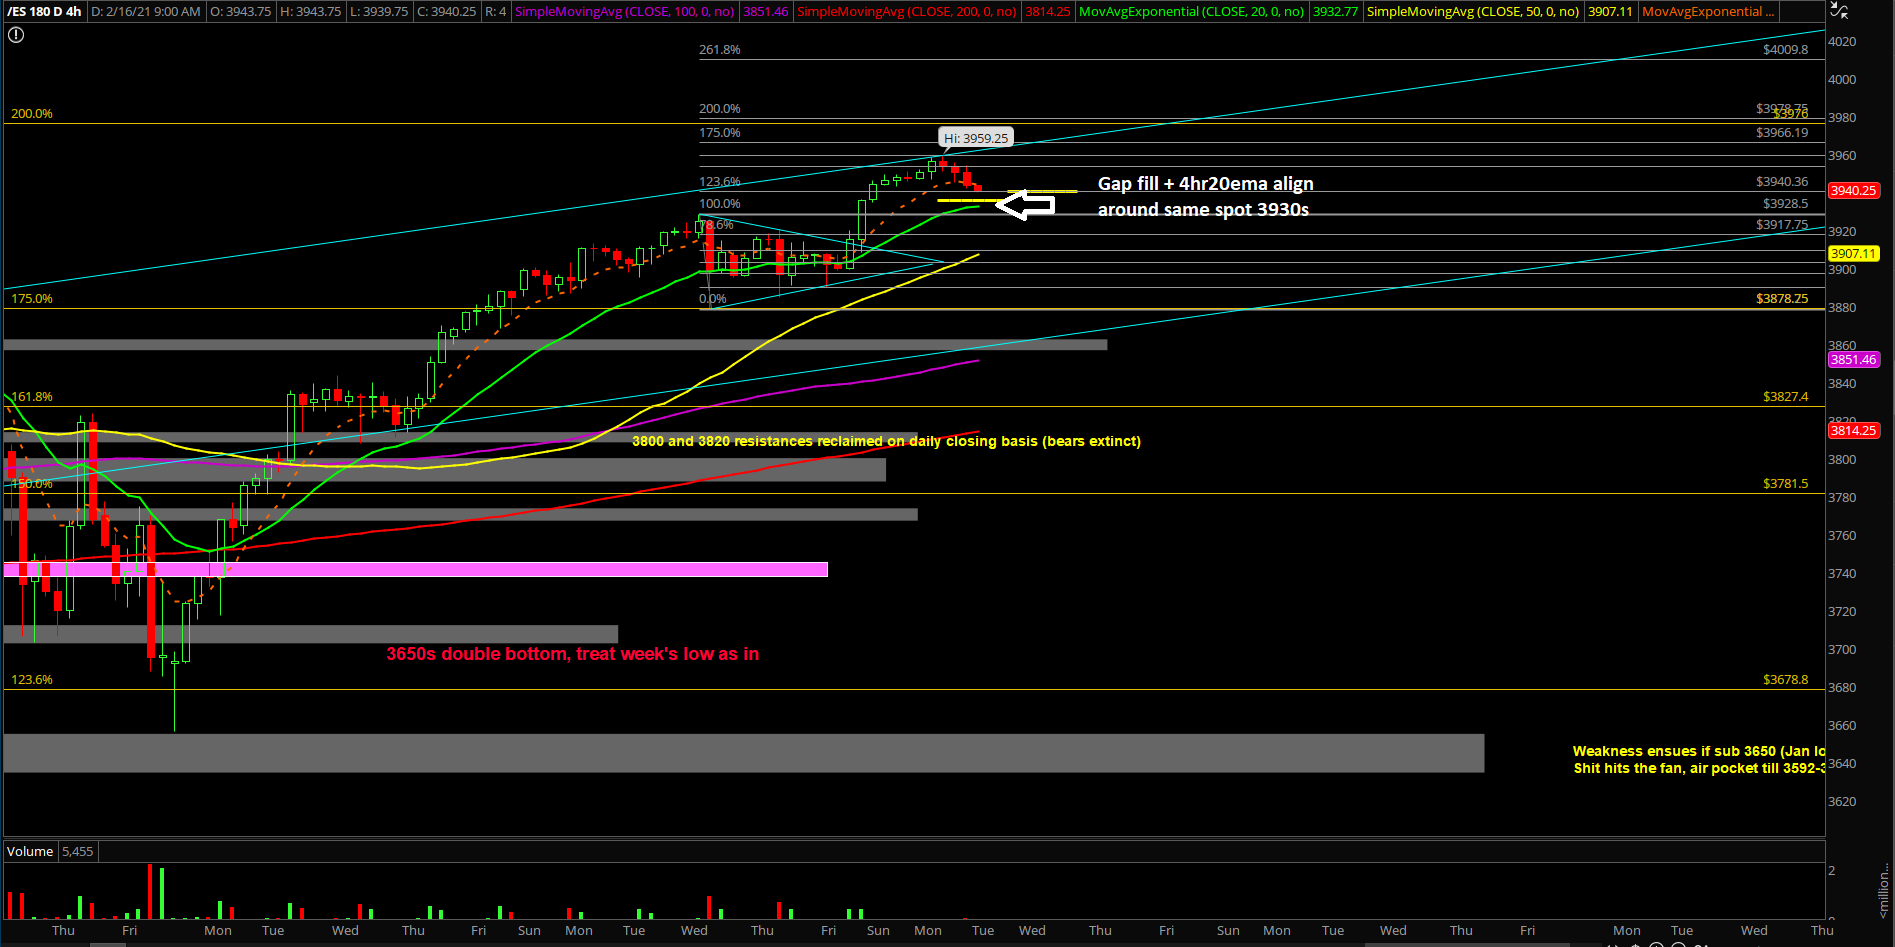
- Price made bullish continuation with higher lows and higher highs, O/N range= 3959.25-3943.25
- Short-term is a bit overextended given the past 2 weeks performance of +8% from 3650s lows to 3950s highs. Expect range/consolidation day for Tuesday unless >3959 immediately after open
- We continue to capture/buy the dips vs supports for quick on-trend trades while simulatenously being more cautious as we must hedge vs key levels as well. (2 weeks up in a row and hitting some key confluencs like multi-month channel highs and then 3976/4000 being so close)
What is the bias/gameplan going into today? Do you see a feedback loop setup?
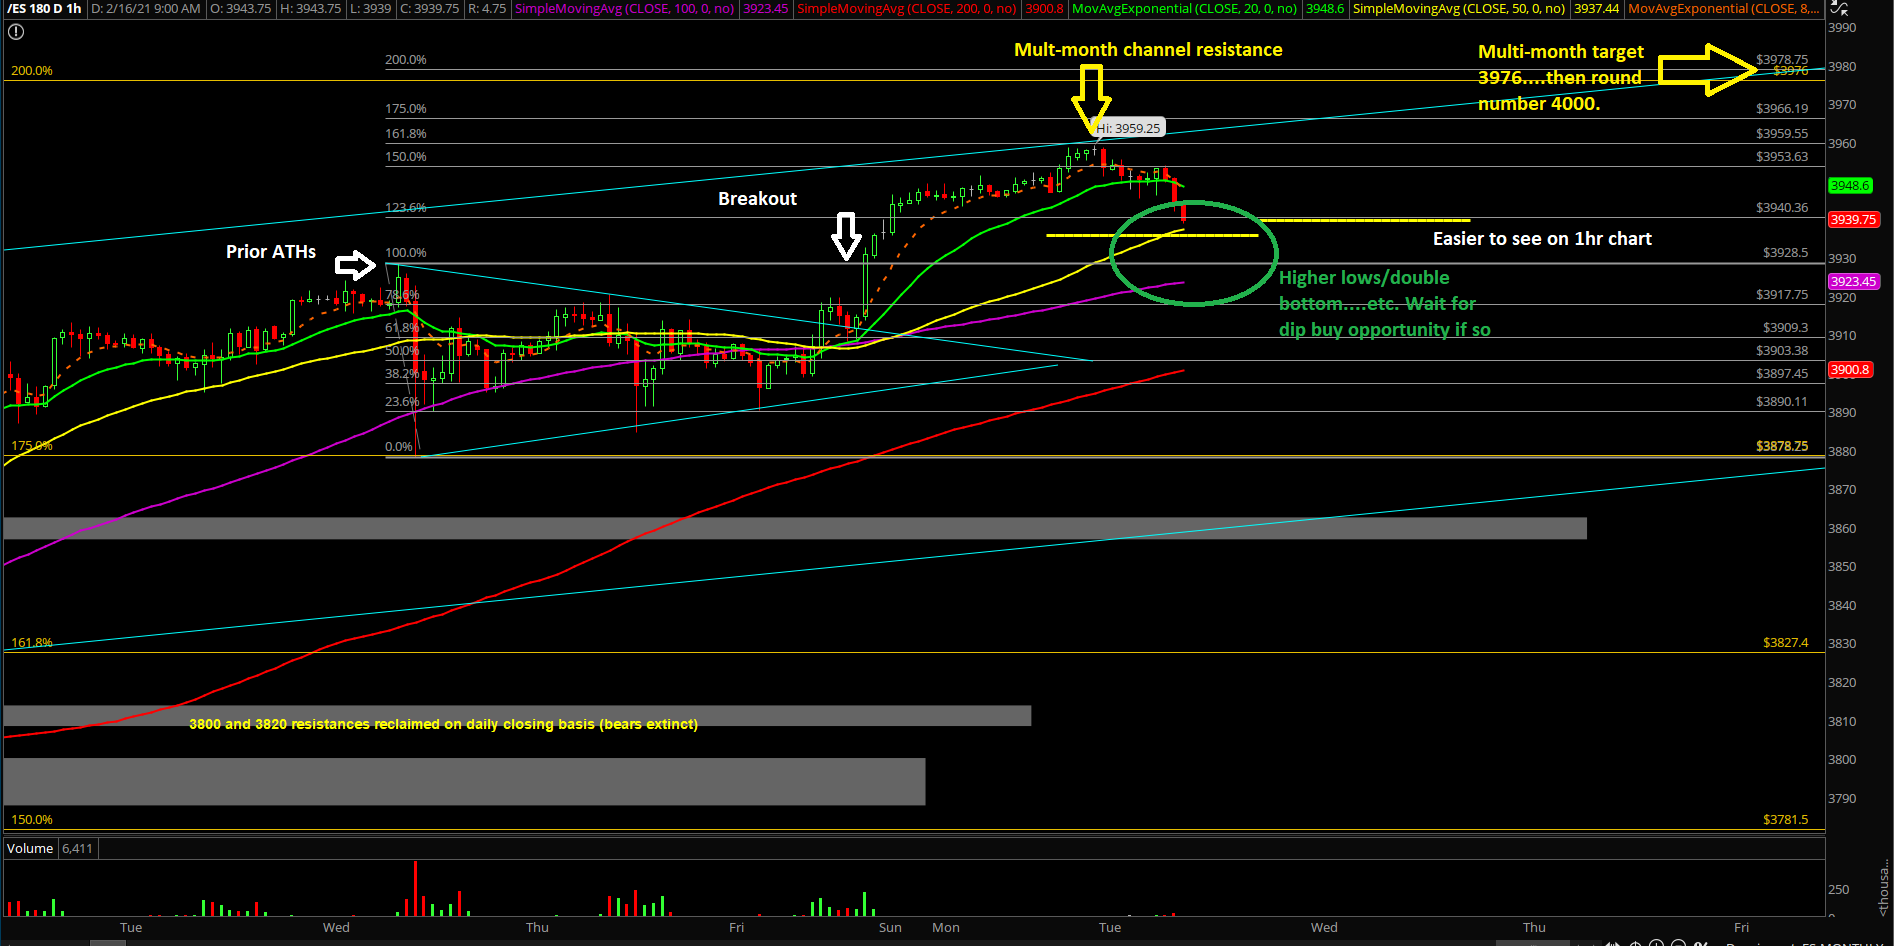
- Today is gapping up vs Friday’s closing price and price has temporarily rejected vs the November multi-month uptrend channel.
- We’re expecting some sort of horizontal/shallow range day as price likely needs some sort of digestion again before it could ramp higher
- Need to see how the RTH open goes, does it gap fill 3930s immediately or break above 3959+ to decide an immediate trend day. Adapt accordingly
- Going into this week, the must hold support is located at 3878, which was last week’s low
- Today, the immediate trending supports are 3935/3920/3913 for dip buying setups
Bulls remain in full control on the higher timeframes:
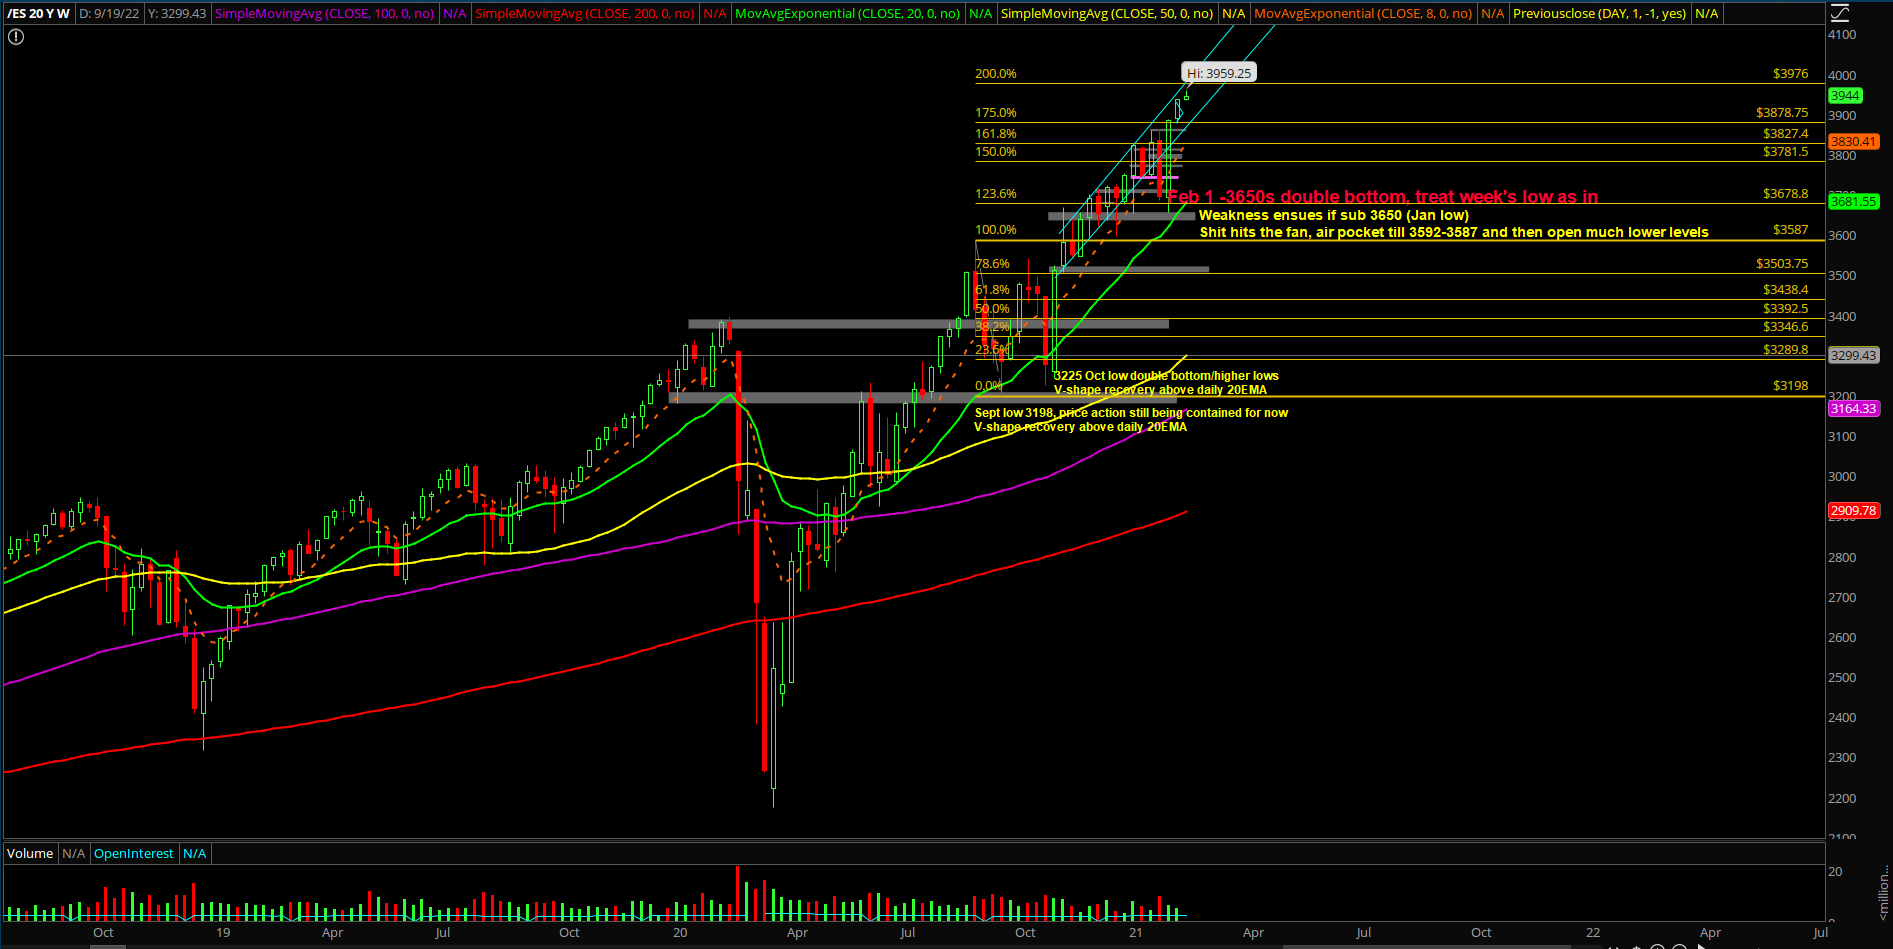
- If you recall, the first week of Feb was a massive bull reversal that made +5% gains vs the last week of Jan. The intra week range was +6% from low to highs (3650s->3880s)
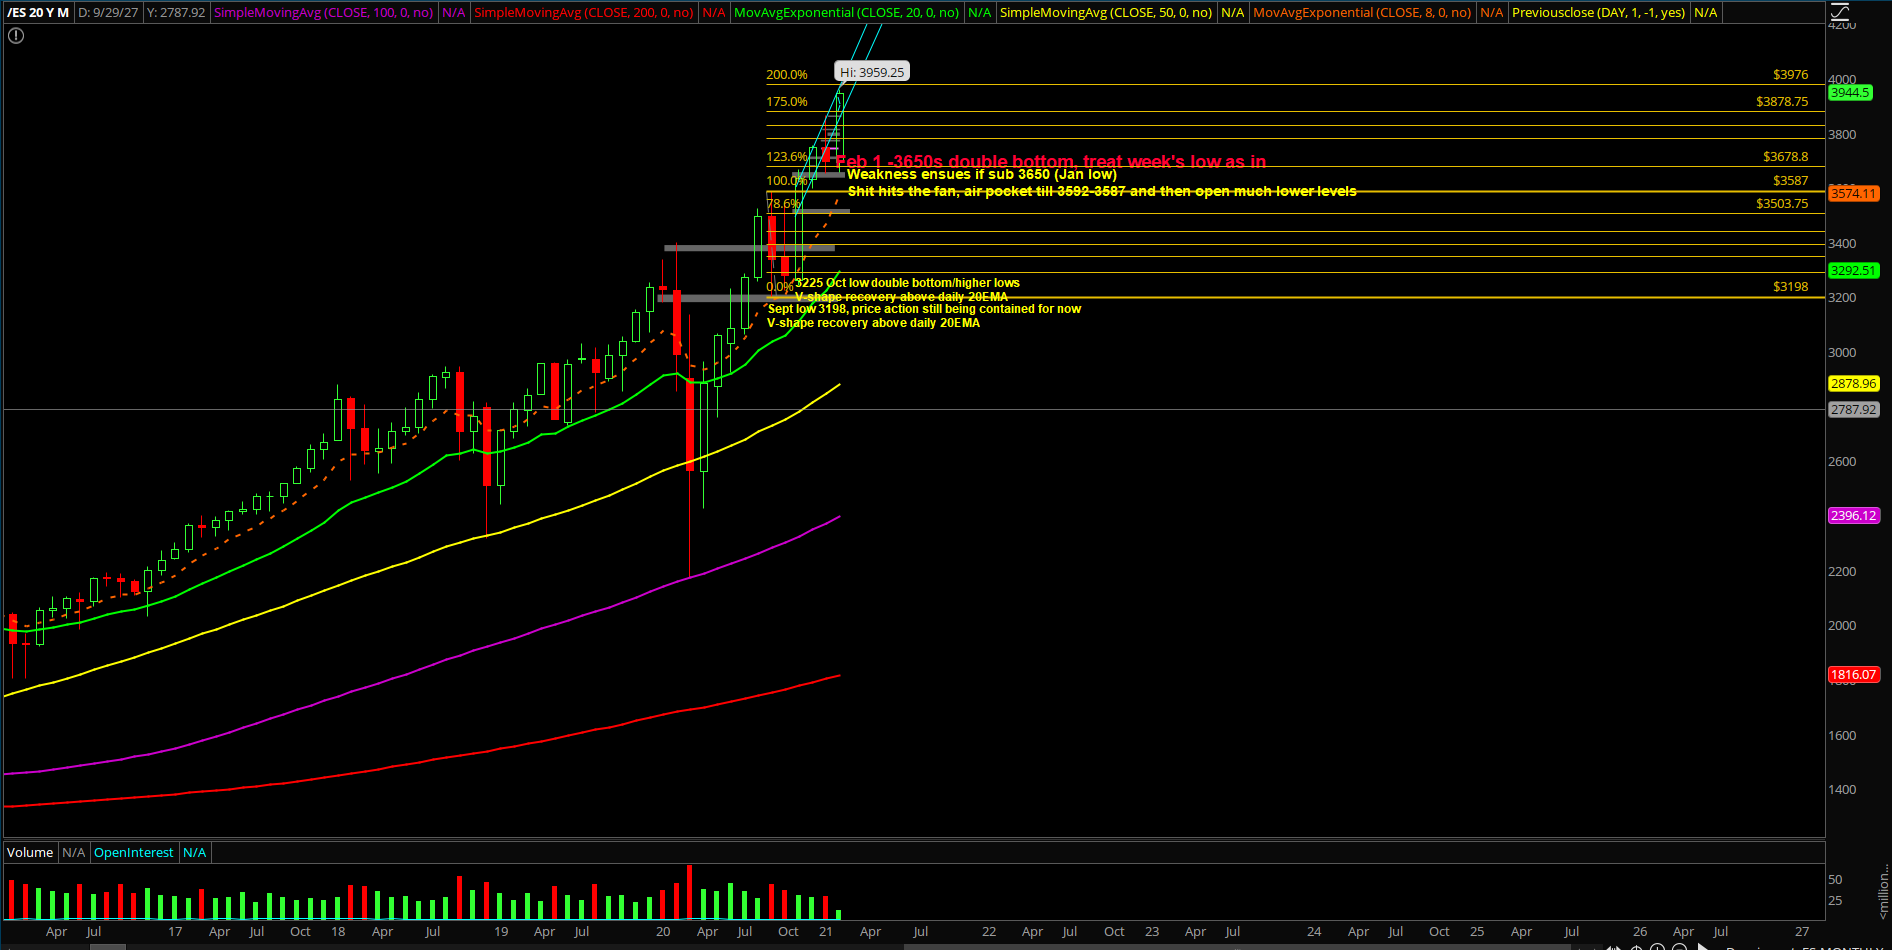
- Market produced a follow through during the second week by closing at the highs of 3930s. The action is now very close towards our 3976 measured move target (calculated many months ago since the 3587 breakout setup)
- Heading into the third week of Feb, we needed to be aware that it consists of two scenarios; some healthy consolidation first half of week or the train keeps accelerating/embedding higher without any retracement more than 23.6%. For reference, during the first two weeks of Feb, there were no dip/retracement that even pulled back into 23.6% indicating insane bullish momentum and bear extinction
- Additional context: it’s been 2 weeks up in a row +8% so some healthy digestion/consolidation is not out of the question. Basically, price went from backtesting the 2 std lows (3650s) to V-shape recovery into new 2 std highs (3950s) on the daily chart. Obviously, this is not the spot to bet the farm after +8% as price action has also hit the multi-month uptrend channel from November 2020. Hedge accordingly vs key levels/confluence if you’re one of the folks running an uber bullish portfolio like us (eg. we demonstrated in real-time how you could hedge during Wednesday Feb 10 with little initial risk using our key levels + alerts in our ES room)
- Bigger picture wise, the first week of Feb’s massive bull engulf candle could act as the ongoing monthly low (3657s) for the foreseeable future as the rest of this month continues to make higher lows and higher highs on the daily/weekly timeframes. Know your timeframes!
Additional context from past few weeks remain mostly unchanged (copied and pasted):
- The shit hits the fan (SHTF) level has moved up to 3650 from 3592, a daily closing print below 3650 is needed in order to confirm a temp top setup/reversal for the daily+weekly timeframe. (Janurary lows)
- A break below 3650 would be a strong indication of weakness given the multi-month trend of being above the daily 20EMA train tracks. For reference, the first week of 2021 (Jan 4th) bottomed out at 3650s vs the daily 20EMA/major support confluence area and then swiftly made new all time highs per our expectations as support held