Market Analysis for Feb 8th, 2021
 By
Ricky Wen
By
Ricky Wen
E-mini S&P 500 Futures: Keep It Simple Stupid –Massive Weekly Bull Engulf, Watching Follow Through
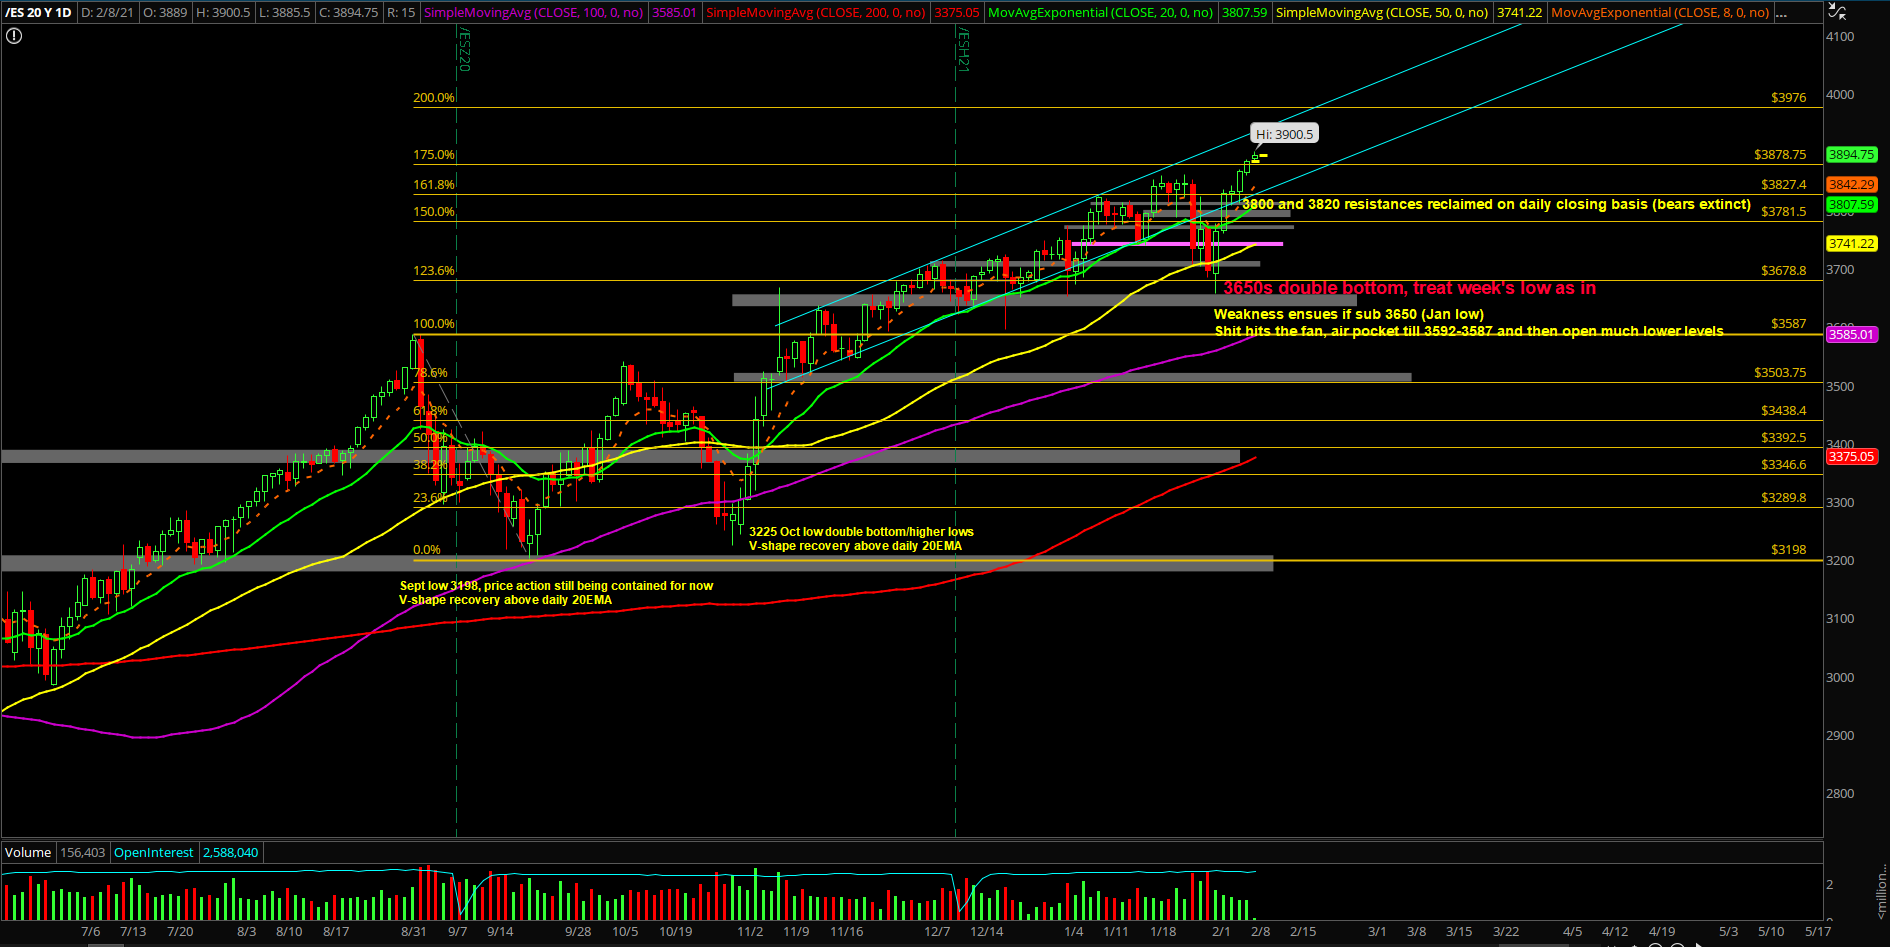
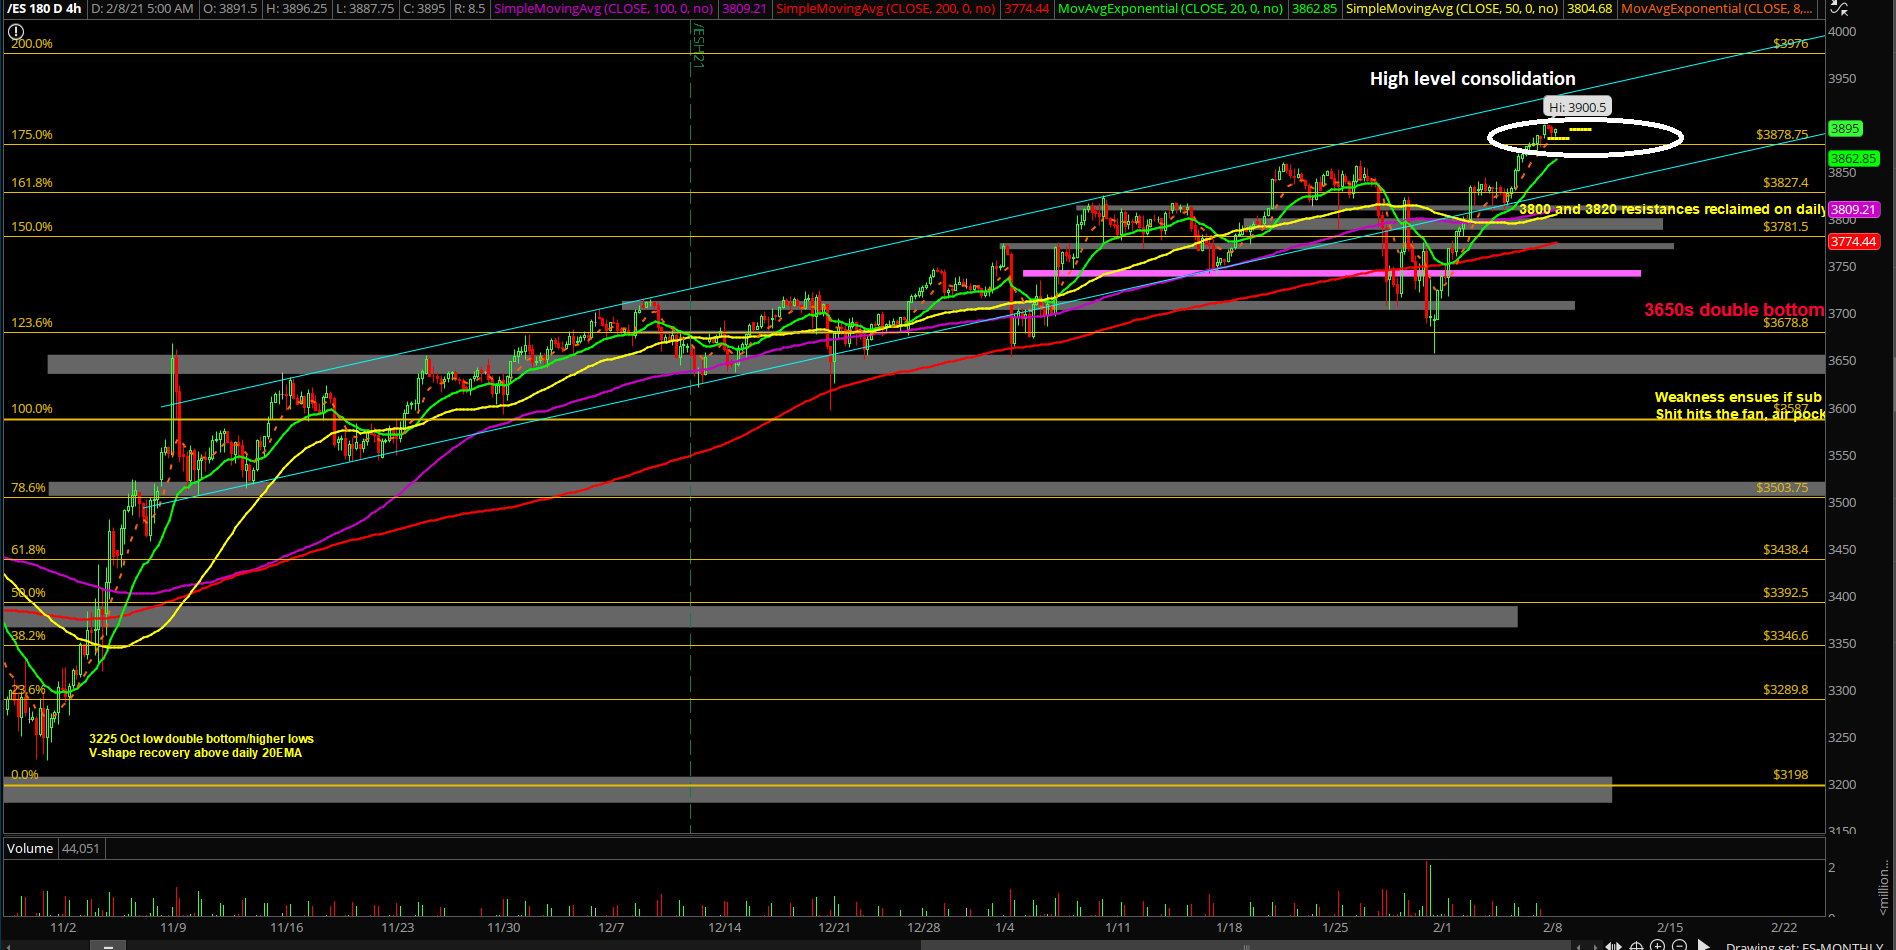
The first week of Feb played out as a massive V-shape recovery as the bears could not sustain below the trending daily 8/20EMA resistance for more than a week. If you recall, the previous Monday confirmed the double bottom at 3650s vs the January monthly low of 3650. This paved the way for a V-shape recovery as bulls reclaimed one key level after another such as 3750/3800/3820…etc.
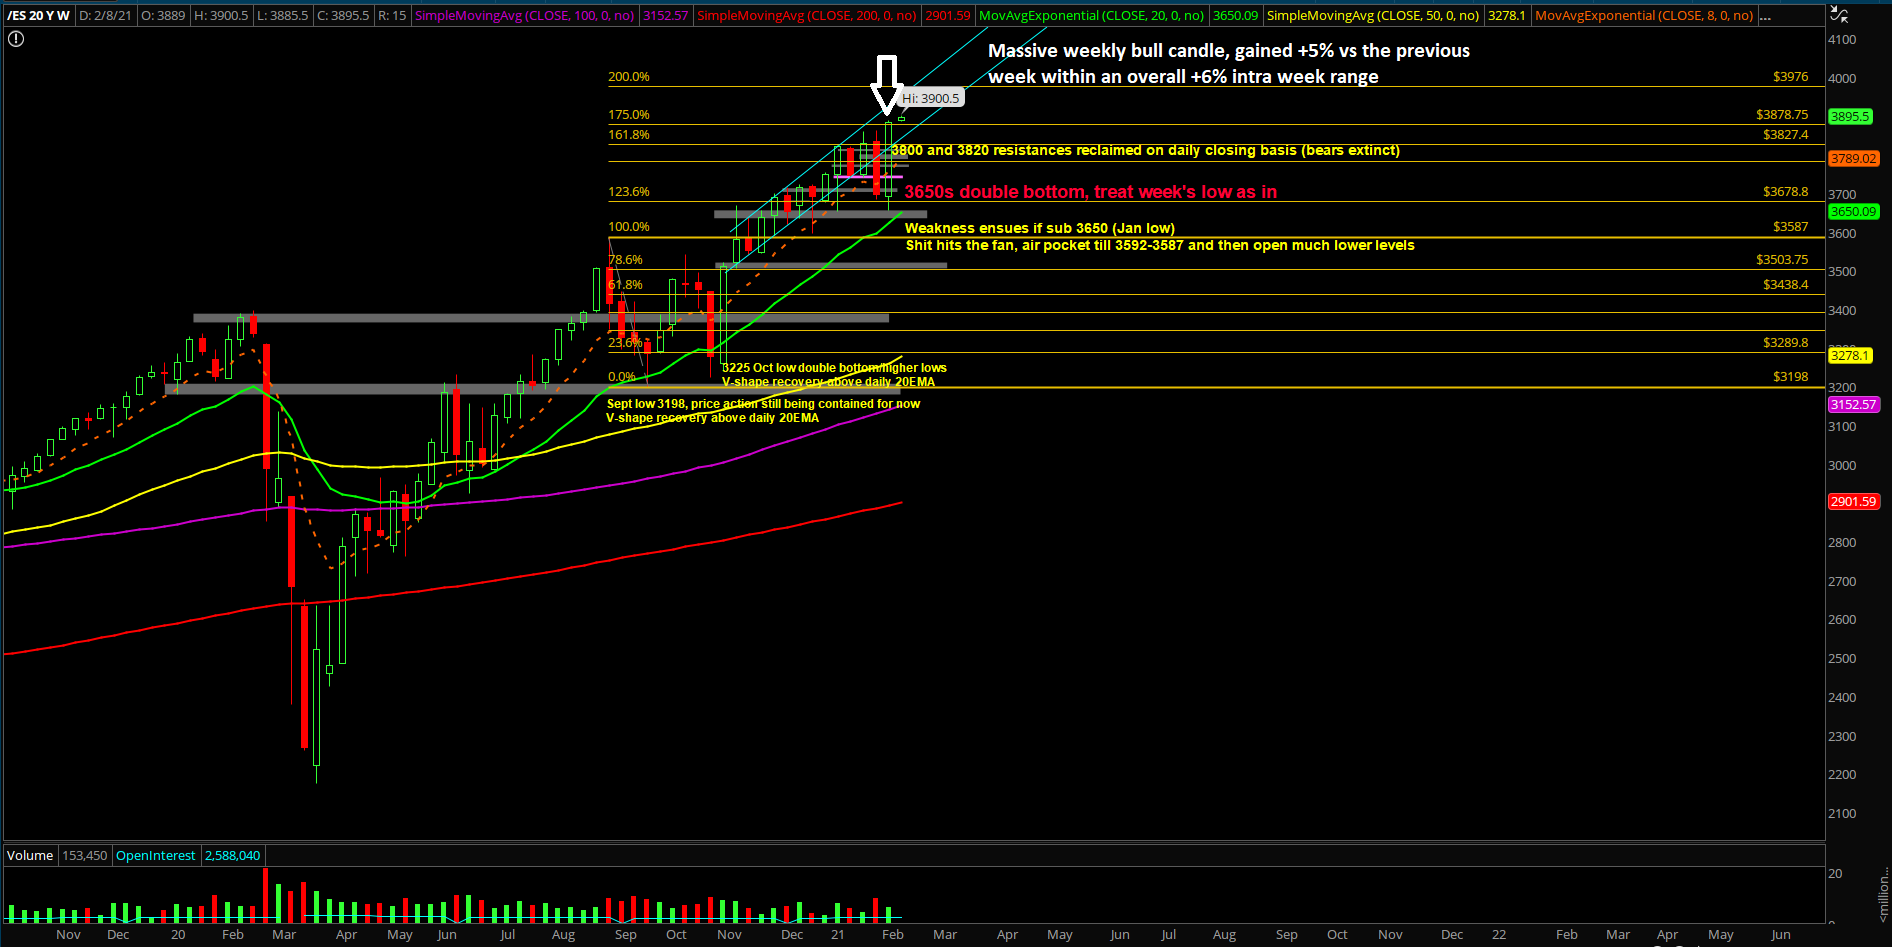
The main takeaway is that it was a massive +5% weekly gain vs the last week of Jan indicating that bulls remain in full control. The weak hands got shook out and the money rotated right back into buying some key stocks to drive the market up. The most important thing to understand here is that we’re treating February’s monthly low as in already given the setup. This makes the rest of our month easier when we have such a strong opening week. Know your timeframes.
What’s next?
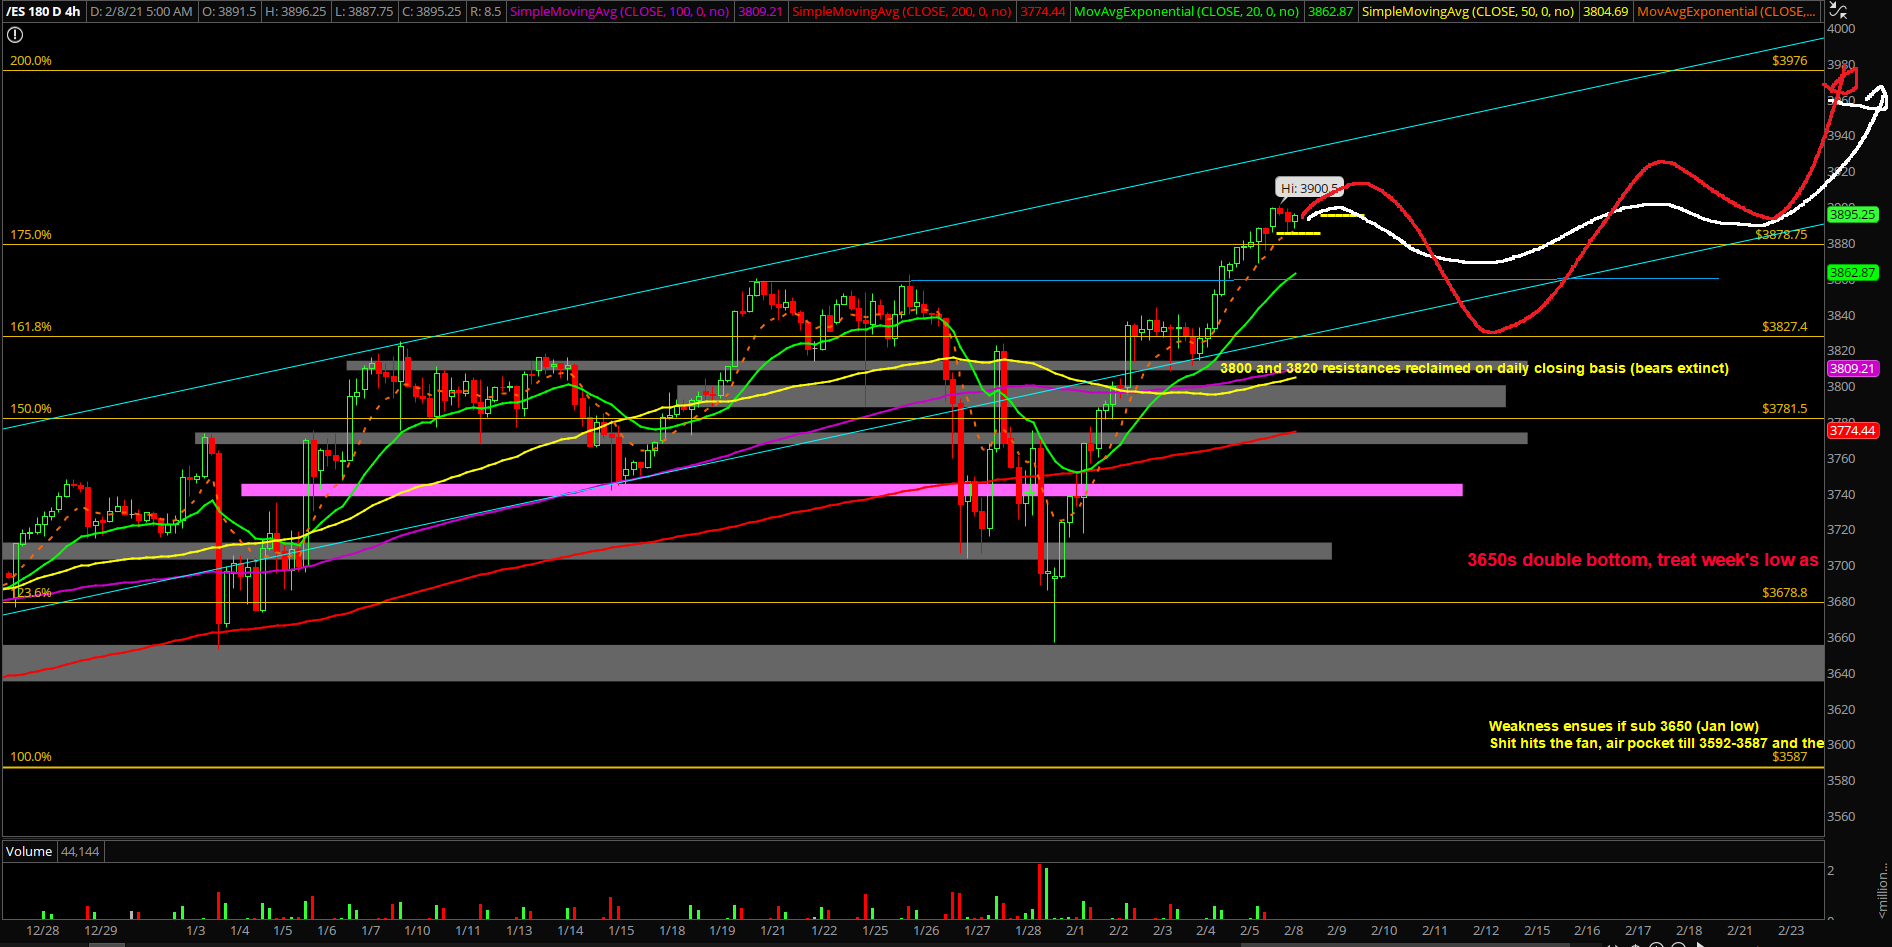
Friday closed at 3884.75 around the high of the week as expected given the stats + the context being a massive trend week up from Monday-Thursday. No surprises. Just be aware that 3900 is a key round number and market loves to stall around every 100 points and especially after a massive +5% weekly run or +6% from low to highs.
Copying and pasting a core section from our ES trade alert room’s premarket gameplan report where we demonstrate real-time trades and educational lessons. FYI, the ES trade room provides real-time entries and exits with pre-determined stoploss and target levels alongside with real-time lessons on strategy/risk management/psychology/momentum. (some key levels have been redacted for fairness to subscribers)
- See 4hr white vs red line projections towards 3976 as our roadmap/visual aid, adapt
- If you recall, the first week of Feb was a massive bull trend that closed made +5% gains vs the last week of Jan. The intra week range was +6% from low to highs (3650s->3880s)
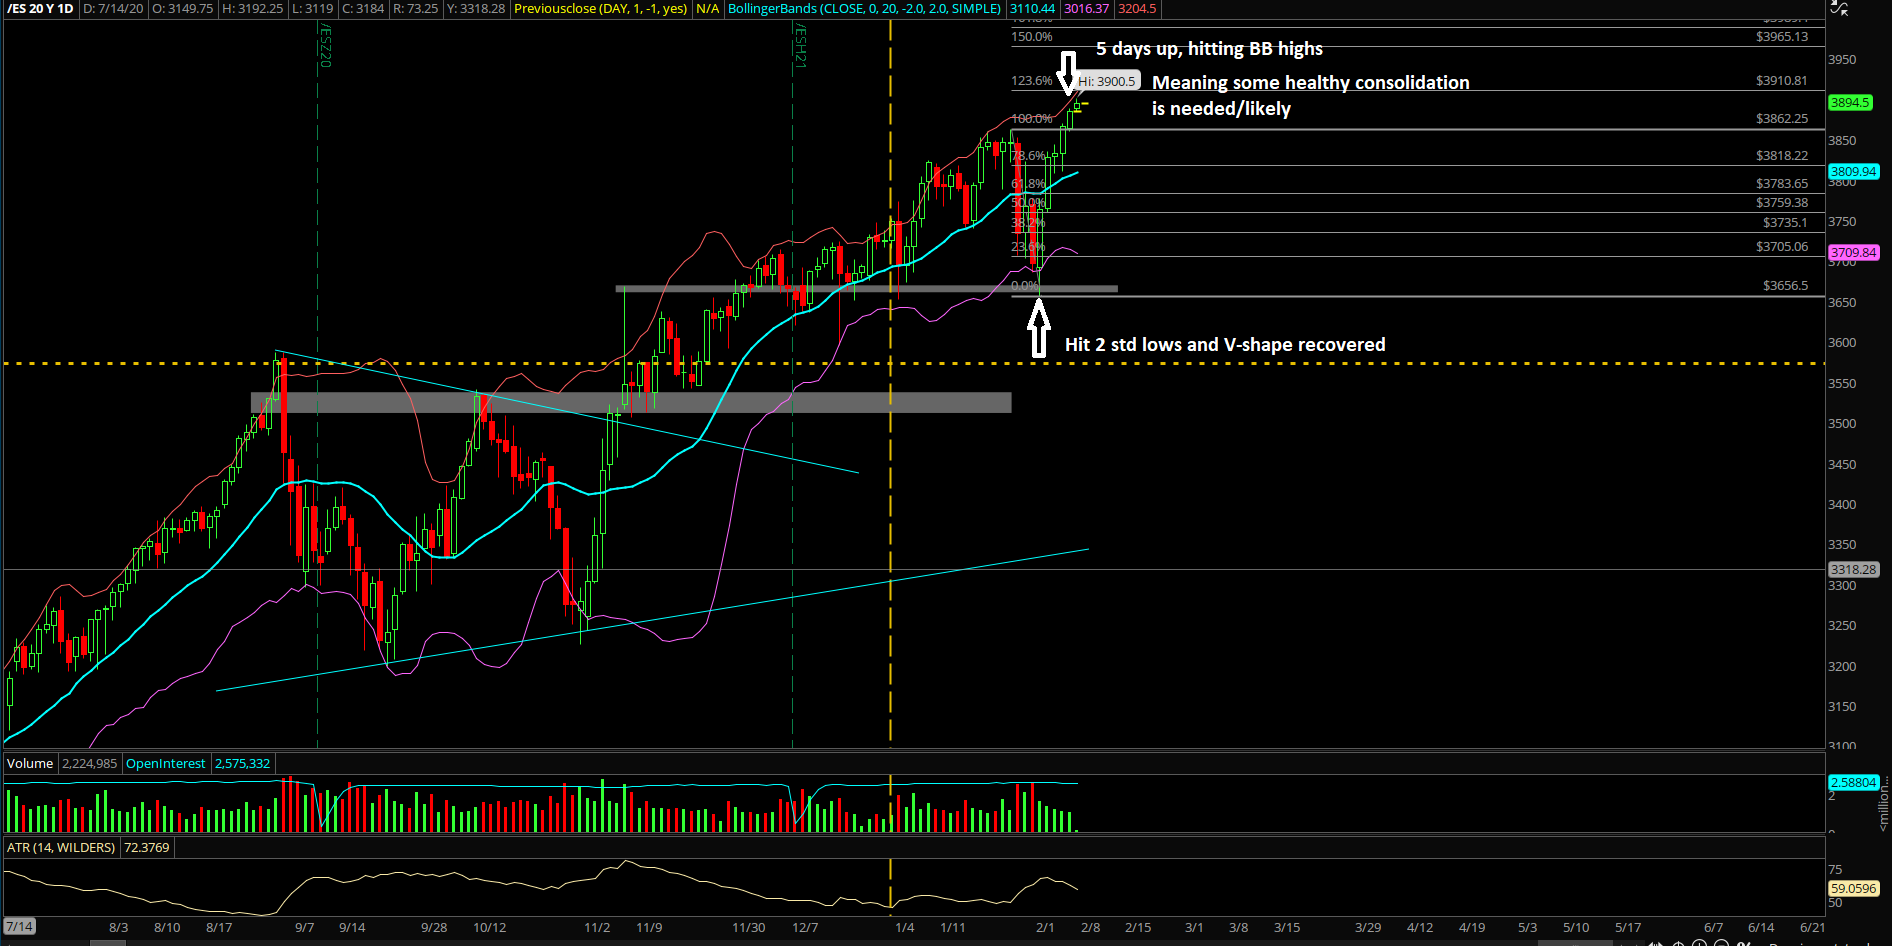
- Heading into this week, just need to be aware that it consists of two scenarios; some healthy consolidation first during the early week or the train keeps accelerating/embedding higher without any retracement more than 23.6%. For reference, during the first week of Feb, there was no dip/retracement that even pulled back into 23.6% indicating insane bullish momentum and bear extinction.
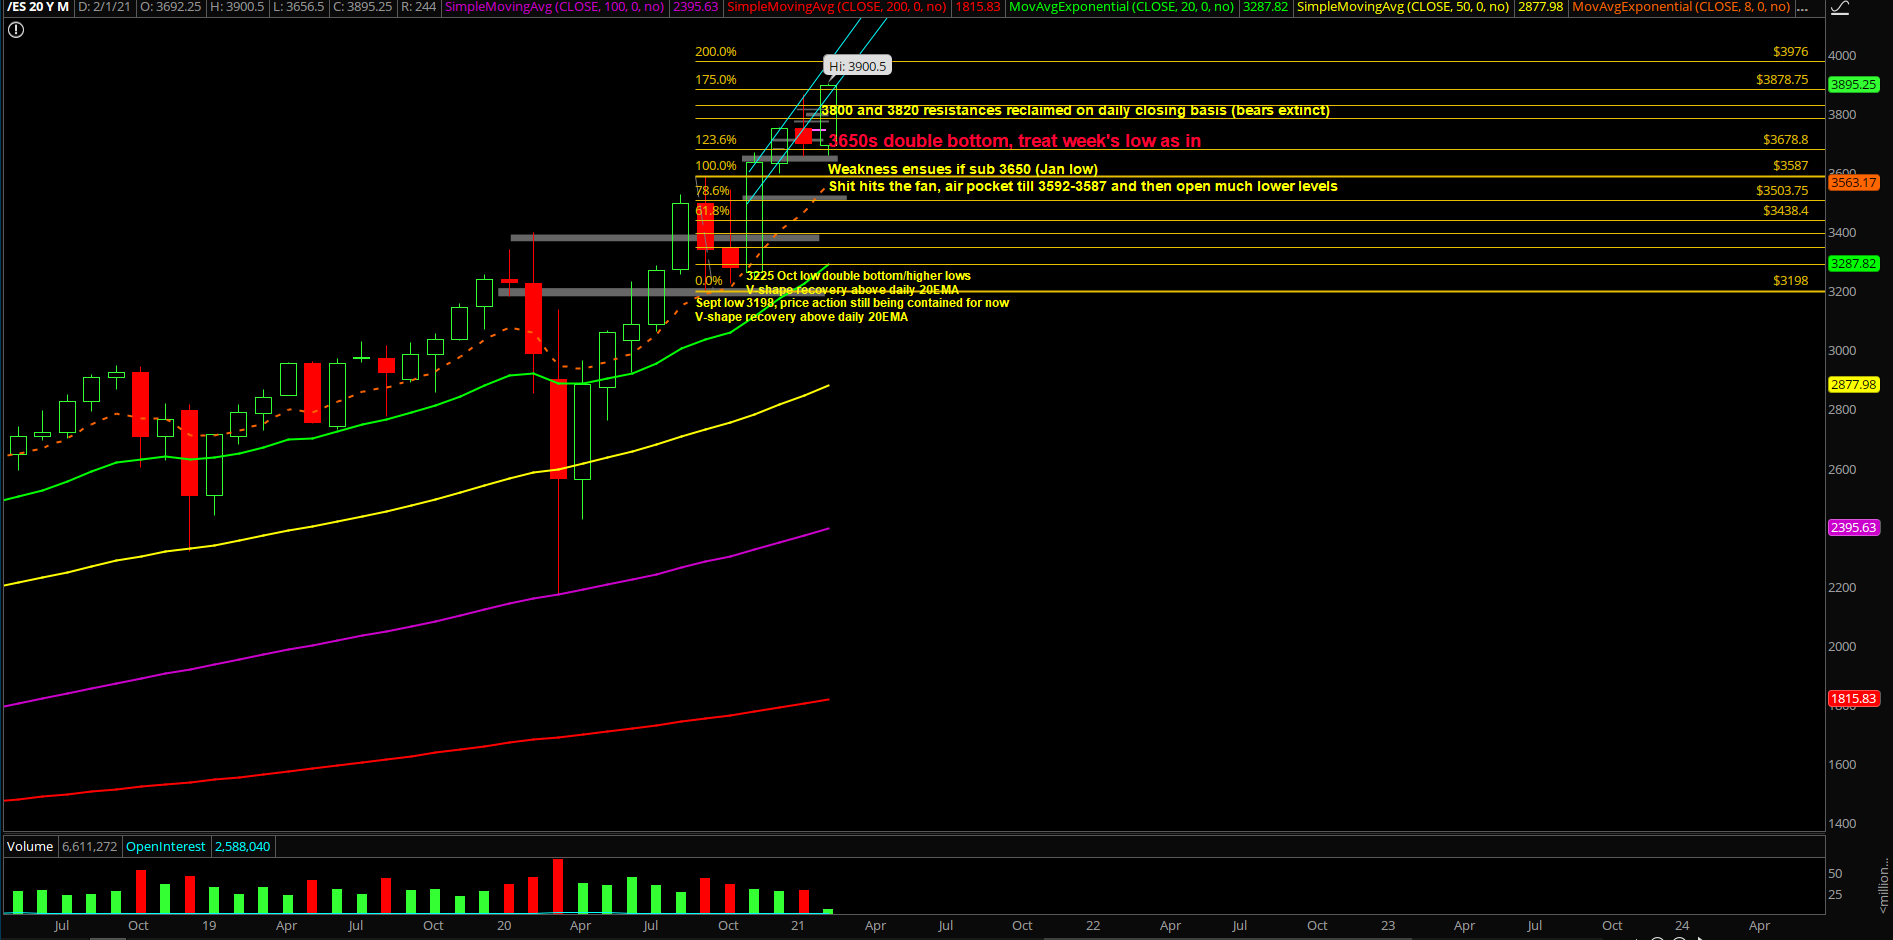
- Market has recovered 100% of Jan 25-29 range and keep on making new all time highs, price action is now very close towards our 3976 measured move target (calculated many months ago since the 3587 breakout setup)
- It’s been 5 days up and price went from backtesting the 2 std lows to V-shape recovery into new 2 std highs on the daily chart. Obviously, this is not the spot to bet the farm after +5-6%
- Bigger picture wise, the first week of Feb’s massive bull engulf candle could act as the ongoing monthly low (3657s) for the foreseeable future as the rest of this month continues to make higher lows and higher highs on the daily/weekly timeframes. Know your timeframes !
Additional context from past few weeks remain mostly unchanged (copied and pasted):
- The shit hits the fan (SHTF) level has moved up to 3650 from 3592, a daily closing print below 3650 is needed in order to confirm a temp top setup/reversal for the daily+weekly timeframe. (Janurary lows)
- A break below 3650 would be a strong indication of weakness given the multi-month trend of being above the daily 20EMA train tracks. For reference, the first week of 2021 (Jan 4th) bottomed out at 3650s vs the daily 20EMA/major support confluence area and then swiftly made new all time highs per our expectations as support held