Market Analysis for Jan 28th, 2021
 By
Ricky Wen
By
Ricky Wen
E-mini S&P 500 Futures: Keep It Simple Stupid – Decisively Broke Below Daily 20EMA, First Time In Months
Sharing the entire pre-market game plan report from Ricky’s ES Trade Alerts room for today only. No key levels have been redacted in this report unlike the usual KISS reports. Level by level approach. Know your timeframes. Enjoy!
Thursday Jan 28 Gameplan (Let the price action dictate our actions)
Did the bulls/bears fail overnight? What is the next highest probability plan
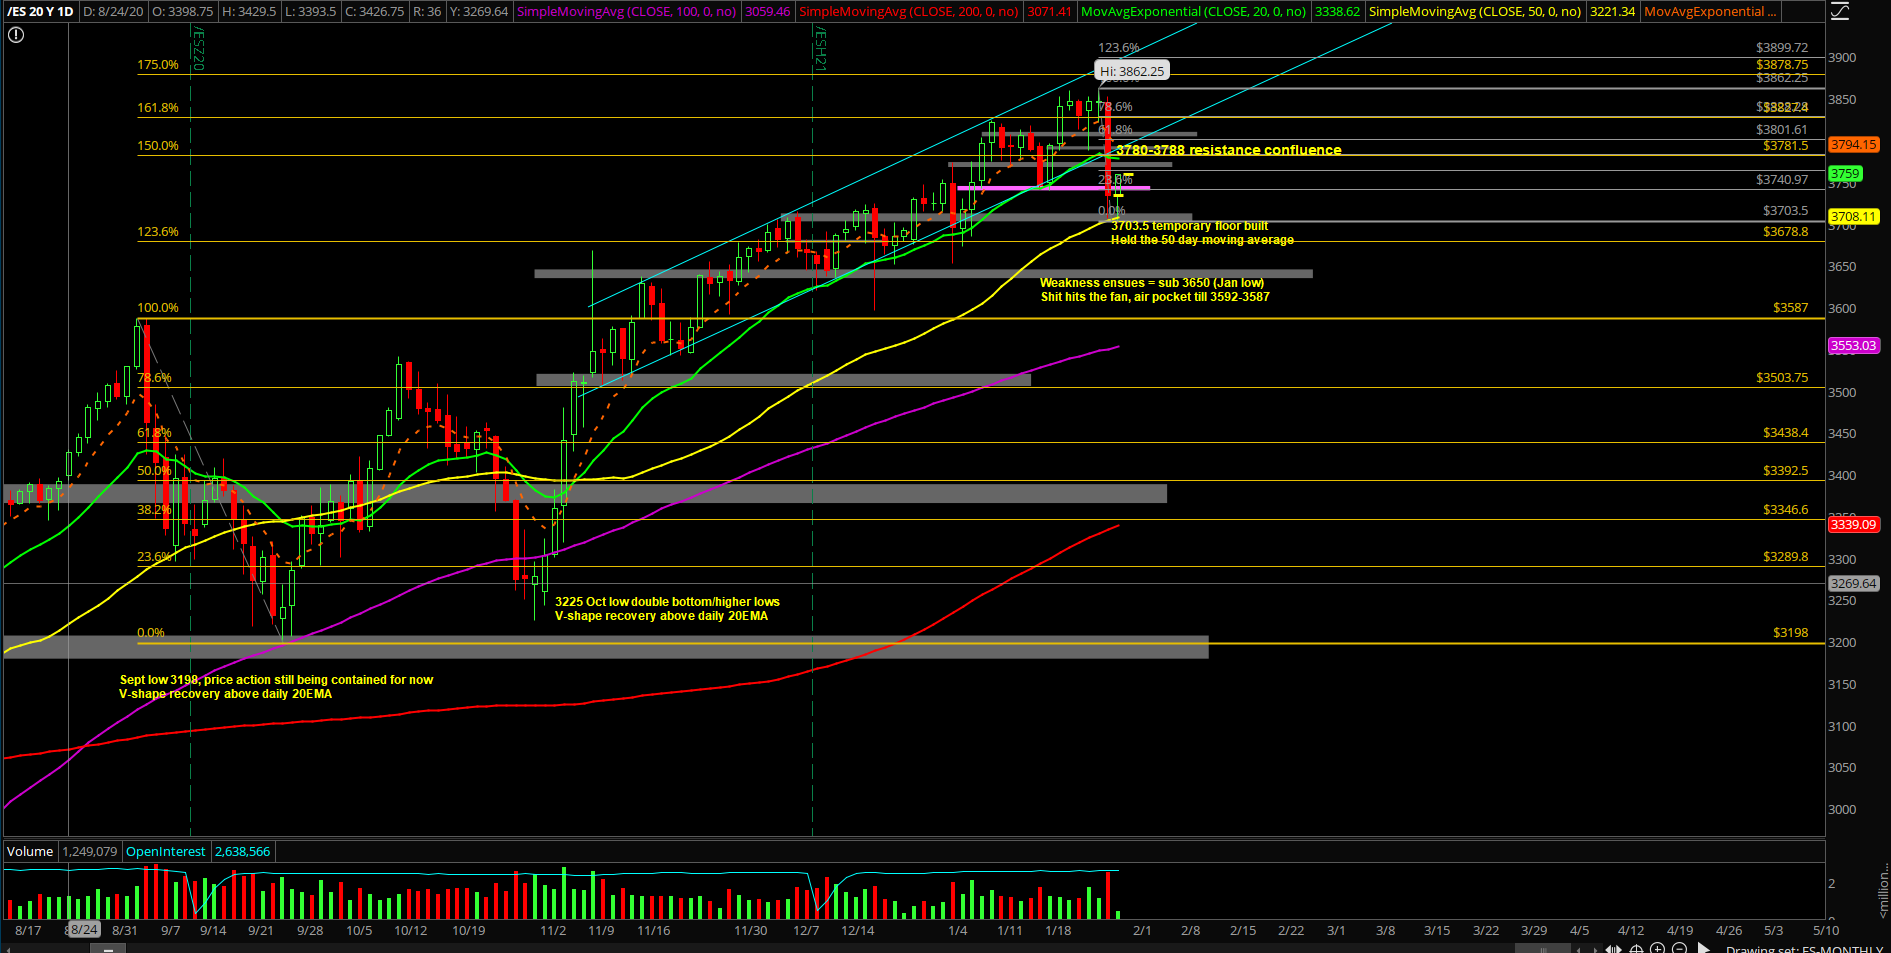
- Overnight bulls found temporary floor at the 3700-3705 region that we mentioned for the backfill into 3750/3780 targets/resistances. As of writing, price is at ES 3764
- Overnight range = 3764.75-3703.5 so be aware that today could be an inside range day trading within yesterday’s massive range of 3853-3706.5
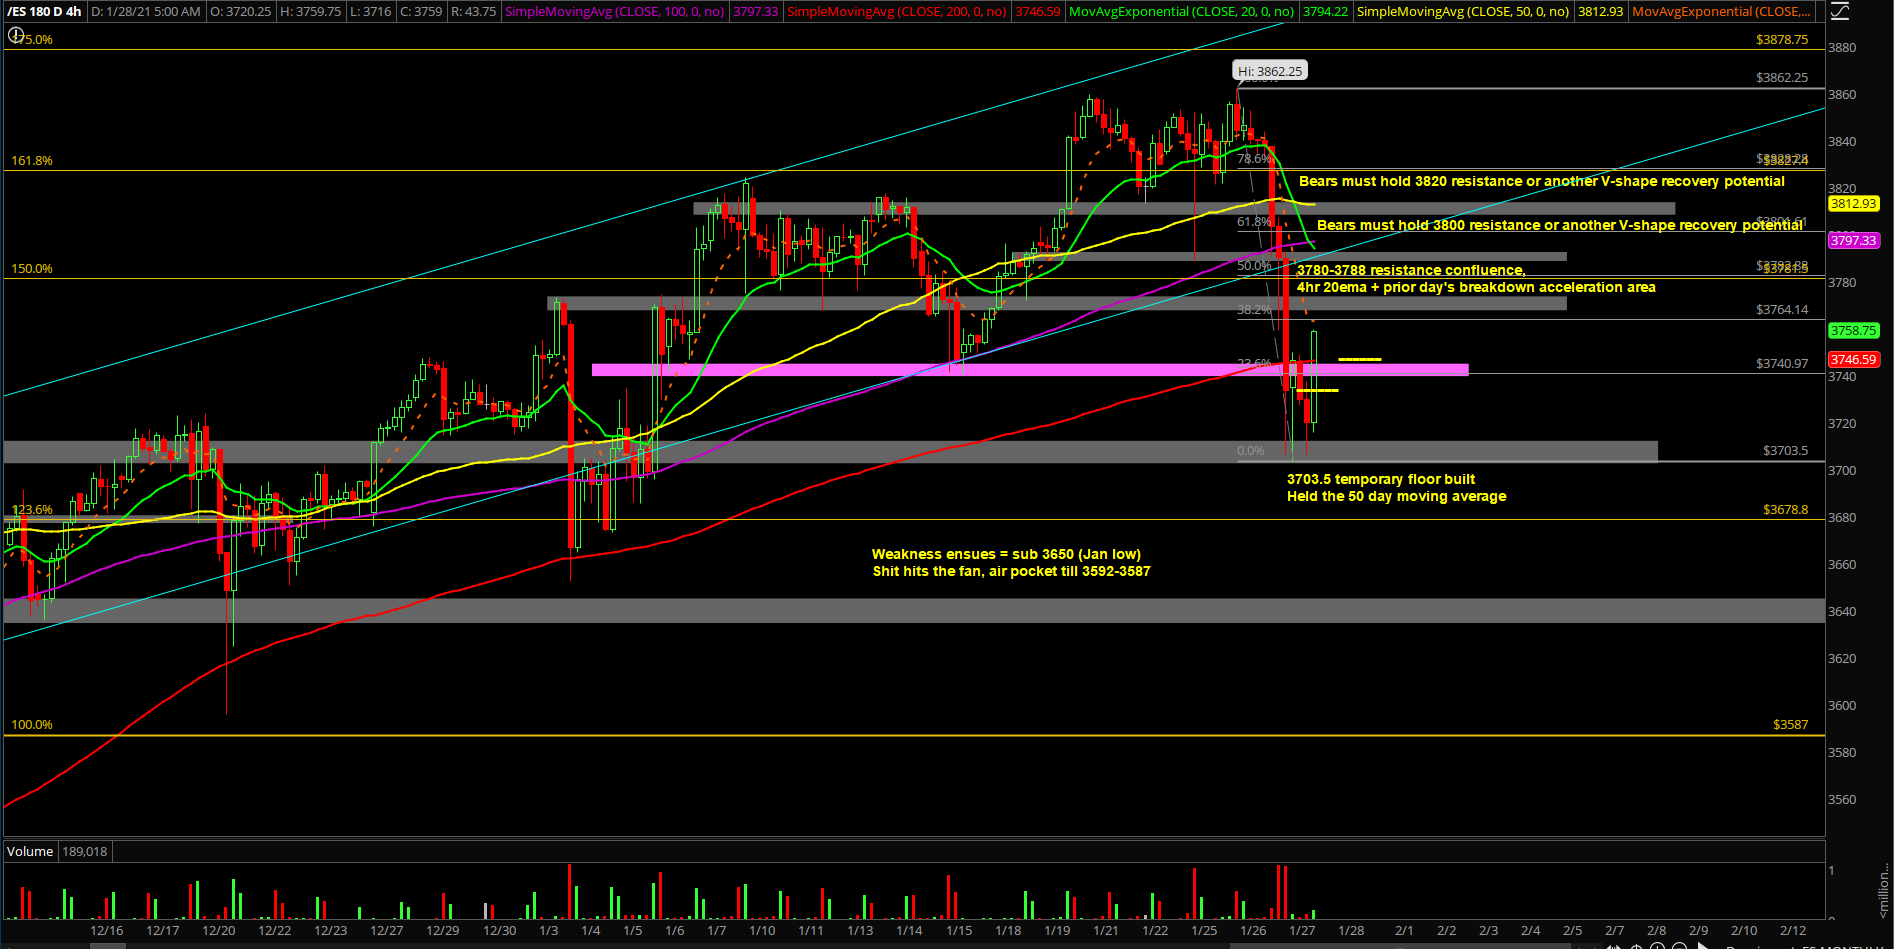
- There’s a cluster of things that line up in the 3780-3788s area with the trending 4hr 20ema resistance, 50% fib retracement of the entire drop and the prior day’s breakdown acceleration trigger point. Wait for the reaction, let price action dictate our actions
What is the bias/gameplan going into today? Do you see a feedback loop setup?
- Short-term intraday momentum has turned from BULLISH to NEUTRAL/BEARISH for the first time in months. The market is telling us that it is important to trim some profits on key stocks for this rotation and re-evaluate/re-strike at a later date
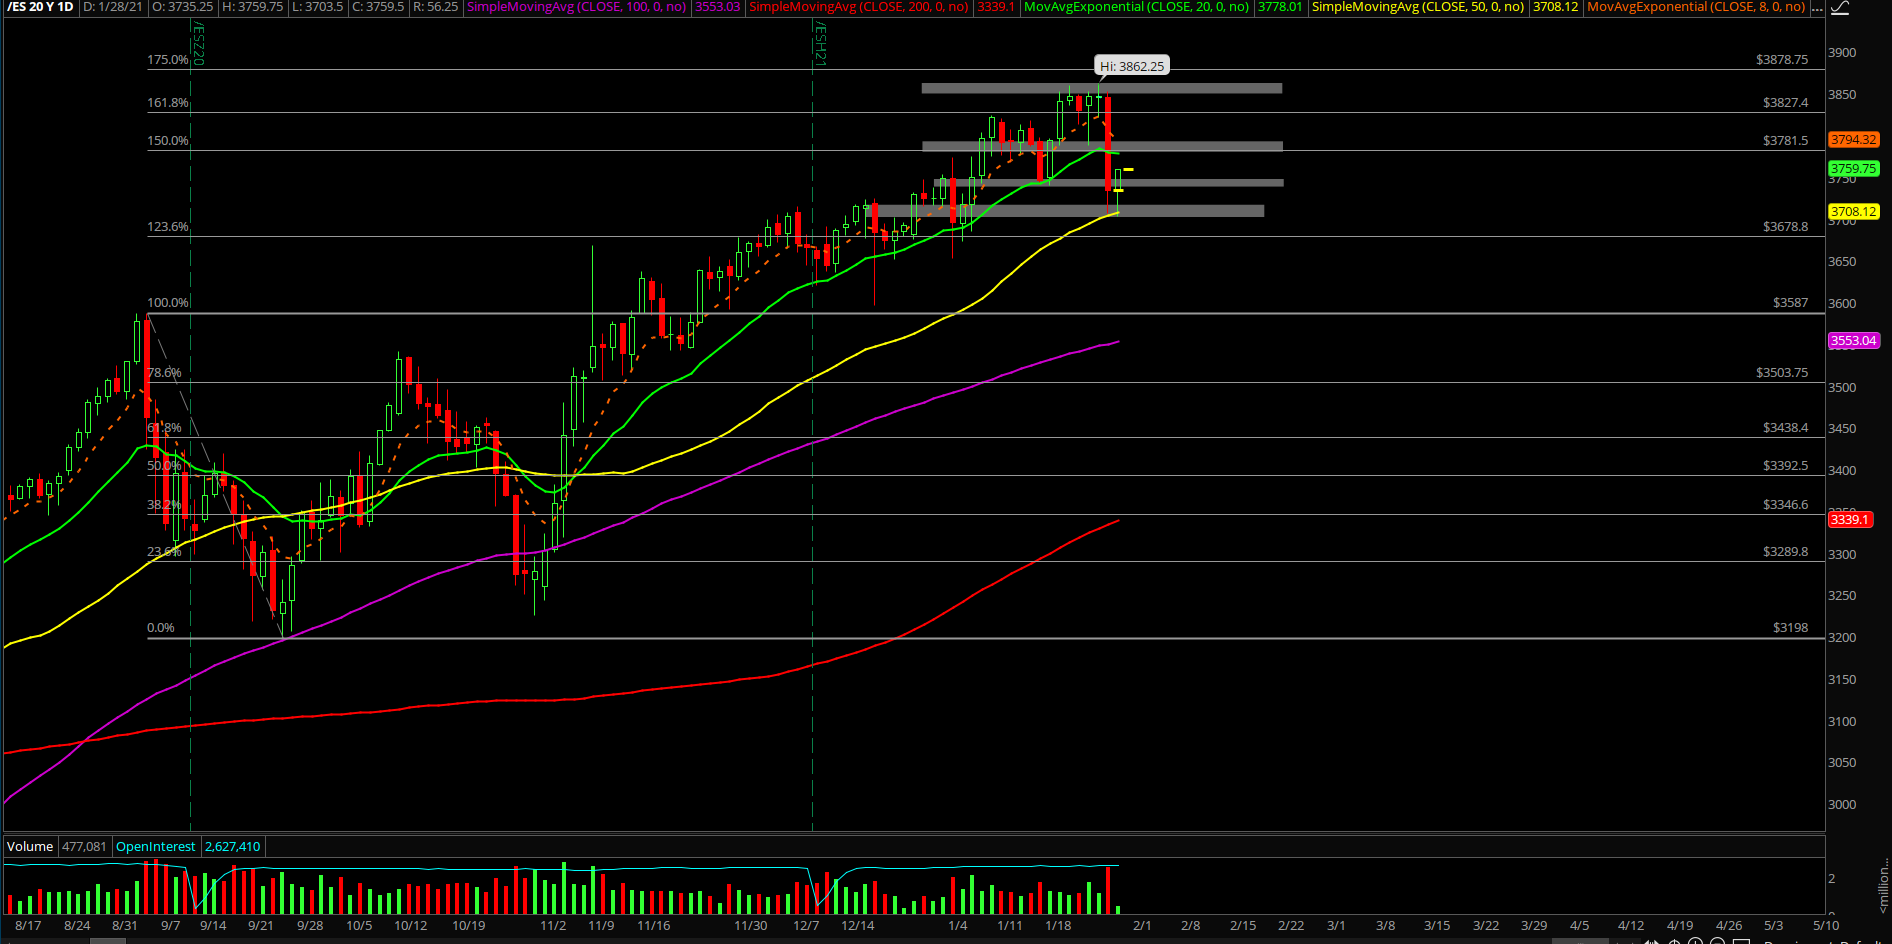
- If you recall, yesterday’s price action on a daily timeframe closed decisively below the daily 20EMA trending support for the first time in months
- This means that it’s not an even BTFD trending environment unless ES recovers 3800 and 3820 quickly to confirm a V-shape recovery of sorts
- This also means that we have to approach things in a much more nimble way as it’s a day to day structure for the key levels
- We do not know if this does a V-shape recovery or there’s a day 2 or day 3 downtrend into much lower levels. We must be nimble and adaptable now that we do not have the luxury of just riding above the daily 8/20EMA for the past few months
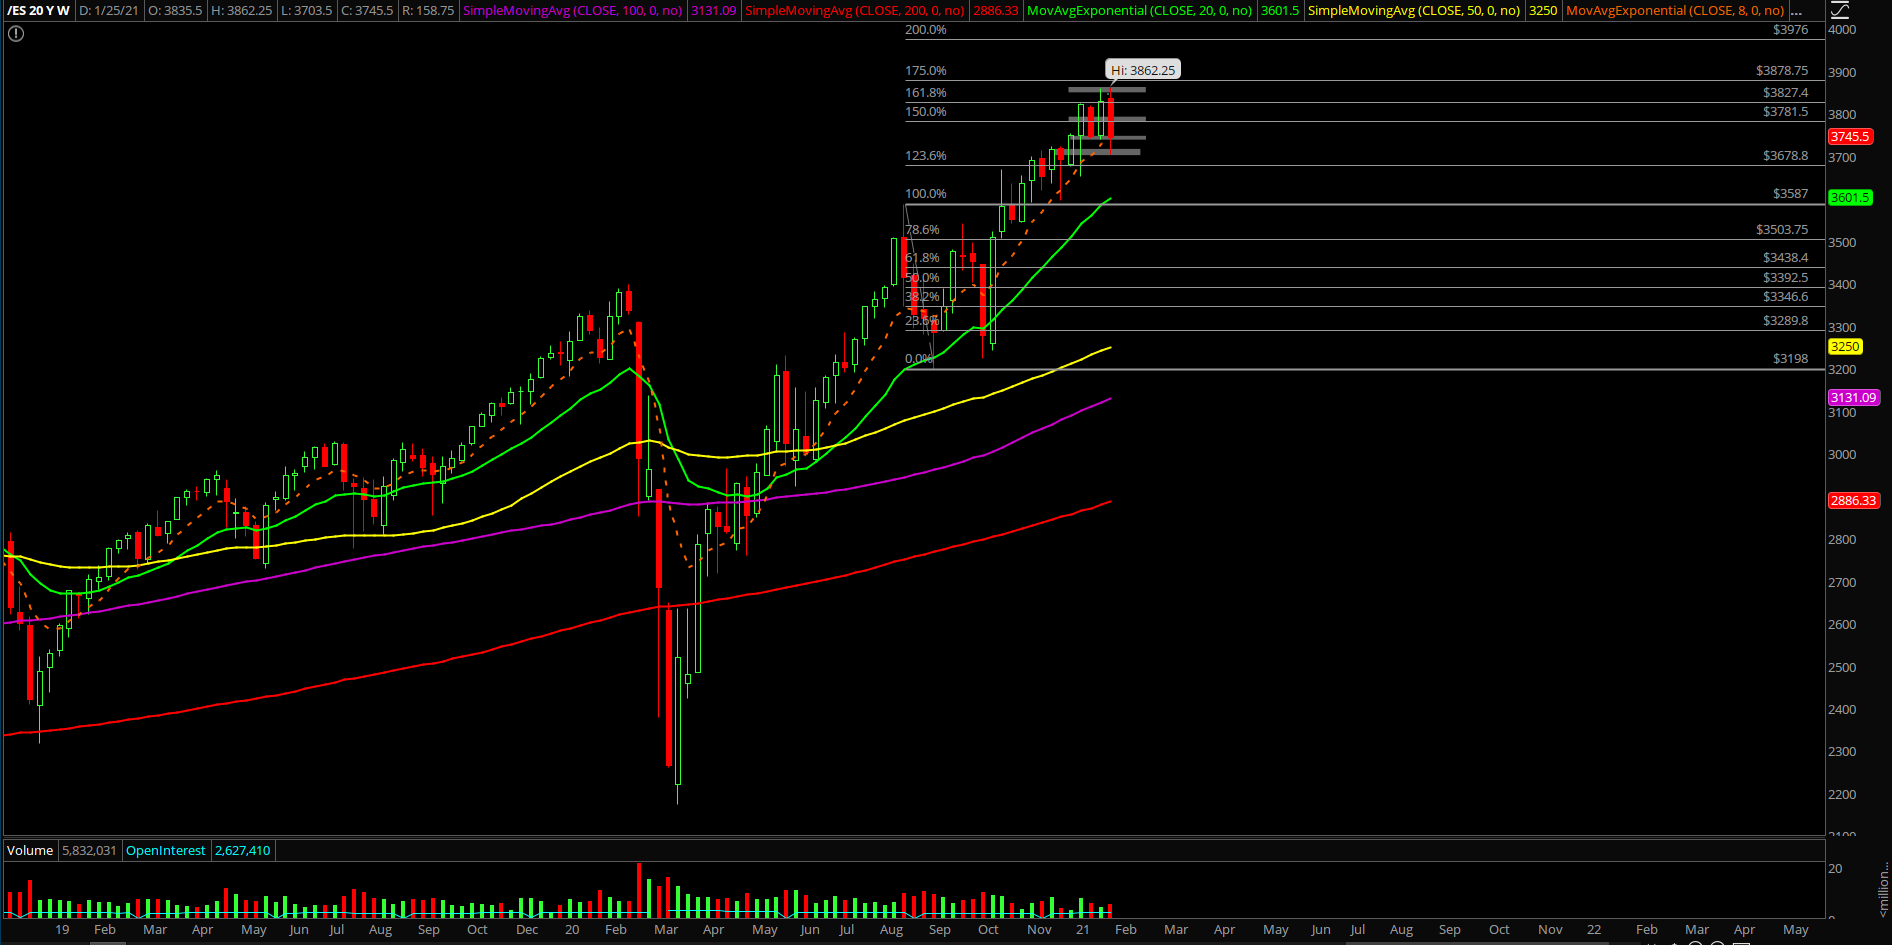
- For example, during Sept and Oct 2020 the market broke below the daily 20EMA for a 1-2 weeks and then eventually recovered in a swift V-shape or double bottom scenario into new all time highs. Could this pattern keep repeating? Of course, but at this moment in time, we need to let the price action dictate our actions as no one has a crystal ball here
- For today, must watch 3780-3780s confluence, see how price action reacts here. Again, this area represents the 50% fib retracement of the entire drop 3853->3703s, 4hr 20ema trending resistance and the prior day’s breakdown acceleration area
- Short-term bears have the ball here as yesterday broke below 3820, 3800 and 3740. See if they could form a lower high vs 3780s confluence or whether bulls reclaim the area as if yesterday’s momentum meant nothing
What are the key levels to be aware of?
- Resistances 3780, 3785,3788,3800,3820, 3830, 3840, 3850, 3862, 3878, 3900, 3925, 3950.….. 3976
- Supports 3773, 3768, 3750, 3740, 3724, 3715, 3703, 3700, 3695, 3685, 3676, 3668,3652,3642, 3630, 3620, 3600, 3596, 3592, 3587, 3582, 3575, 3567, 3550, 3542,3515, 3505, 3500
ES JAN28_REVIEW
ES JAN28_REVIEW2
ES JAN28_REVIEW3
ES JAN28_REVIEW4
