Market Analysis for Jan 26th, 2021
 By
Ricky Wen
By
Ricky Wen
E-mini S&P 500 Futures: Keep It Simple Stupid – Potential Acceleration Setup Above Multi-Month Channel Part 2
Sharing the entire pre-market game plan report from Ricky’s ES Trade Alerts room for today only. No key levels have been redacted in this report unlike the usual KISS reports. Level by level approach. Know your timeframes. Enjoy!
Tuesday Jan 26 Gameplan (Bears in shambles, testing ATHs)
Did the bulls/bears fail overnight? What is the next highest probability plan
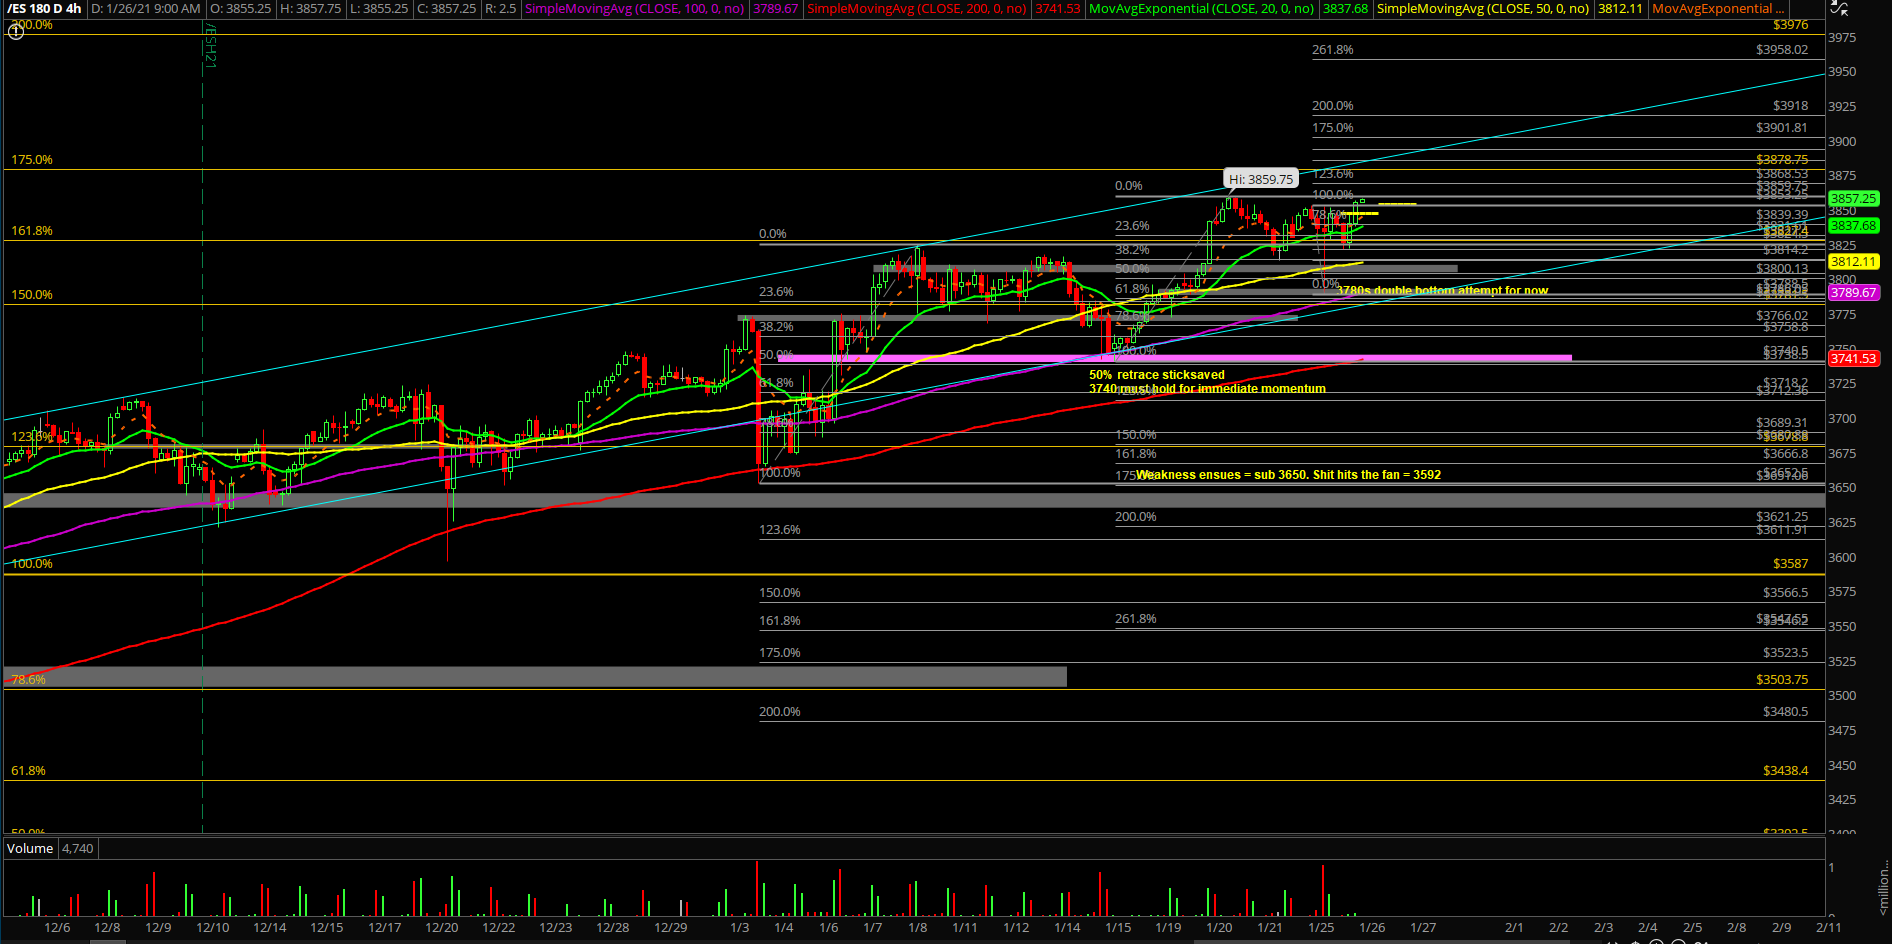
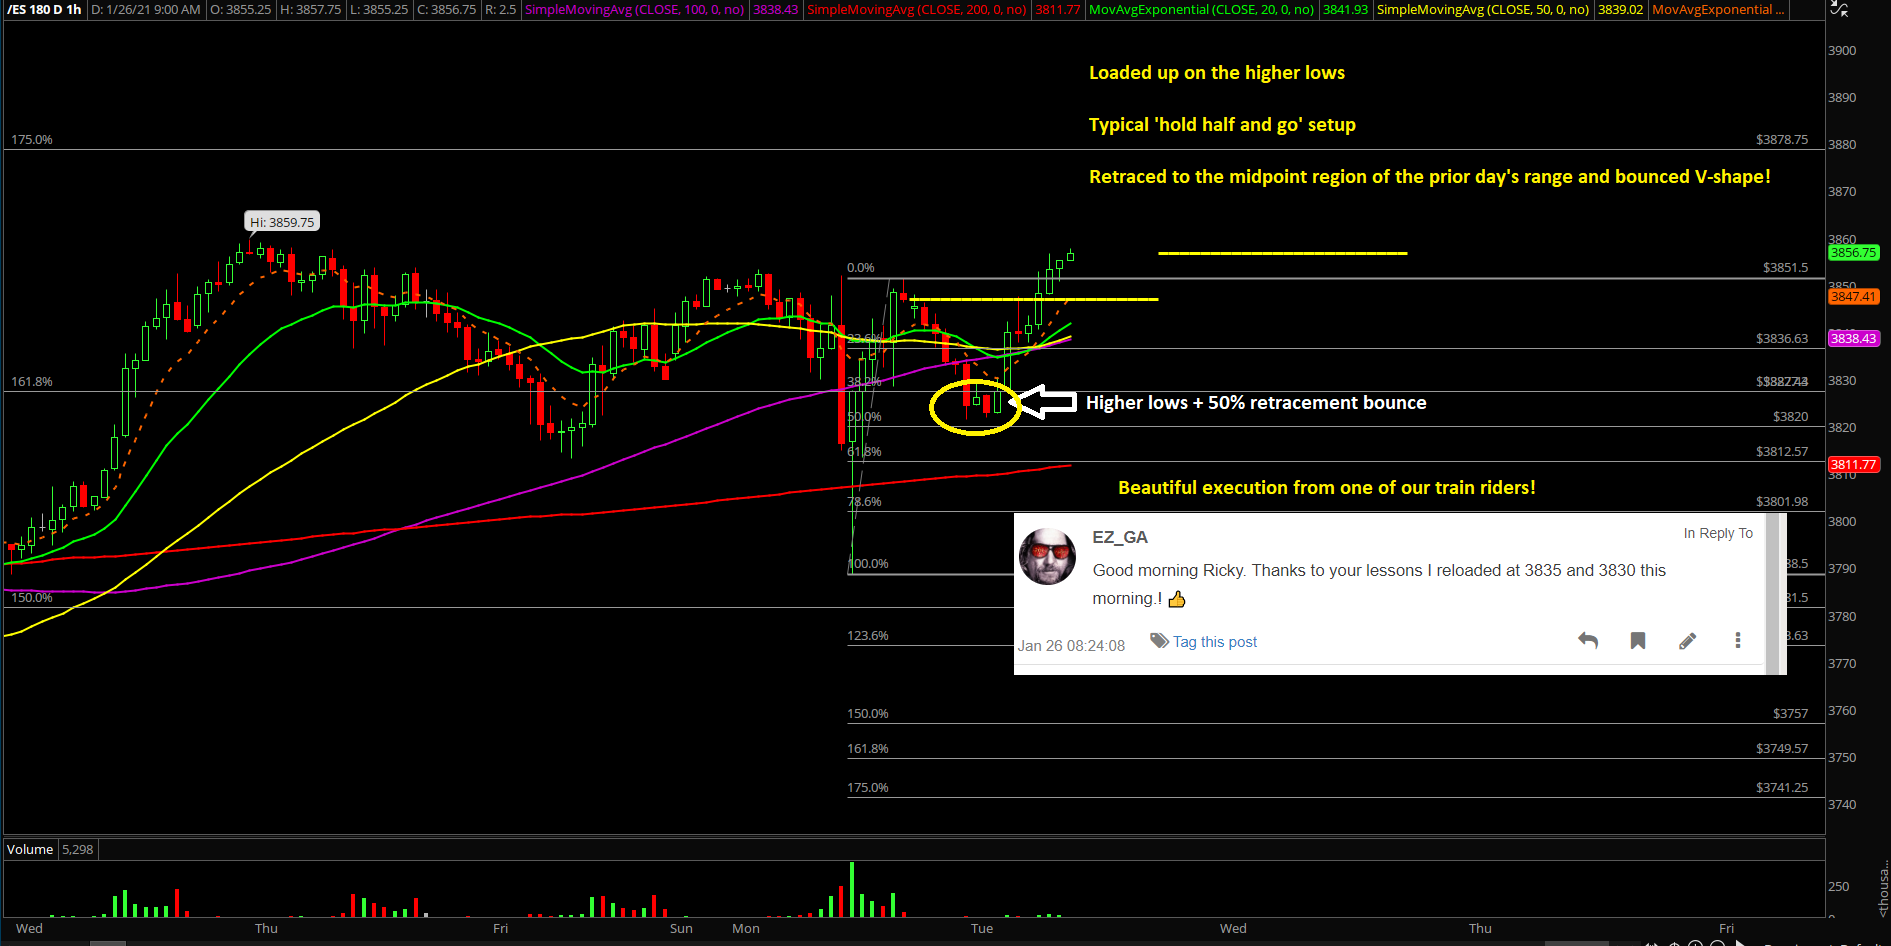
- ‘Hold half and go’ setup during O/N (retraced to midpoint and bounced), O/N range = 3856.75-3821.50
- Price action is coiled given the overnight bullish consolidation and confirmations
- For today and rest of the week, we’re expecting the breakout towards 3878/3900…3976 to open up the trading range. This is valid when price action remains above yesterday’s low of 3788 and especially when above 3820. In addition, price action is gunning for the usual month end highs given the on-trend upside month
- https://www.elliottwavetrader.net/trading-room/thread/6693222
What is the bias/gameplan going into today? Do you see a feedback loop setup?
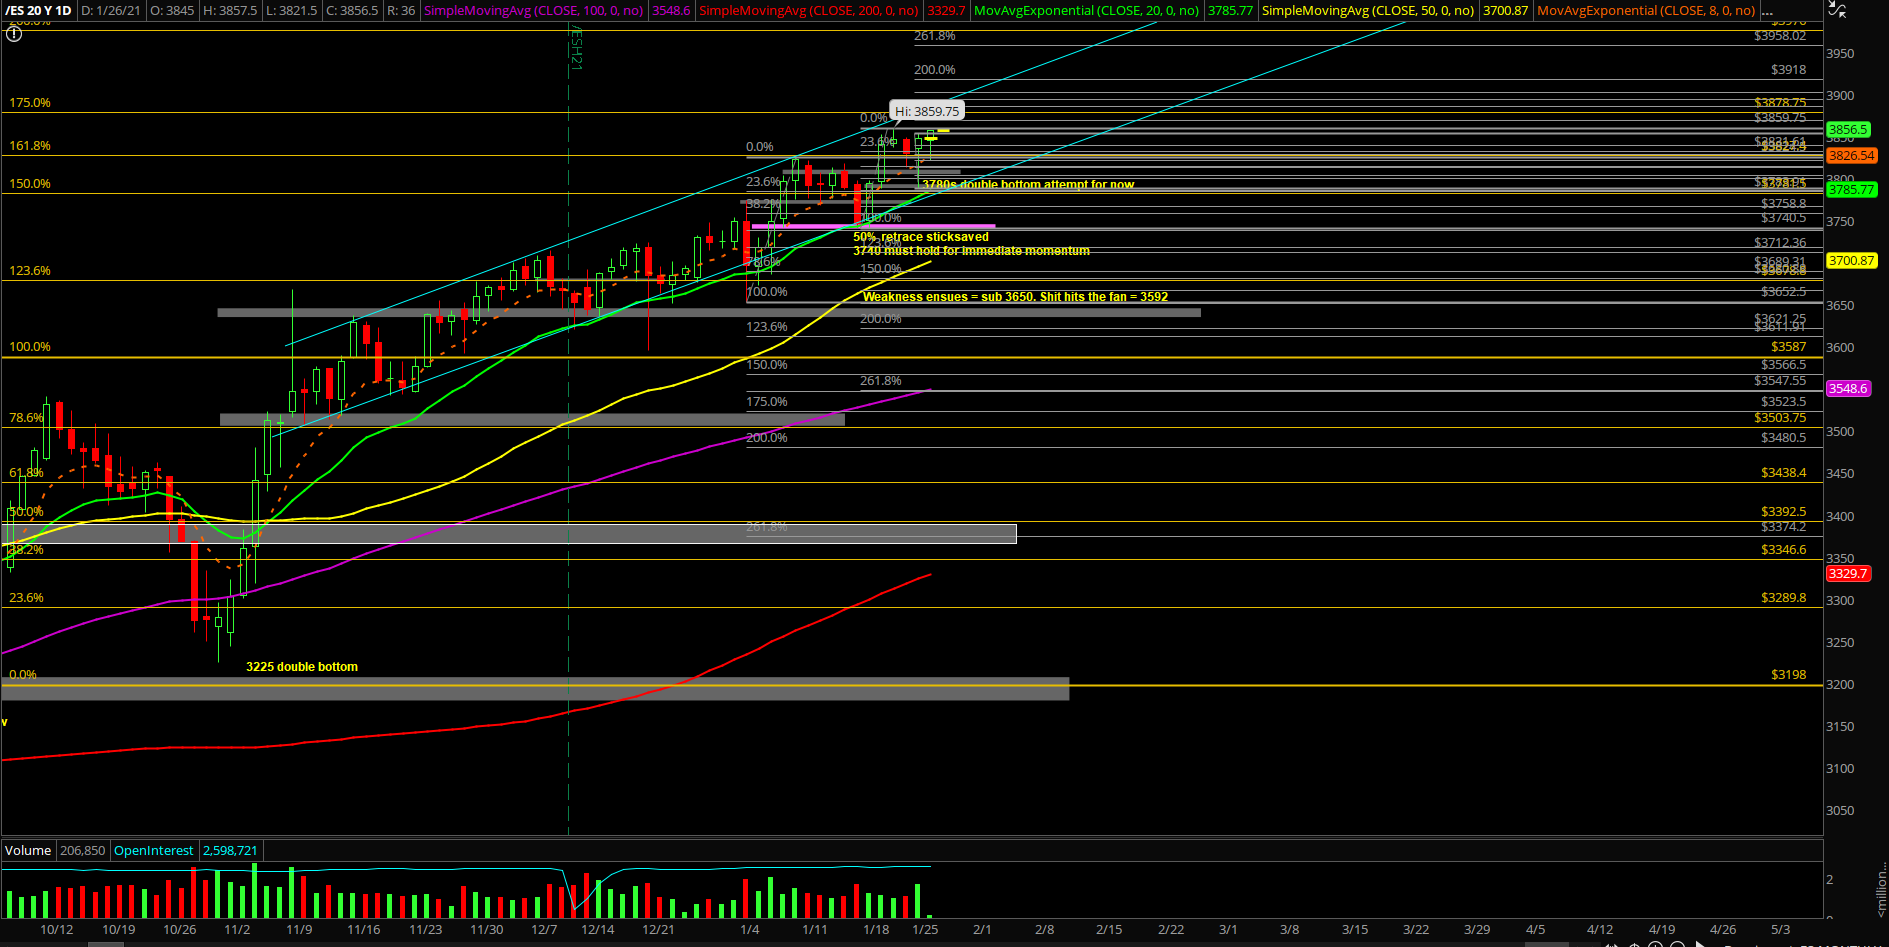
- Friday Jan 15, the market backtested into our 3740-3750 key support zone to shake out some weak hands, which represented the daily 20EMA trending support combined with the 50% fib retracement area of the entire rally from 3652.5-3824.50 (first week of Jan’s range)
- Then, during Jan 18 week, the market did its usual V-shape bounce into new all time highs as a trend week up and now we’re looking for another continuation to the upside
- Just be aware, there’s a lot of earnings report this week so we’re bound to get some volatility. Manage your expectations and adjust accordingly. Know your timeframes
- For today or heading into this week, utilize 3850/3830/3820 as key trending supports, bulls are ready to breakout any minute now
- Look for dip buying opportunities until support actually breaks, the bull train is all loaded up
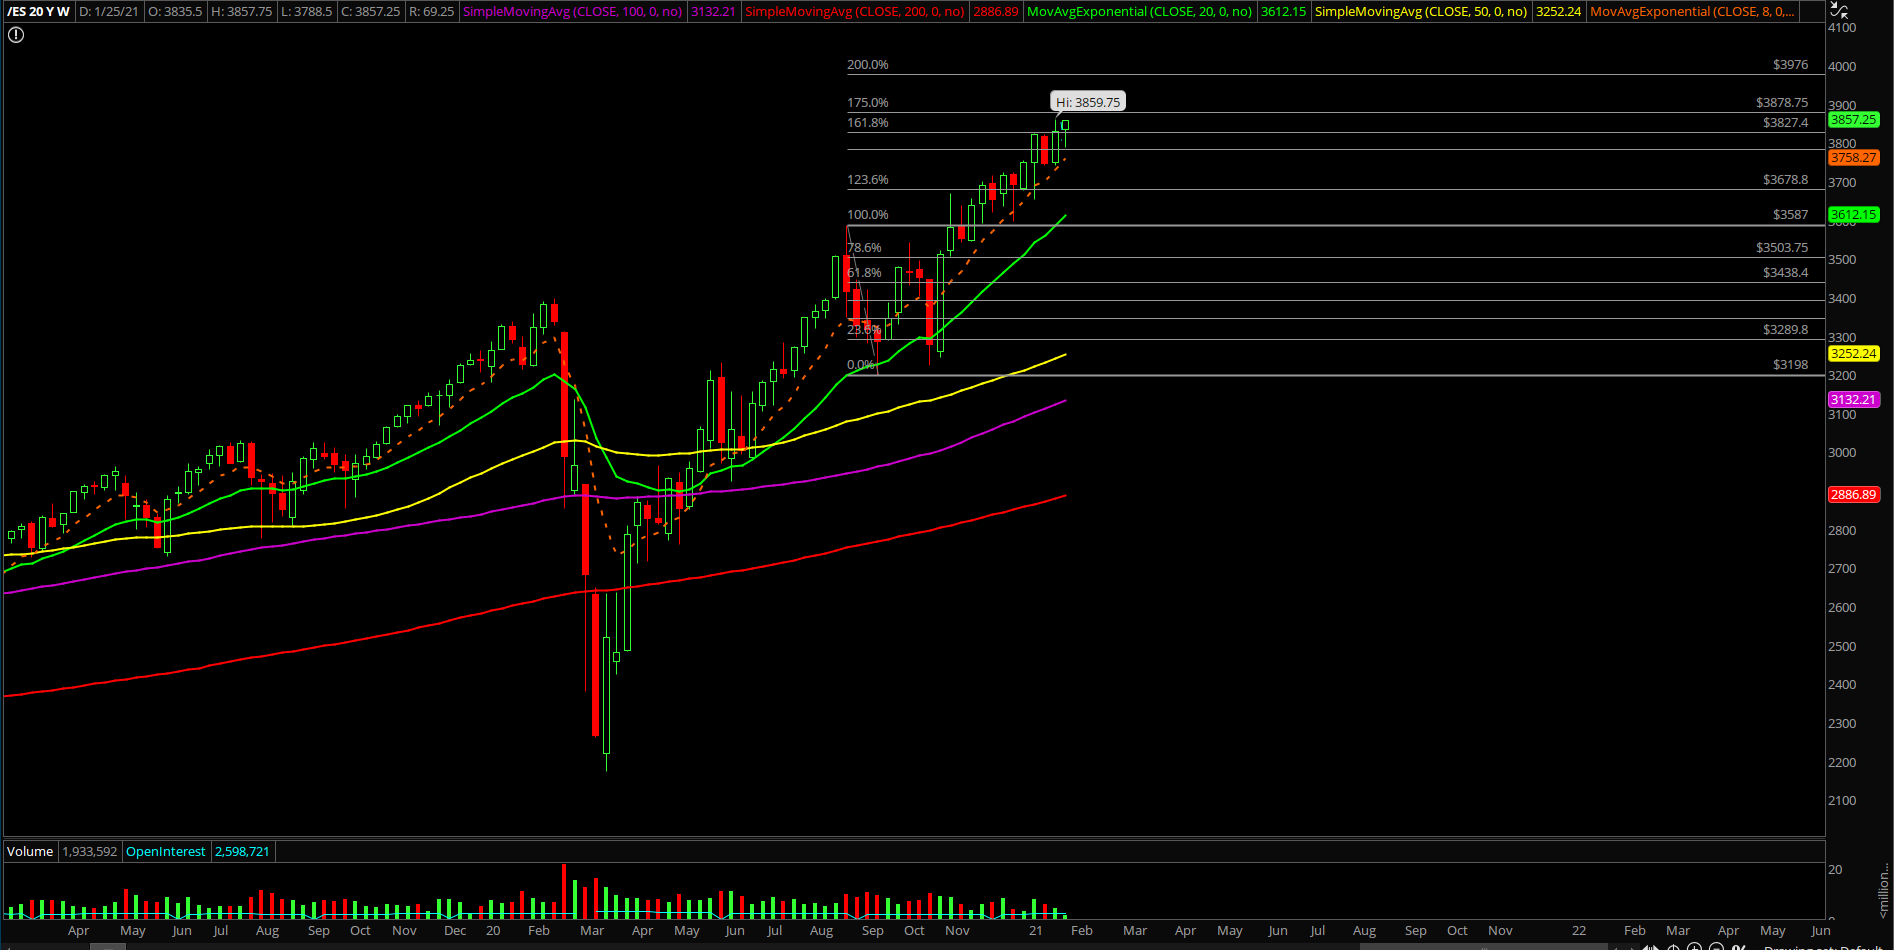
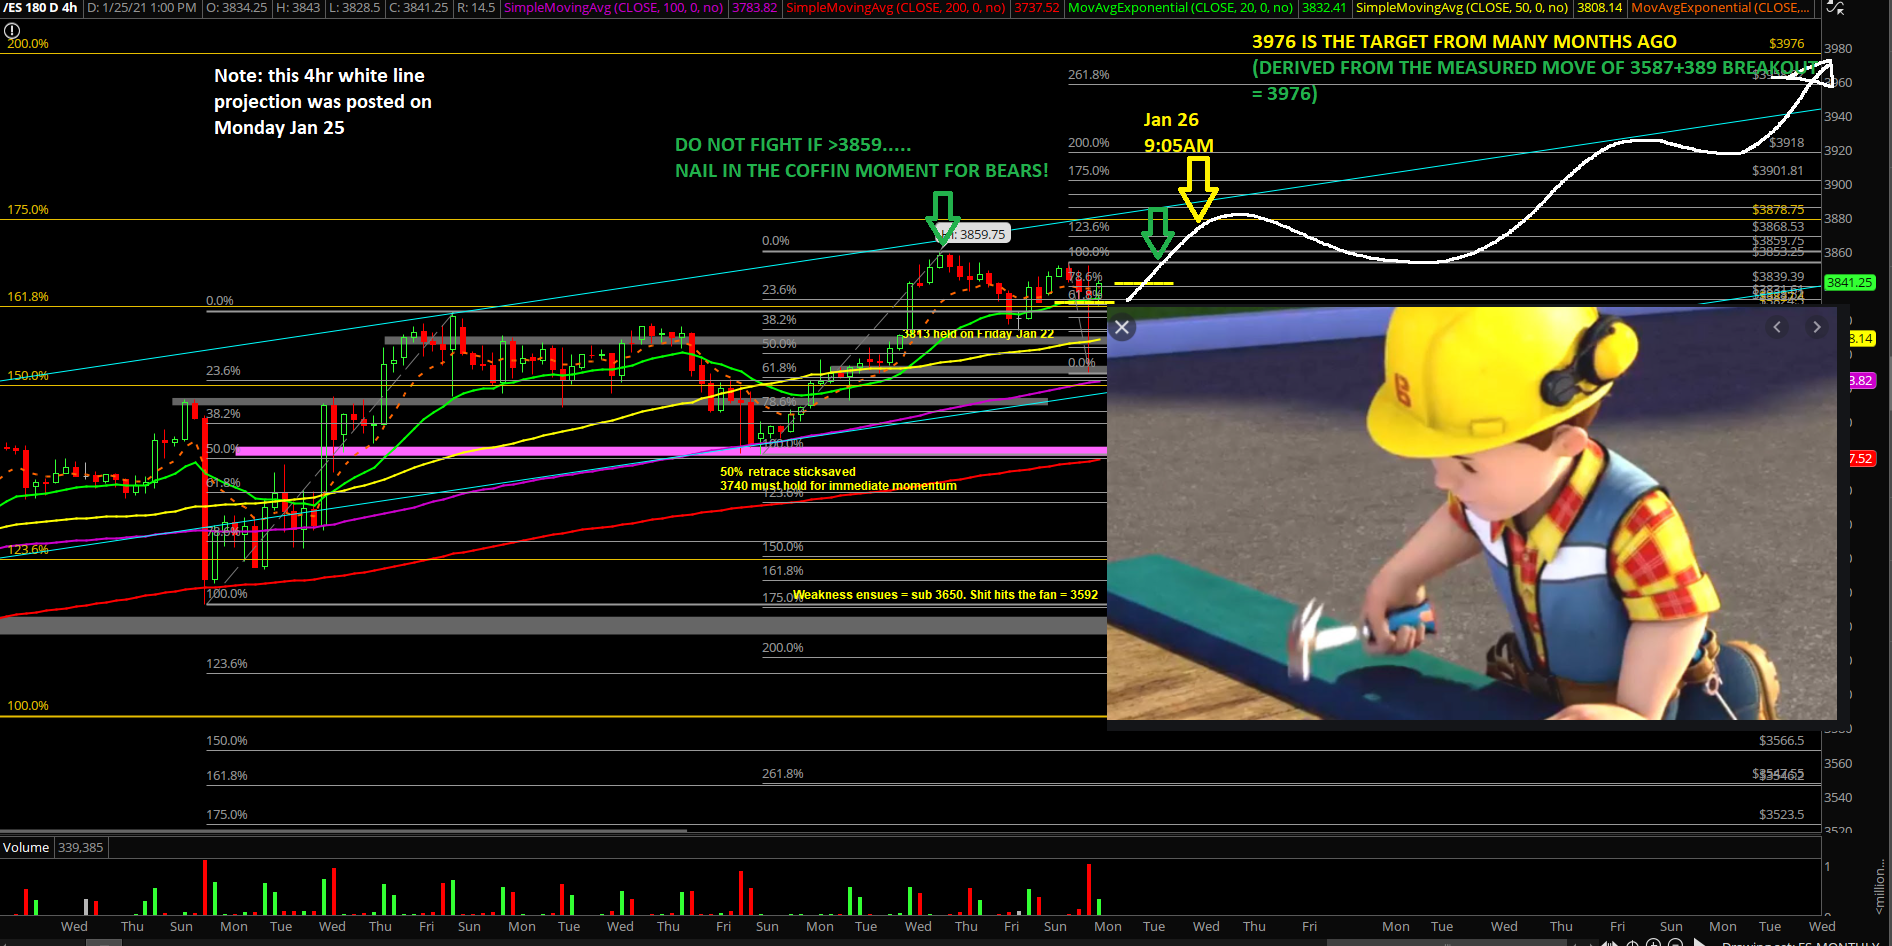
- A sustained break above last week’s high of 3859 would confirm 3878/3900 as immediate targets within the direction of our multi-month target of 3976 (calculated many months ago)
- Sustaining below 3830/3820 levels would open up immediate lower levels such as 3800/3785/3773…
- On the higher timeframes, we’re treating last week’s low 3740 as a key pivot given that this week could be a continuation week within the uptrend channel and have the potential to accelerate OUTSIDE this multi-month channel from November given how all the setups remain bullish. The surprise is to the upside for now, until at least one support could breakdown and price action sustaining below it
- At this point on the short-term, there should be no breakdown below this 3740 number given the prior week’s breakout setup + powerful daily 20EMA bounce+ new all time highs being established. Otherwise, stay clear and objective
Additional context from past few weeks remain mostly unchanged (copied and pasted):
- The shit hits the fan (SHTF) level has moved up to 3650 from 3592, a daily closing print below 3650 is needed in order to confirm a temp top setup/reversal for the daily+weekly timeframe. (Current Janurary lows)
- A break below 3650 would be a strong indication of weakness given the multi-month trend of being above the daily 20EMA train tracks. For reference, the first week of 2021 (Jan 4th) bottomed out at 3650s vs the daily 20EMA/major support confluence area and then swiftly made new all time highs per our expectations as support held
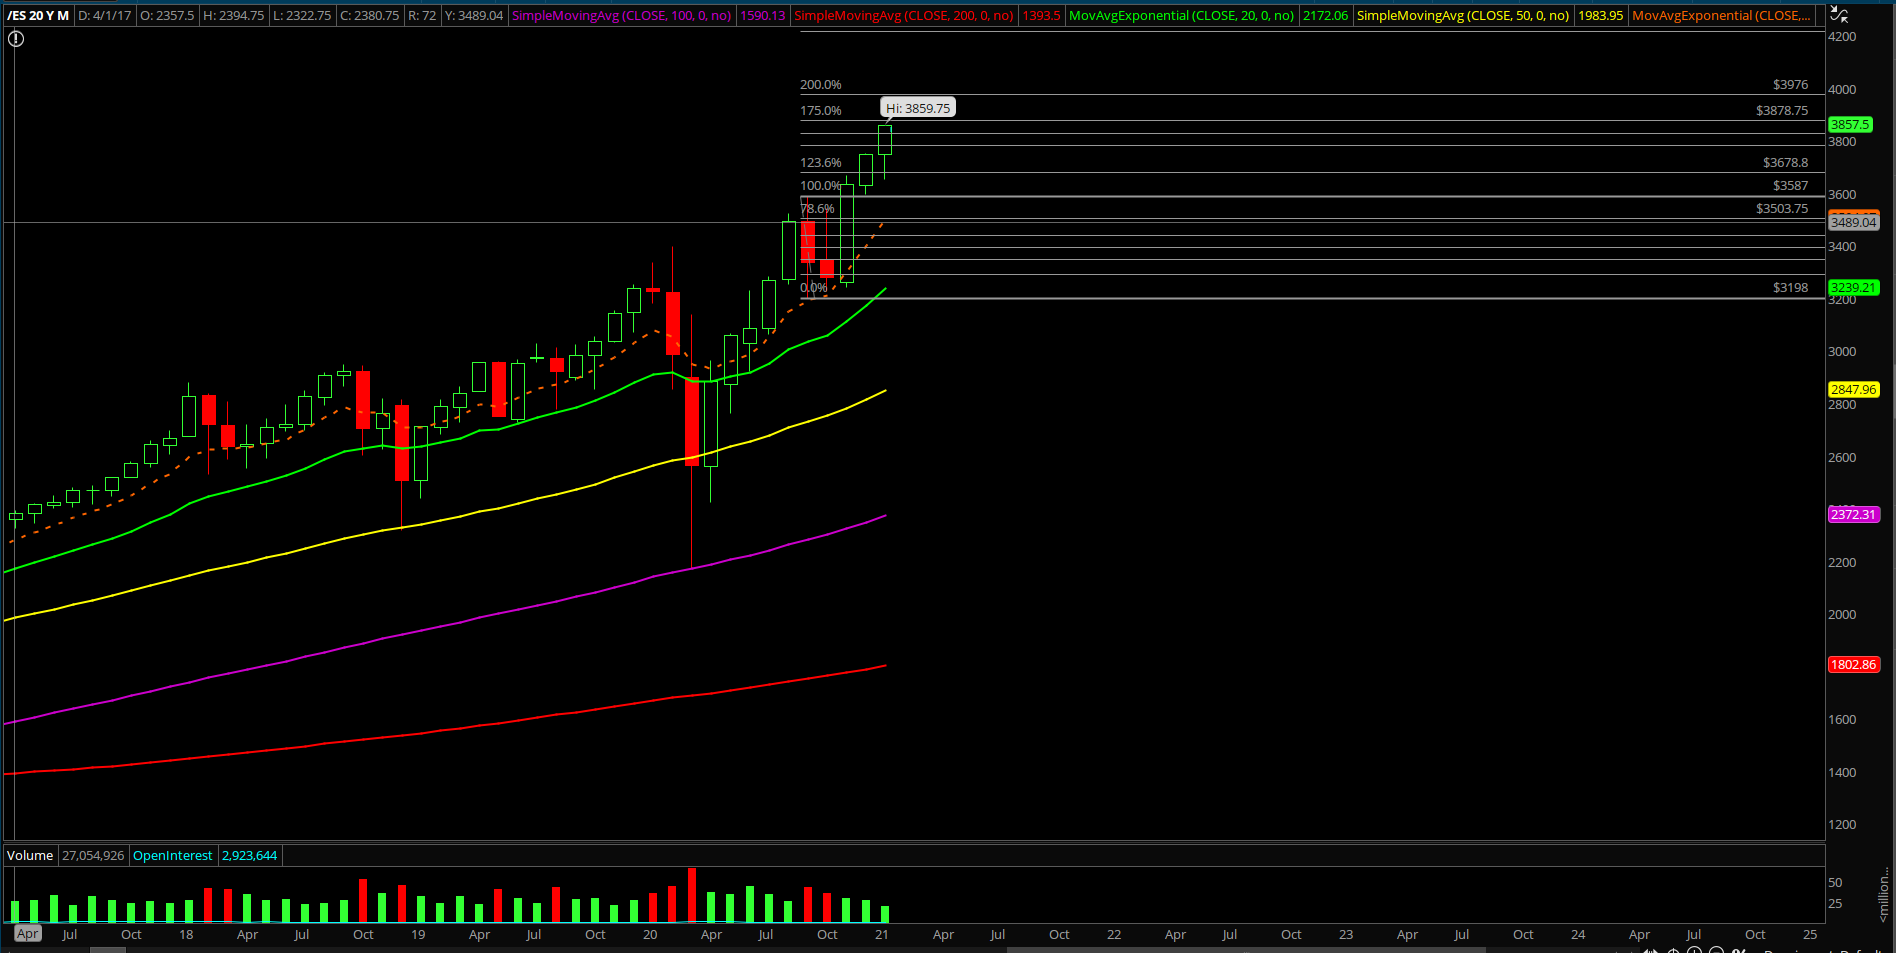
- For reference, as discussed in the past reports; a breakout of the 3587-3198 range = 3587+389 = 3976 (100% measured move target).
- As of Janurary 21, market is still at least 100 points away or another 3% away as of writing from bigger picture target. (price +7.3% since the 3587 breakout thus far)
- Please know and understand the timeframes in this report, it is overwhelming, but when/if short-term aligns with bigger picture…it is often a recipe of success. Timeframe alignment 101
- NQ/tech backtesting against its trending support area which coincides with the prior breakout area. Will need to monitor how NQ keeps holding 12400-12500 in order to ramp higher or need to backtest lower levels. As of Jan 7, NQ continues to hold as Jan 6th low = 12491.25 by forming the low of the week and NQ doing another round of rotations. See if next few days NQ able to lead again once it finishes taking this time to digest. As of Jan 13, NQ outperformed during end of last week into new all time highs as expected and now doing a healthy consolidation alongside with ES. As of Jan 20, the healthy consolidation/backtest into trending daily 20EMA held and the market has rotated higher towards the prior all time highs
- Just be aware that many bad portfolio managers will continue their dash into trash stocks (small caps) in order to try and chase alpha to make up for their poor yearly performance. See RTY:ES or IWM:SPX ratio. Never underestimate the FOMO ability as people fear for their jobs/likelihood during the 4th quarter and beyond. Great outperformance from RTY/IWM thus far
- As of Jan 20, 2021, RTY is up another + 16% since Nov 30 when we formally published RTY into our reports to showcase additional setups and the fact that it doesn't take a genius to generate alpha in a bull market… amazing outperformance since March 2020 low.
- Very easy if you have a system in place as you’re only piggybacking off of the institutional + price momentum like we’ve shown in our trading room in real-time via many asset classes such as stocks , commodities and US index futures by generating excessive alpha vs the market benchmark of S&P 500
What are the key levels to be aware of?
- Resistances 3859, 3878, 3900, 3925, 3950.….. 3976
- Supports 3850, 3840, 3830, 3825, 3820, 3813, 3810,3800, 3785, 3773, 3768, 3750, 3740, 3724, 3715, 3700, 3695, 3685, 3676, 3668,3652,3642, 3630, 3620, 3600, 3596, 3592, 3587, 3582, 3575, 3567, 3550, 3542,3515, 3505, 3500
ES JAN26_REVIEW
ES JAN26_REVIEW2
ES JAN26_REVIEW3
ES JAN26_REVIEW4
ES JAN26_REVIEW5
ES JAN26_REVIEW5_PRO
