Market Analysis for Jan 19th, 2021
 By
Ricky Wen
By
Ricky Wen
E-mini S&P 500 Futures: Keep It Simple Stupid – Daily 20EMA Revisited, Shaking Out Weak Hands
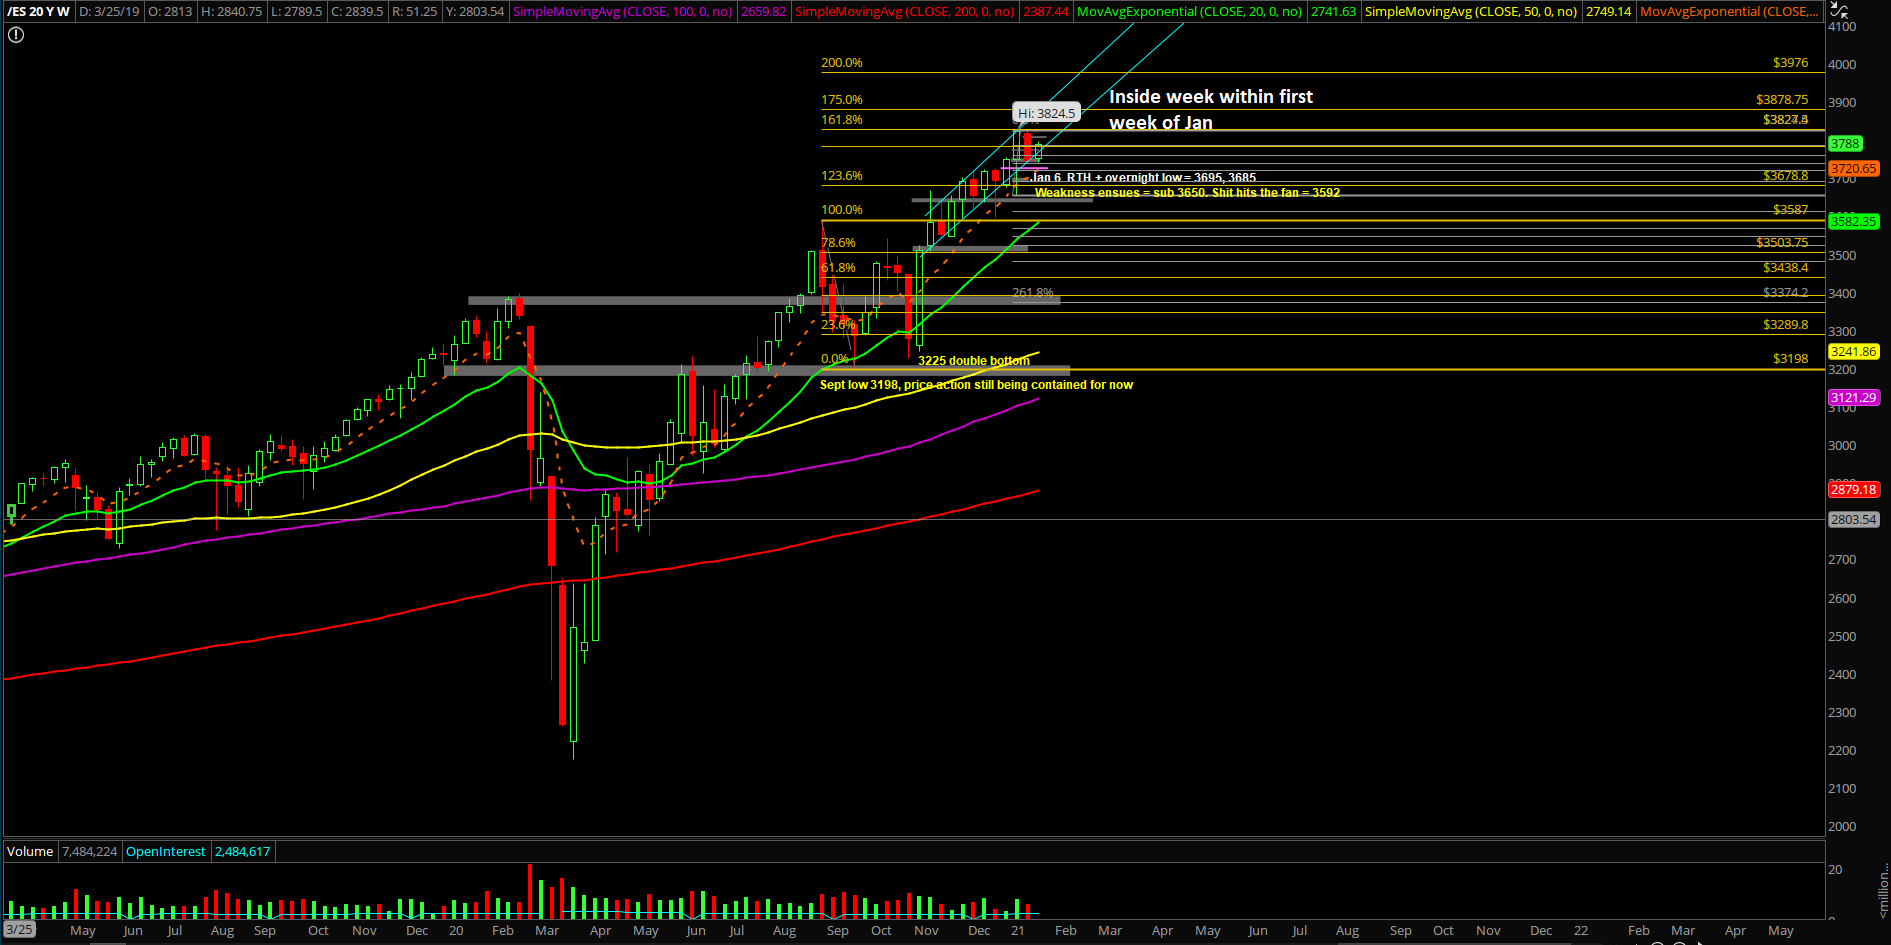
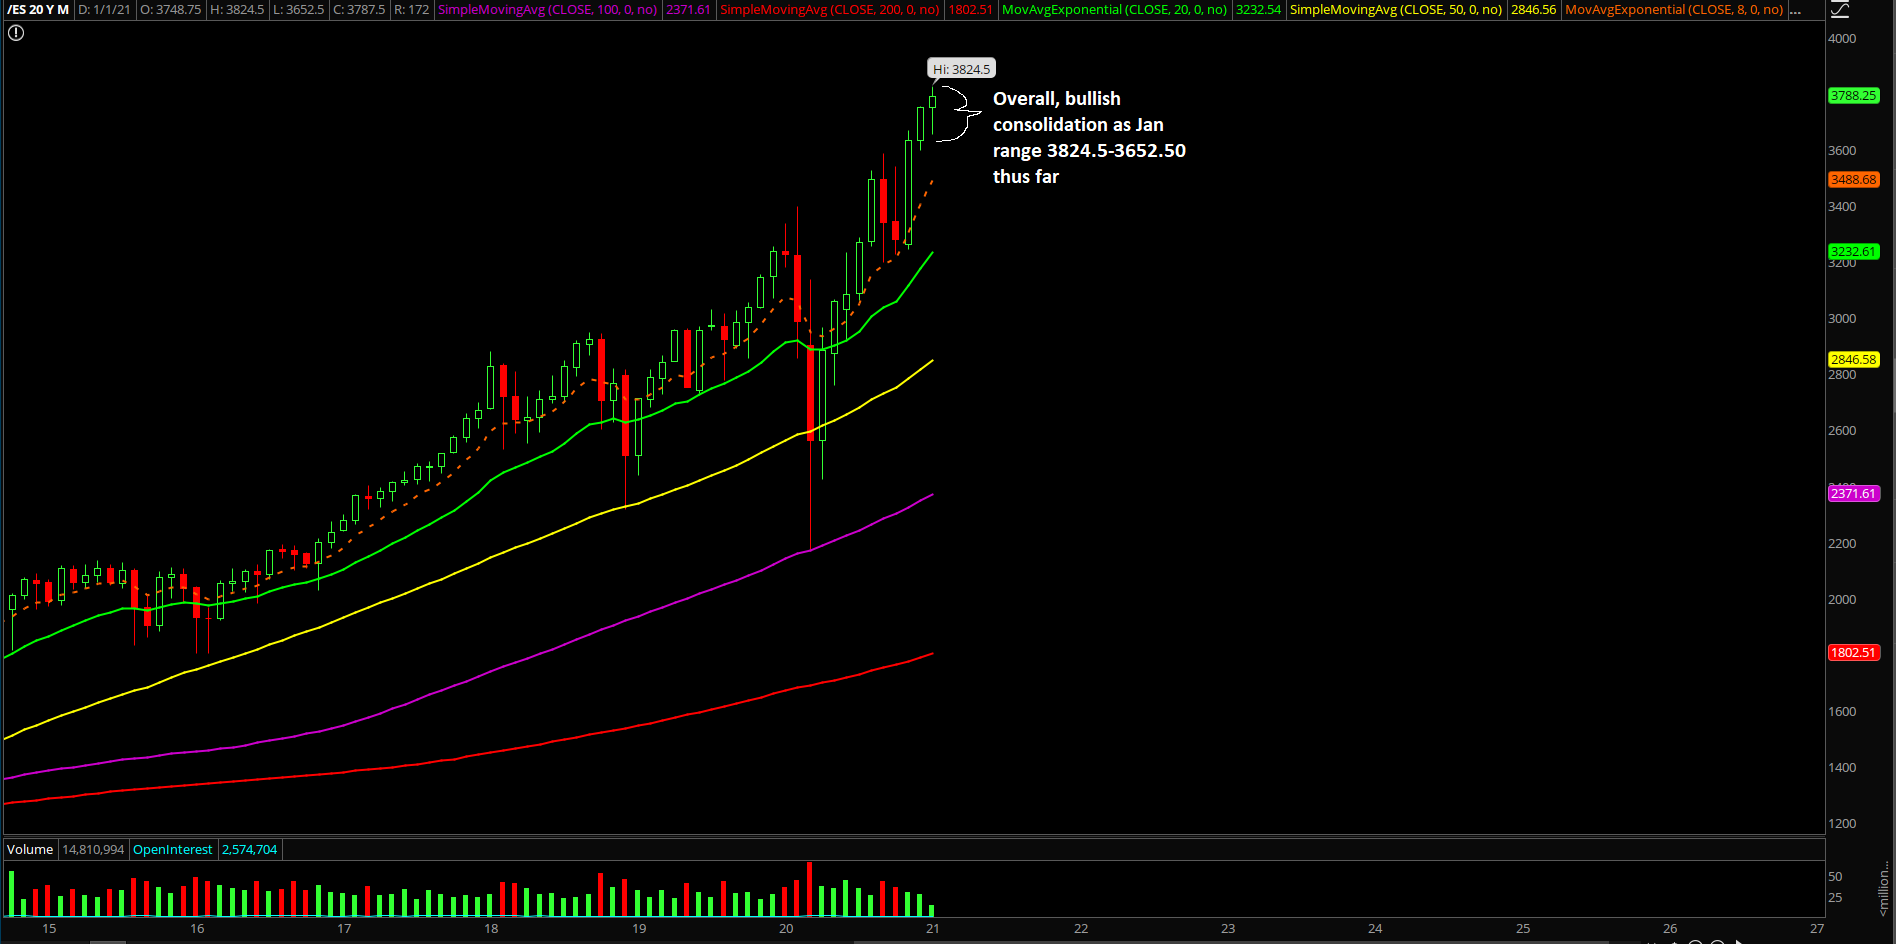
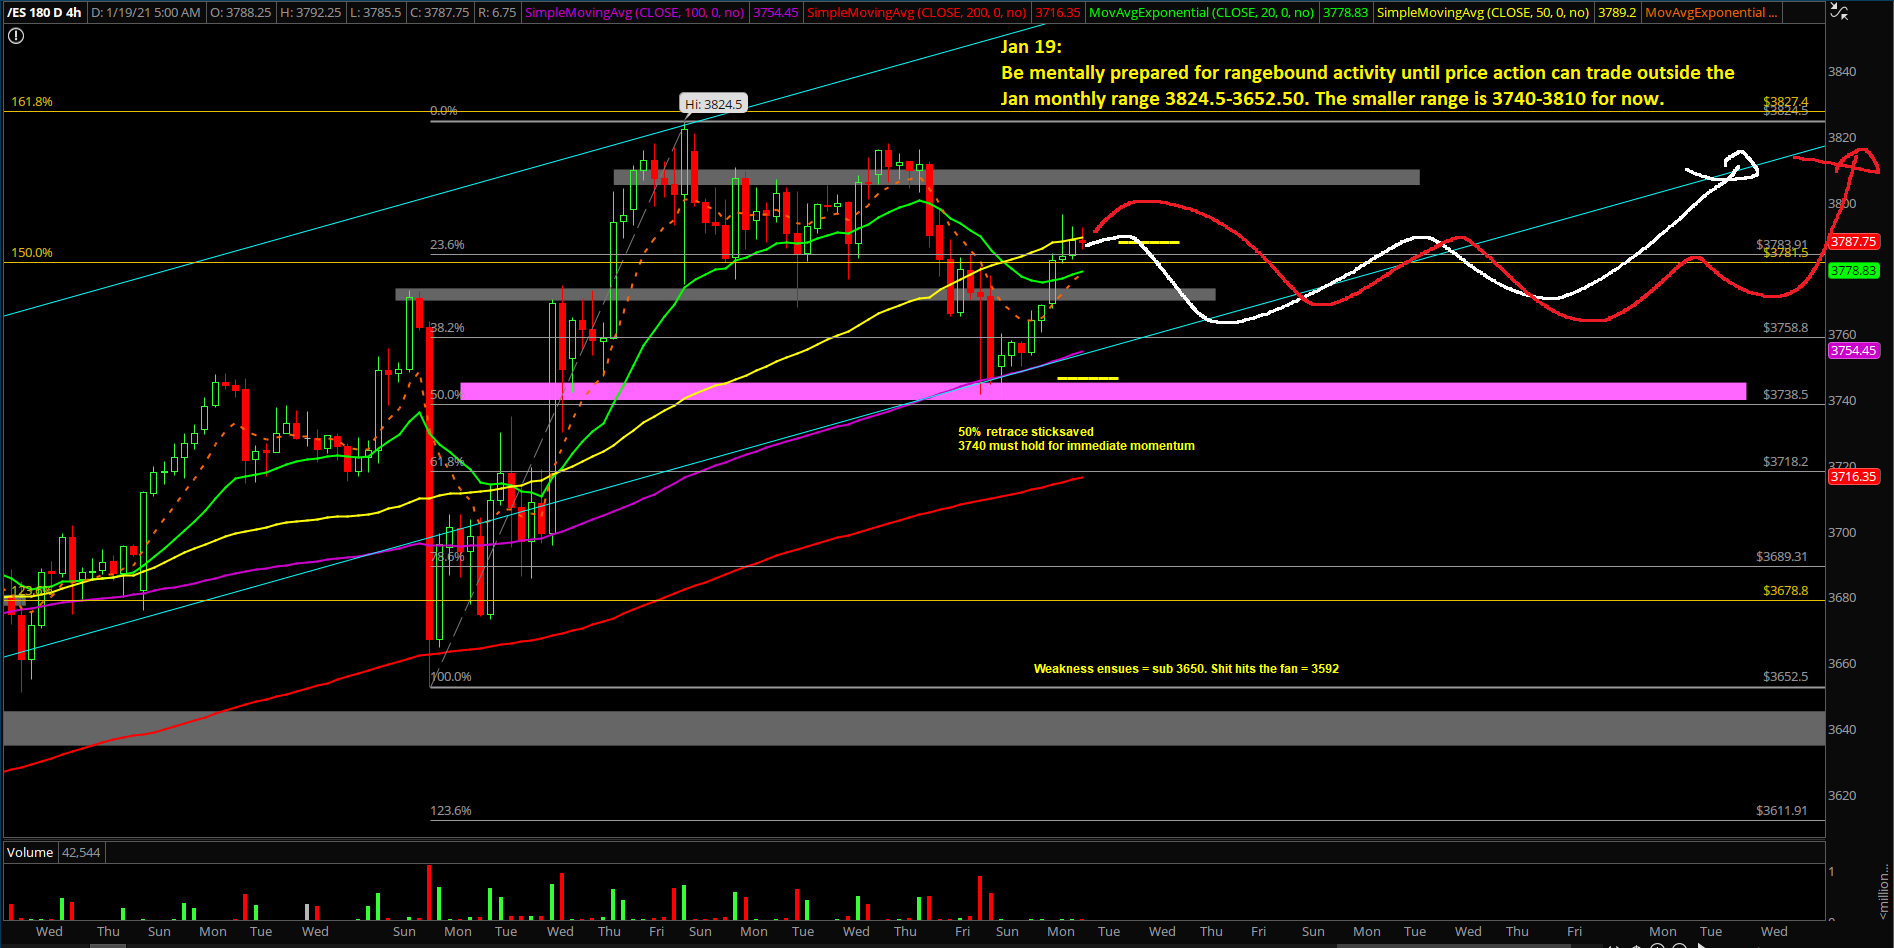
The second week of January played out as an inside week meaning that the price action was confined within the entirety of first week of Jan’s massive range 3824.5-3652.50. Basically, the market was able to backtest into the 50% fib retracement or what we call our standard ‘hold half and go’ setup. Shaking out some weak hands as the inside week(s) build out another basing pattern so that the bull train could refuel and reattempt all time highs.
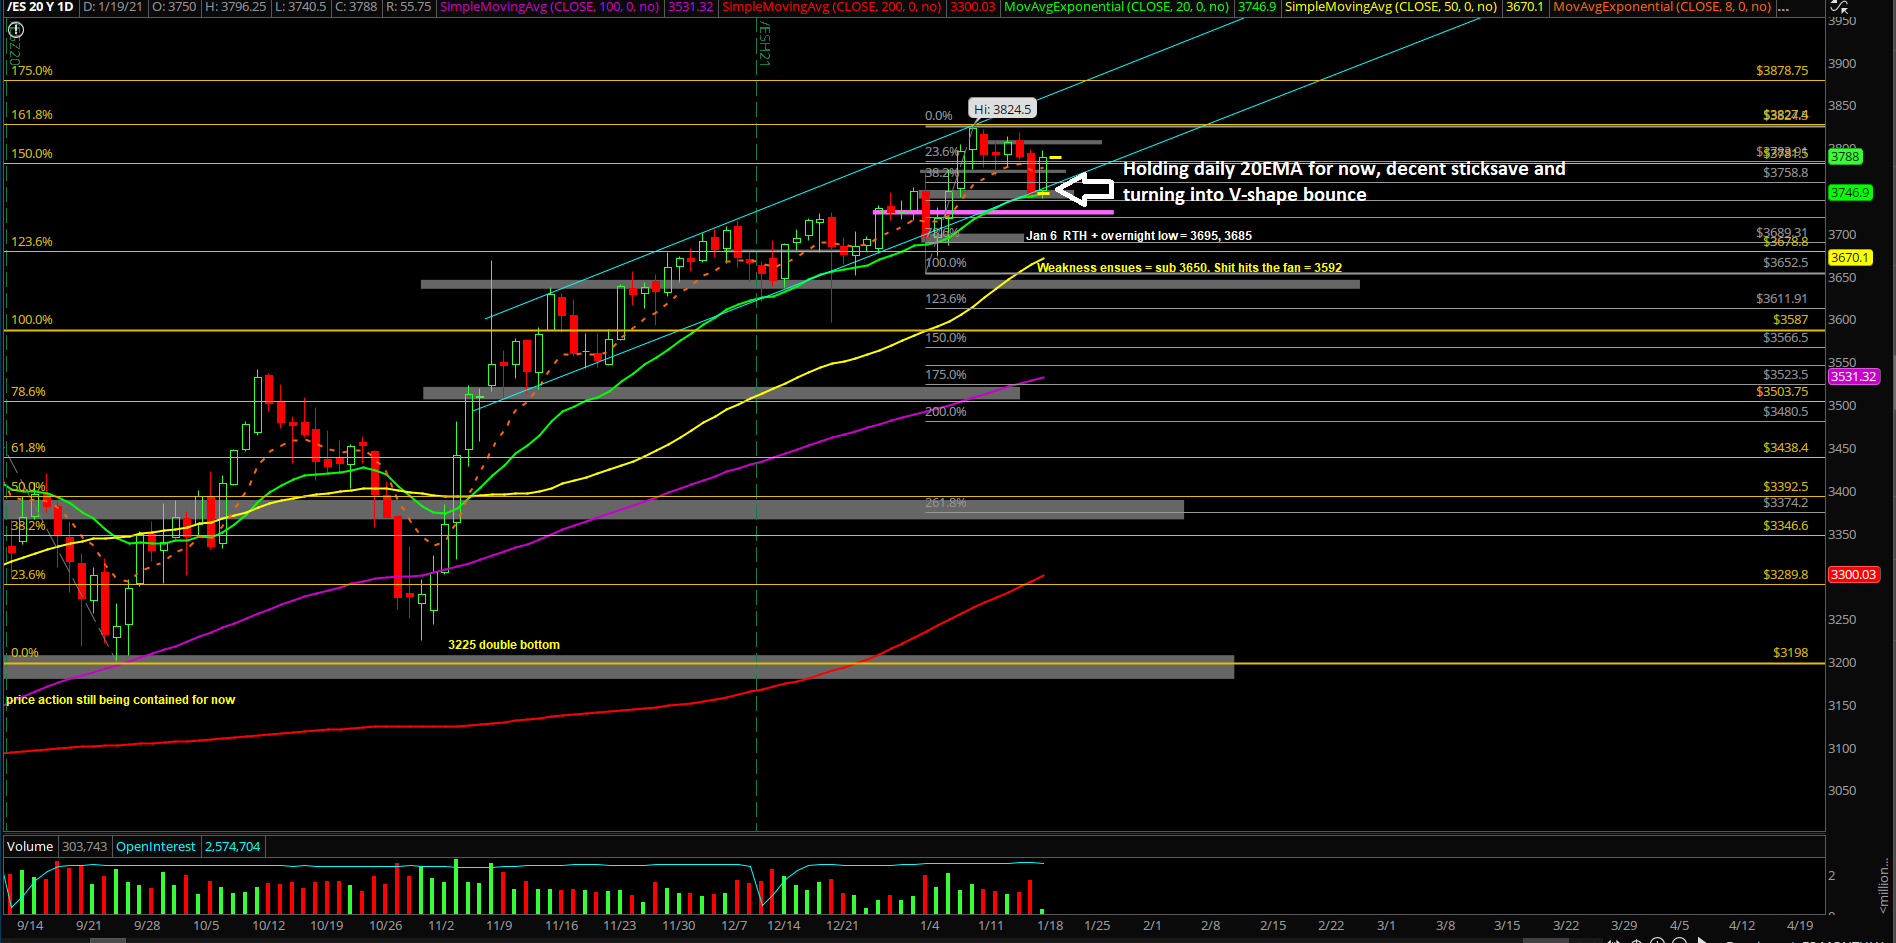
The main takeaway remains roughly the same; it’s been a healthy consolidation for the past few days and it looks more of the same going forward. Price action is doing its thing with stock rotations as the S&P 500 index hugs the daily 20EMA trending support combined with a confluence of key support area. The immediate V-shape recovery vs. ES 3740 is fairly telling that there’s an insatiable bid underneath the market so we’ll continue to monitor this for additional clues. Either way, it’s considered a bullish consolidation when above 3740 and weakness when below. No need to overcomplicate things here. Know your timeframes.
What’s next?
Friday closed at 3746.25 around the low of the week and right at the daily 20EMA + 3740-3750 confluence of support that we had mapped out a few days ago.
Copying and pasting a core section from our ES trade alert room’s premarket gameplan report where we demonstrate real-time trades and educational lessons. FYI, the ES trade room provides real-time entries and exits with pre-determined stoploss and target levels alongside with real-time lessons on strategy/risk management/psychology/momentum. (some key levels have been redacted for fairness to subscribers)
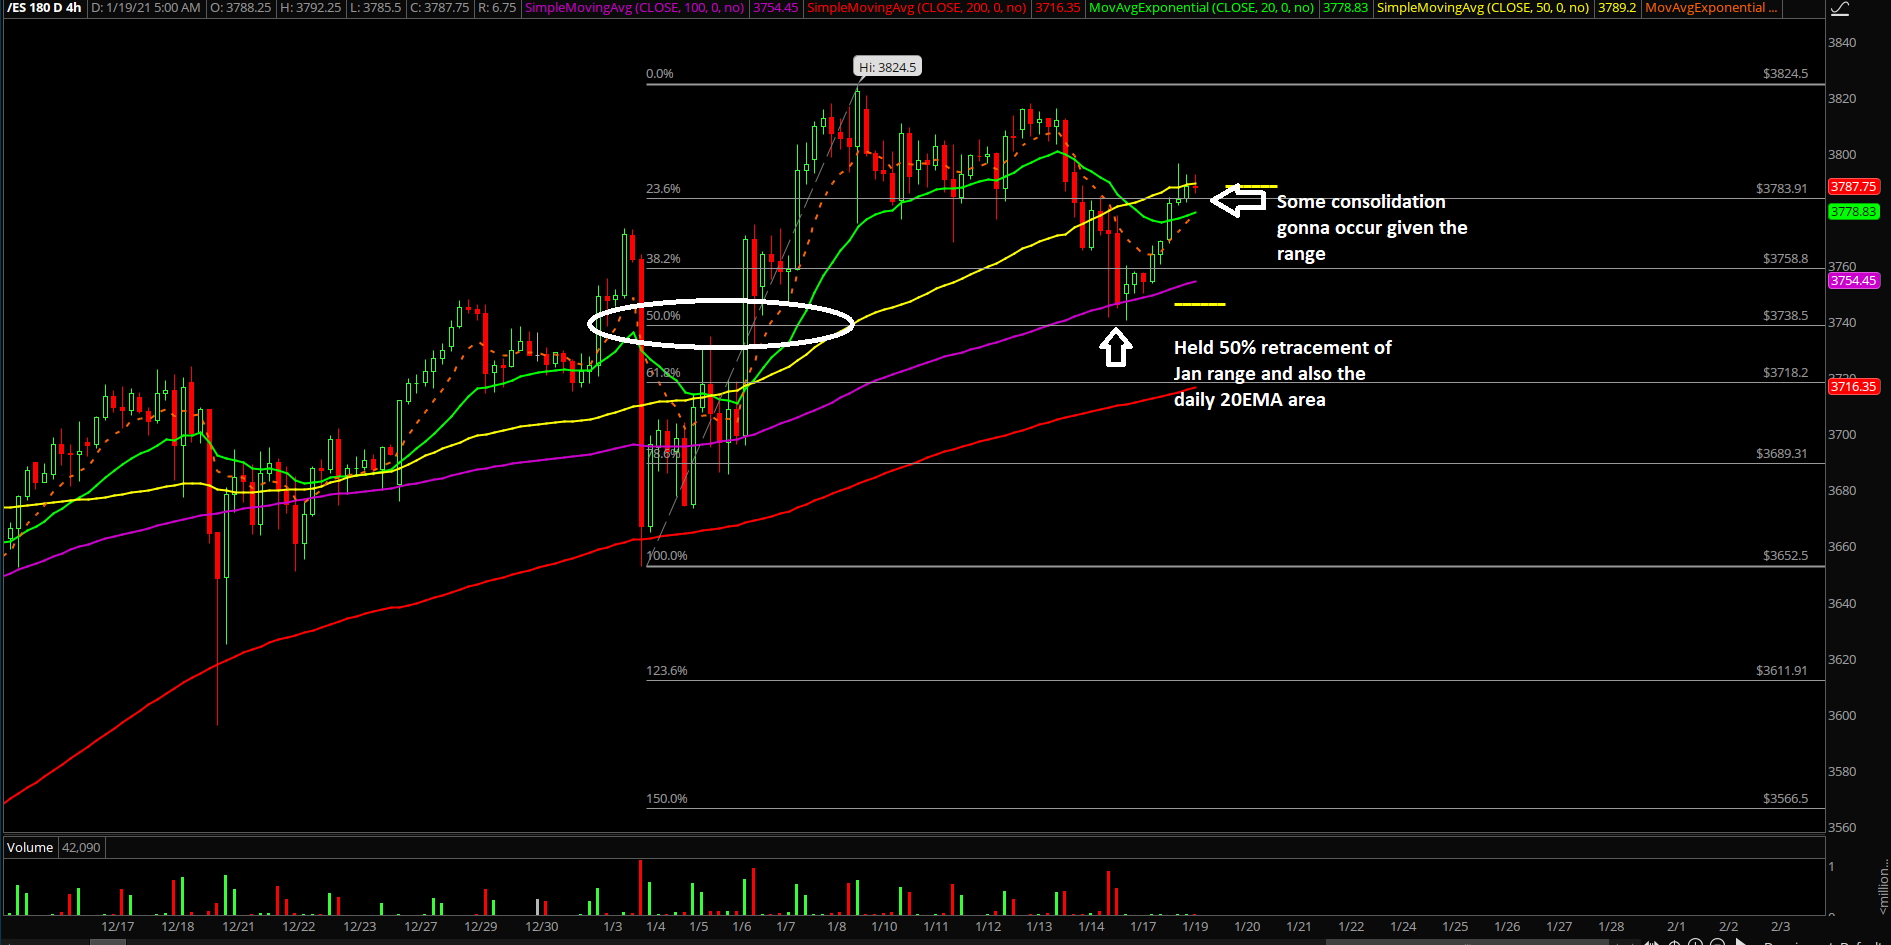
- Last Friday backtested into our 3740-3750 key support zone to shake out some weka hands, which represented the daily 20EMA trending support combined with the 50% fib retracement area of the entire rally from 3652.5-3824.50 (first week of Jan)
- Heading into this week, it’s fairly simple to judge momentum as price action made a V-shape recovery vs the 3740 level. The main focus is whether price action could stay above 3740 for the rest of this week as the daily chart rebuilds another basing pattern vs the daily 20EMA /confluence area in order for the bull train to head higher eventually
- Remember, it’s still an inside week trading range within the first week of Jan’s massive range 3824.5-3652.50. Be prepared to trade range bound for next few sessions until price is outside the boumdaries. Smaller range = 3810-3740
- Micro wise, watch out for some consolidation this morning/today because most of the ‘easy’ action already completed from 3740->3790s by forcing a 100% retracement of Friday’s entire range. A standard consolidation would be a revisit back into 3760s area (50-61.8% fib) then re-configure
- A break above 3810 would be the first indication that bulls are ready and finished with consolidation in order to re-attempt all time highs 3820s and beyond
- A break below 3740 would open up immediate lower levels such as 3700/3695/3685
Additional context from past few weeks remain mostly unchanged (copied and pasted):
- The shit hits the fan (SHTF) level has moved up to 3592 from 3575, a daily closing print below 3592 is needed in order to confirm a temp top setup/reversal for the daily timeframe. (December lows)
- A break below 3650 would be the first indication of weakness given the multi-month trend of being above the daily 20EMA train tracks. For reference, the first week of 2021 (Jan 4th) bottomed out at 3650s vs the daily 20EMA/major support confluence area and then swiftly made new all time highs per our expectations as support held
- For reference, as discussed in the past reports; a breakout of the 3587-3198 range = 3587+389 = 3976 (100% measured move target). Market is still at least 200 points away or another 5% away as of writing from bigger picture target. (price +5% since 3587 thus far)
- Please know and understand the timeframes in this report, it is overwhelming, but when/if short-term aligns with bigger picture…it is often a recipe of success. Timeframe alignment 101
- NQ/tech backtesting against its trending support area which coincides with the prior breakout area. Will need to monitor how NQ keeps holding 12400-12500 in order to ramp higher or need to backtest lower levels. As of Jan 7, NQ continues to hold as Jan 6th low = 12491.25 by forming the low of the week and NQ doing another round of rotations. See if next few days NQ able to lead again once it finishes taking this time to digest. As of Jan 13, NQ outperformed during end of last week into new all time highs as expected and now doing a healthy consolidation alongside with ES
- Just be aware that many bad portfolio managers will continue their dash into trash stocks (small caps) in order to try and chase alpha to make up for their poor yearly performance. See RTY:ES or IWM:SPX ratio. Never underestimate the FOMO ability as people fear for their jobs/likelihood during the 4th quarter and beyond. Great outperformance from RTY/IWM thus far
As of Jan 13, 2021, RTY is up another + 15% since Dec 2 when we formally published RTY into our reports to showcase additional setups and the fact that it doesn't take a genius to generate alpha in a bull market… amazing outperformance since March 2020 low. Very easy if you have a system in place as you’re only piggybacking off of the institutional + price momentum