Market Analysis for Jan 7th, 2021
E-mini S&P 500 Futures: Keep It Simple Stupid – No Surprises, Backtest Into Daily 20EMA Held, New All Time Highs
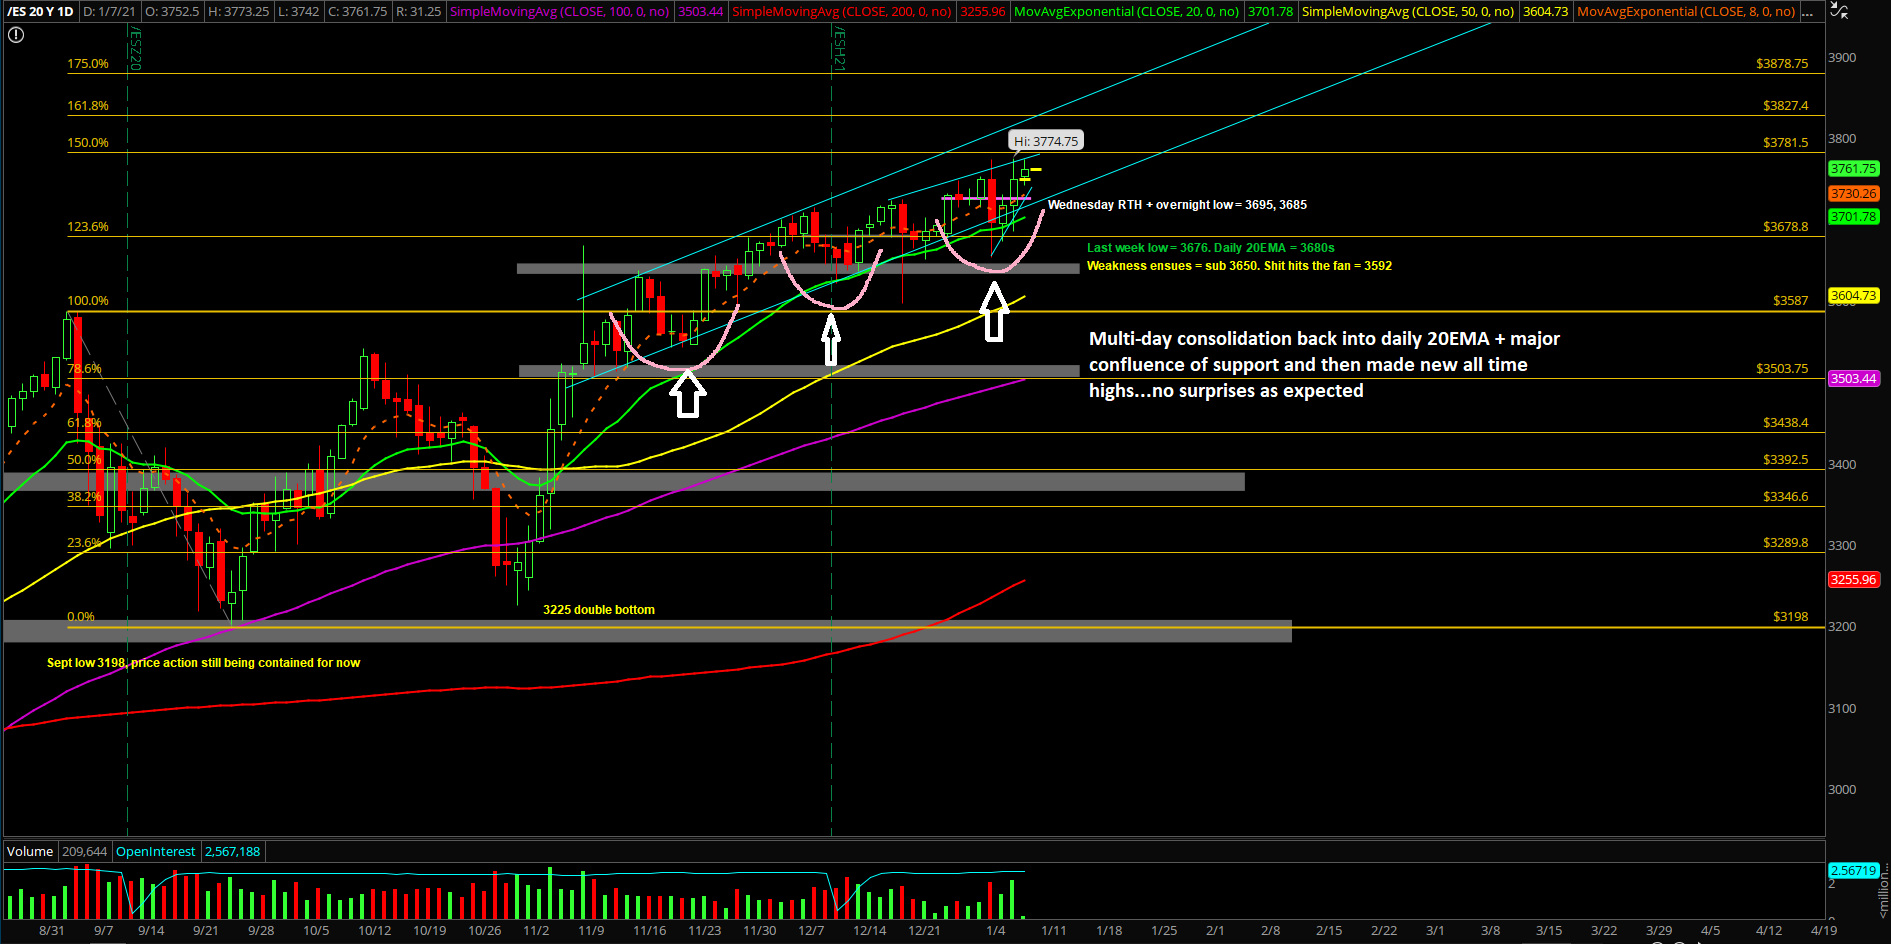
Wednesday’s session started as an inside/range day expectation and then swiftly broke above the 3724/3738 key immediate resistances indicating that the bulls were ready immediately for a trend day potential. Essentially, the opening RTH low at 3695s and the price action just ignited right off the bat and continued higher for the rest of the day forming higher lows and higher highs on the lower timeframes.
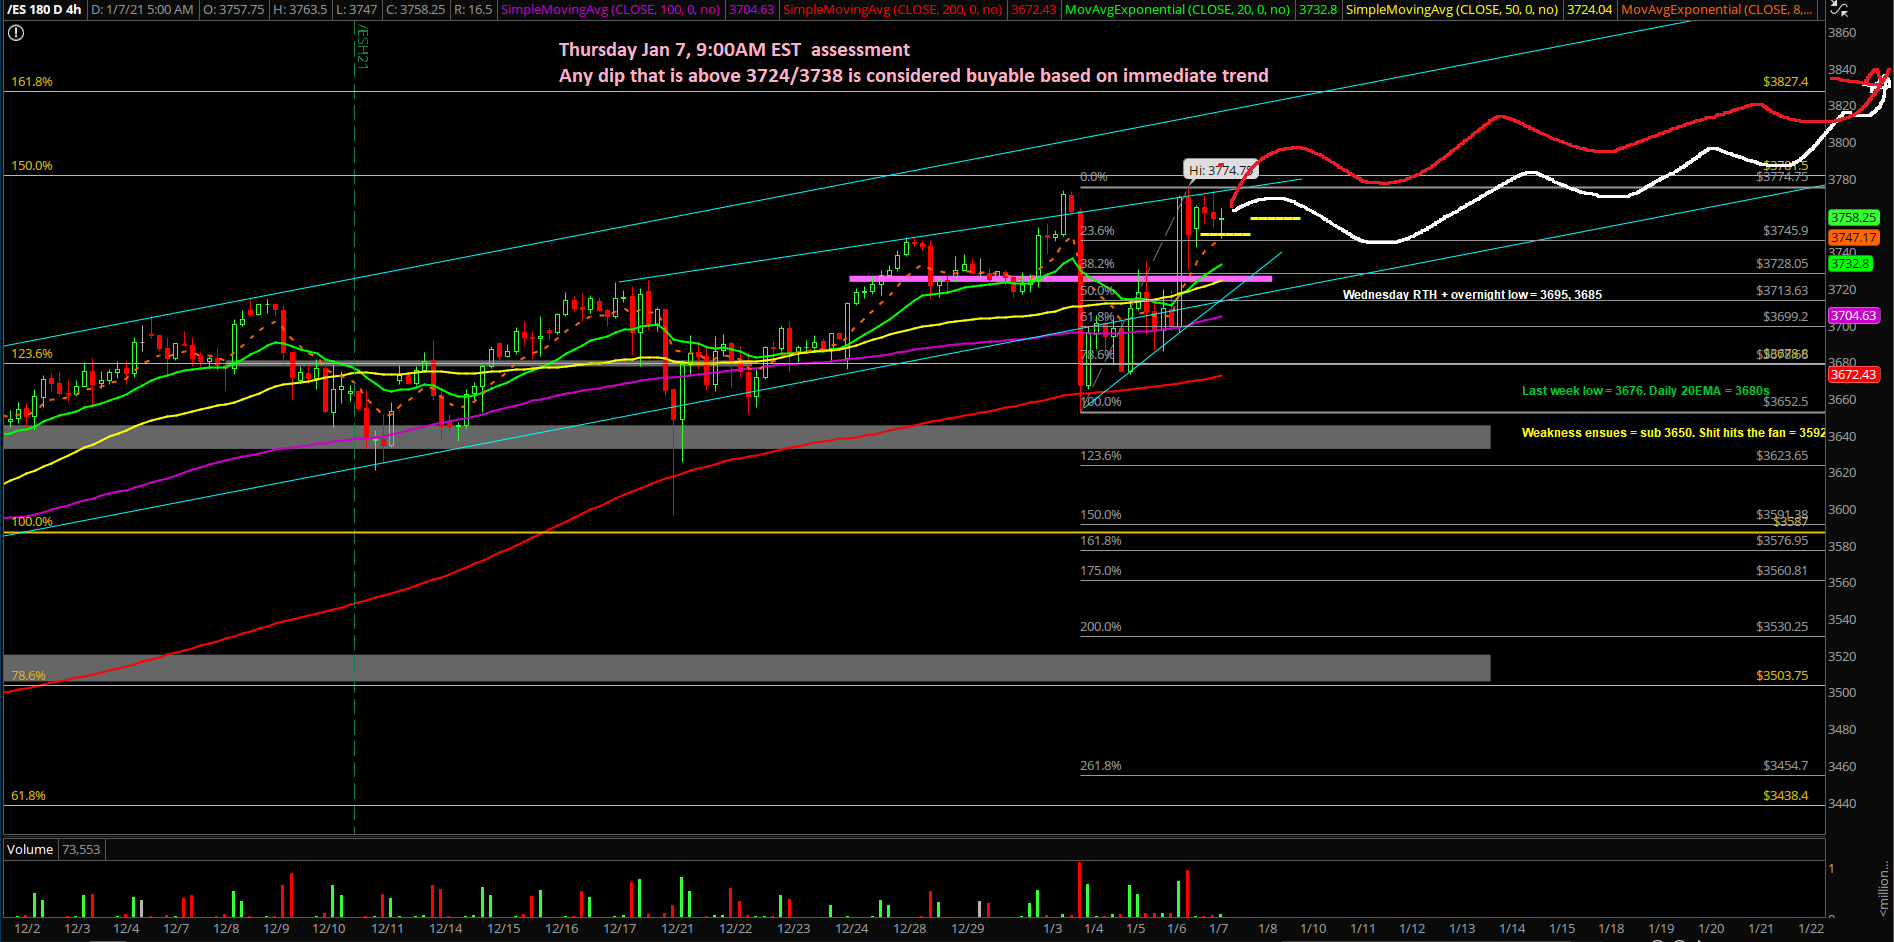
The main takeaway is remains the same. Price action has demonstrated that it is following our expectations (Scenario 1 from Monday) where it’s just a bottoming setup vs the daily 20EMA + support confluence area. Bulls confirmed momentum yesterday with a new all time highs print on ES. The bull train is geared towards the 3780-3800 target, then opens up new targets if/when fulfilled.
What’s next?
Wednesday closed at 3749.25 with an intraday high of 3774.75 and overnight low of 3685.50. Basically, retracing all the losses from Monday and made a new all time highs. Bears are trapped, bulls win again. Déjà vu, it’s a bull market.
Copying and pasting a core section from our ES trade alert room’s premarket gameplan report where we demonstrate real-time trades and educational lessons. FYI, the ES trade room provides real-time entries and exits with pre-determined stoploss and target levels alongside with real-time lessons on strategy/risk management/psychology/momentum. (some key levels have been redacted for fairness to subscribers)
- Expecting a range day that could force into a bulish trend day, or price takes a breather and delays the attempt until tomorrow for the weekly highs closing print (it’s considered a slow grind up week pattern). Target remains the same at 3780-3800. Once fulfilled, opens up higher
- So far this week offered one 1 surprise and that was the Monday gap up and crap into backtesting daily 20EMA + strong confluence support area. Then, the price action just followed our (Scenario 1) expectations/visual projection on the daily chart in regards to forming the 1-3 days bottom and eventual backtest into new ATHs
- As discussed yesterday, we’re treating this week’s low of 3652.50 as in and yesterday’s low area of 3685-3695 (Tuesday overnight low+RTH low) as in
- This means that today’s main focus is about the higher lows formation with trending supports at 3724/3738. For reference, the current overnight low = 3742 so bulls are doing a great job
- No shorting allowed when above yesterday’s RTH low of 3695, trend is your friend for now
- Level by level approach and know your timeframes here. You must adapt your opinion and expectations with the ever changing market.
Additional context from past few weeks remain mostly unchanged (copied and pasted):
- The shit hits the fan (SHTF) level has moved up to 3592 from 3575, a daily closing print below 3592 is needed in order to confirm a temp top setup/reversal for the daily timeframe. A break below 3650 would be the first indication of weakness given the multi-month trend of being above the daily 20EMA train tracks
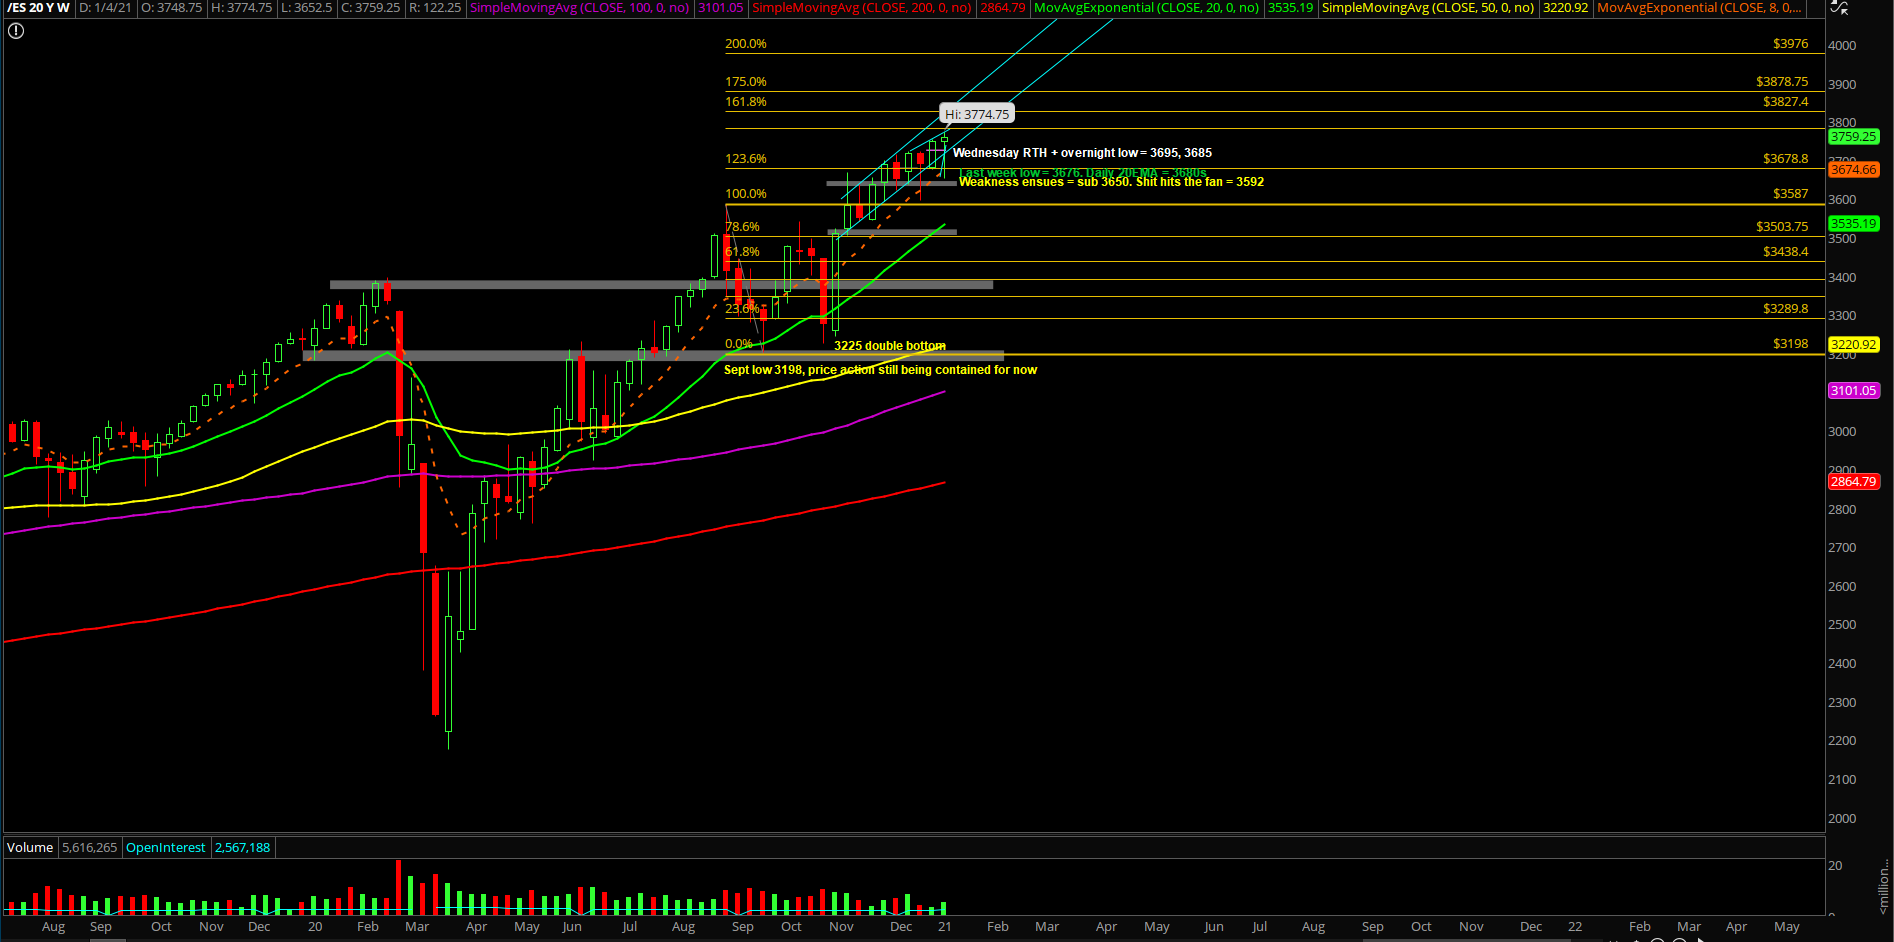
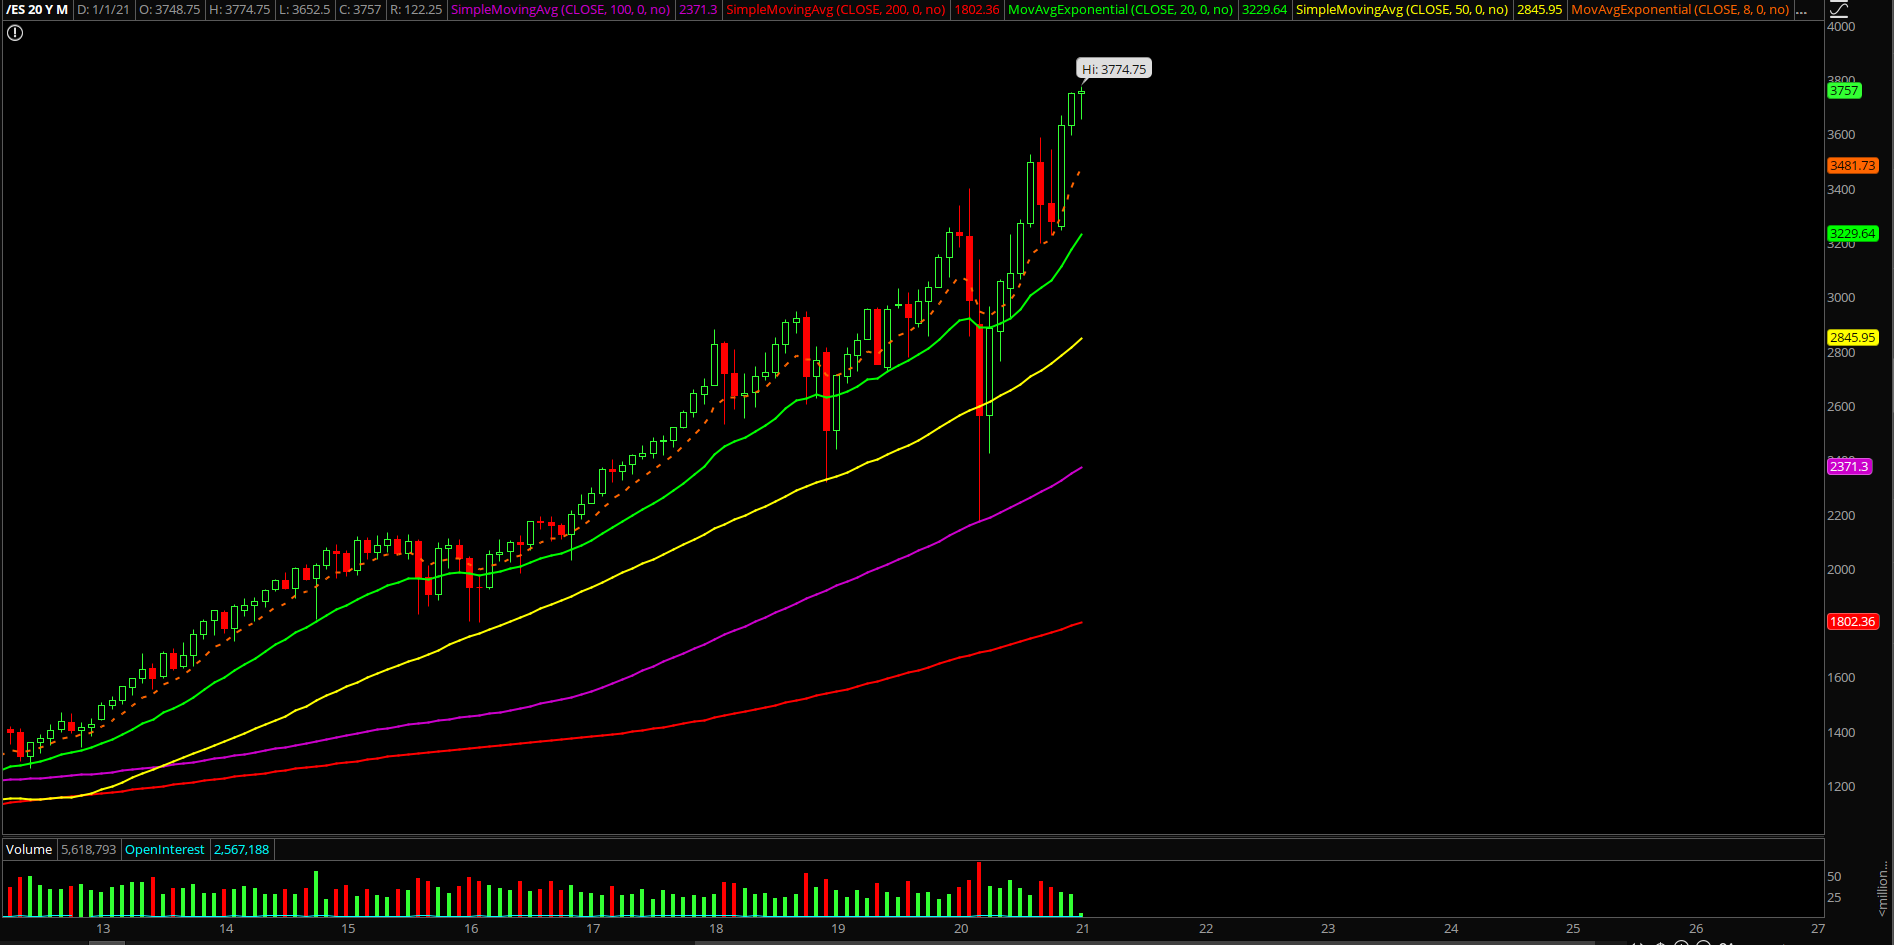
- For reference, as discussed in the past reports; a breakout of the 3587-3198 range = 3589+389 = 3976 (100% measured move target). Market is still at least 300 points away or another 8% away as of writing from bigger picture target
- Please know and understand the timeframes in this report, it is overwhelming, but when/if short-term aligns with bigger picture…it is often a recipe of success. Timeframe alignment 101
- NQ/tech backtesting against its trending support area which coincides with the prior breakout area. Will need to monitor how NQ keeps holding 12400-12500 in order to ramp higher or need to backtest lower levels. As of Jan 7, NQ continues to hold as yesterday’s low = 12491.25 and forming the low and NQ doing another round of rotations. See if next few days NQ able to lead again once it finishes taking this time to digest
- Just be aware that many bad portfolio managers will continue their dash into trash stocks (small caps) in order to try and chase alpha to make up for their poor yearly performance. See RTY:ES or IWM:SPX ratio. Never underestimate the FOMO ability as people fear for their jobs/likelihood during the 4th quarter and beyond. Great outperformance from RTY/IWM thus far
(As of Jan 7, 2021, RTY is up another + 12% since Dec 2 when we formally published this into our reports to showcase additional setups and the fact that it doesn't take a genius to generate alpha in a bull market… amazing outperformance since March 2020 low)


