Market Analysis for Jan 6th, 2021
 By
Ricky Wen
By
Ricky Wen
E-mini S&P 500 Futures: Keep It Simple Stupid – Same Old Story, Forming Another Bottom
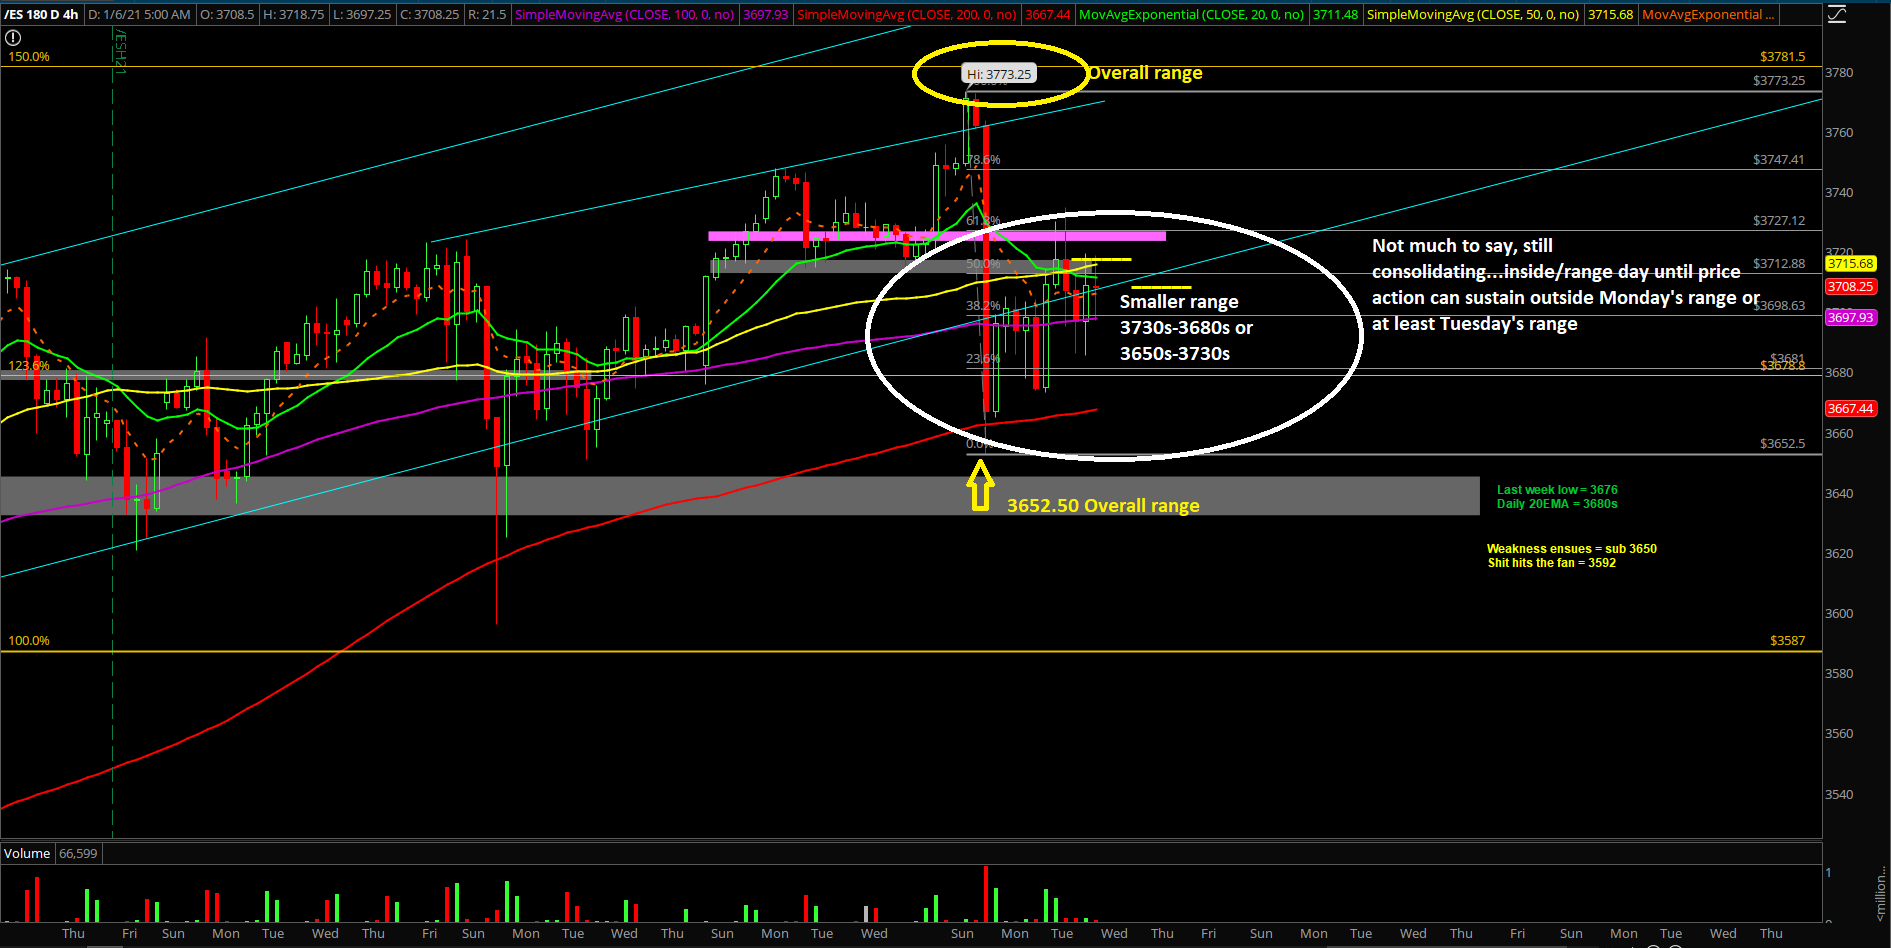
Tuesday’s session was an inside/range day as expected as price action took time and digested within Monday’s massive range. Basically, the session was spent testing range low to range high as it gave opportunities for both directional traders to pounce on. As demonstrated in real-time, we captured a few points as well in our ES trading room.
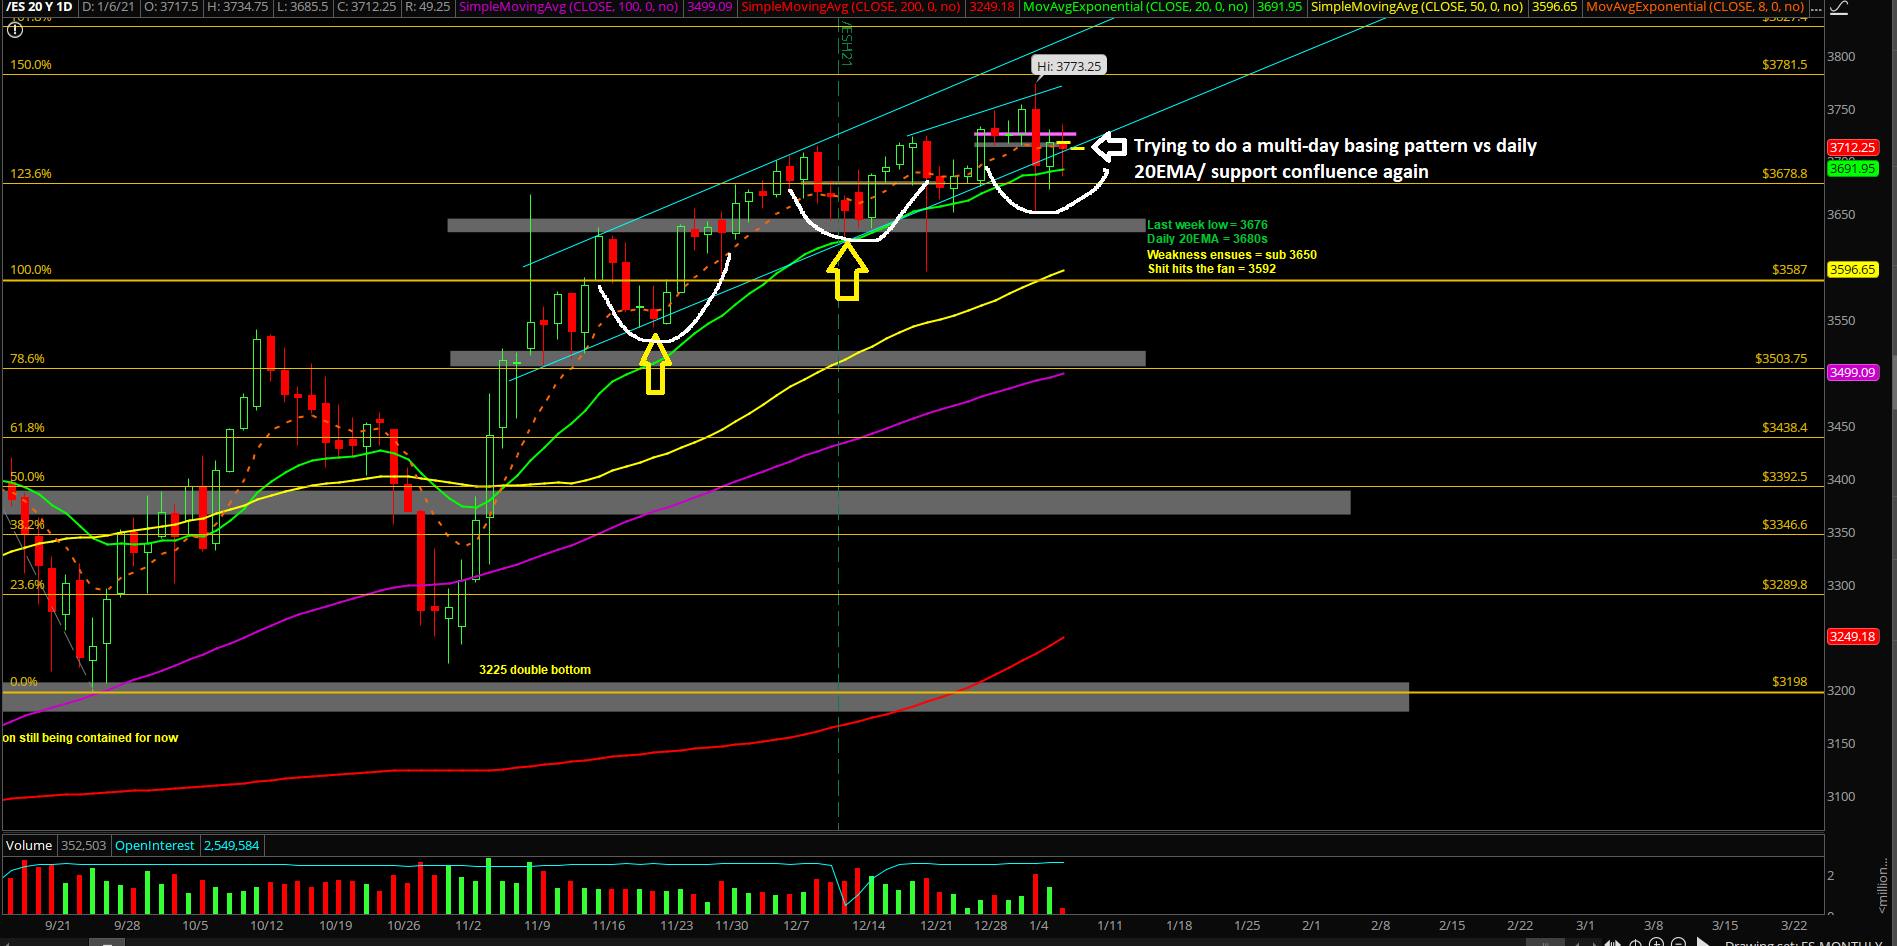
The main takeaway is remains the same. Traders now have to figure out whether this is just a typical swift backtest into the daily 20EMA and then it stabilizes in order to form the base for the eventual ATHs/higher highs grind. The other scenario being this time is different and we finally get a surprise to the downside. We’re expecting the former, but will adapt if the latter proves its case.
What’s next?
Tuesday closed at 3717.5 and as of writing the price action is hovering at 3708. Meaning the chances of another inside/range day within the massive Monday range is likely until proven otherwise.
Copying and pasting a core section from our ES trade alert room’s premarket gameplan report where we demonstrate real-time trades and educational lessons. FYI, the ES trade room provides real-time entries and exits with pre-determined stoploss and target levels alongside with real-time lessons on strategy/risk management/psychology/momentum. (some key levels have been redacted for fairness to subscribers)
- Expecting another inside/range day on ES, stick with rangebound strategies until further notice
- If price remain within this range for the first 2 hours after RTH open, then today’s price could be stuck within 3680s-3730s as the market formulates the multi-day bottoming setup vs daily 20EMA/ confluence of support
- As traders, our job is to figure out whether the market is just doing a typical backtest/resetting momentum in order to grind higher or something wrong and the backtest escalates into lower levels before it stabilizes. During Monday, we discussed 2 scenarios and imposed on daily charts
- If you recall, scenario 1 is about a basing setup around 3650 if it holds to setup the next ramp
- Scenario 2 is about a breakdown continuation into the next key region of 3600/3592/3587
- For now, the market is still following our expectations from scenario 1 as price action is doing a bullish consolidation on the daily chart timeframe in order to digest Monday’s move and re-attempt higher at a later date. Obviously, this is valid only when above 3650 (current week’s low)
- Must hold support right now is 3650 given Monday’s temporary pivot from the 3652.50 low
- Must hold resistance right now is 3724/3738 given Tuesday’s rangebound price action. It coincides with the 61.8%-78.6% fib retracement zone
- Level by level approach and know your timeframes here. You must adapt your opinion and expectations with the ever changing market. Don’t get married as the first session of this year told us it’s not just a slow, almost linear like grind up into ATHs. Instead, it involves a few waves
Additional context from past few weeks remain mostly unchanged (copied and pasted):
- The shit hits the fan (SHTF) level has moved up to 3592 from 3575, a daily closing print below 3592 is needed in order to confirm a temp top setup/reversal for the daily timeframe. A break below 3650 would be the first indication of weakness given the multi-month trend of being above the daily 20EMA train tracks
- For reference, as discussed in the past reports; a breakout of the 3587-3198 range = 3589+389 = 3976 (100% measured move target). Market is still at least 300 points away or another 8% away as of writing from bigger picture target
- Please know and understand the timeframes in this report, it is overwhelming, but when/if short-term aligns with bigger picture…it is often a recipe of success. Timeframe alignment 101
- NQ/tech backtesting against its trending support area which coincides with the prior breakout area. Will need to monitor how NQ keeps holding 12400-12500 in order to ramp higher or need to backtest lower levels.
- Just be aware that many bad portfolio managers will continue their dash into trash stocks (small caps) in order to try and chase alpha to make up for their poor yearly performance. See RTY:ES or IWM:SPX ratio. Never underestimate the FOMO ability as people fear for their jobs/likelihood during the 4th quarter and beyond. Great outperformance from RTY/IWM thus far
(As of Jan 6, 2021, RTY is up another + 10% since Dec 2 when we formally published this into our reports to showcase additional setups and the fact that it doesn't take a genius to generate alpha in a bull market… amazing outperformance since March 2020 low)