Market Analysis for Oct 21st, 2020
 By
Ricky Wen
By
Ricky Wen
E-mini S&P 500 Futures: Keep It Simple Stupid – Can Bears Actually Follow Through or Déjà vu Again?
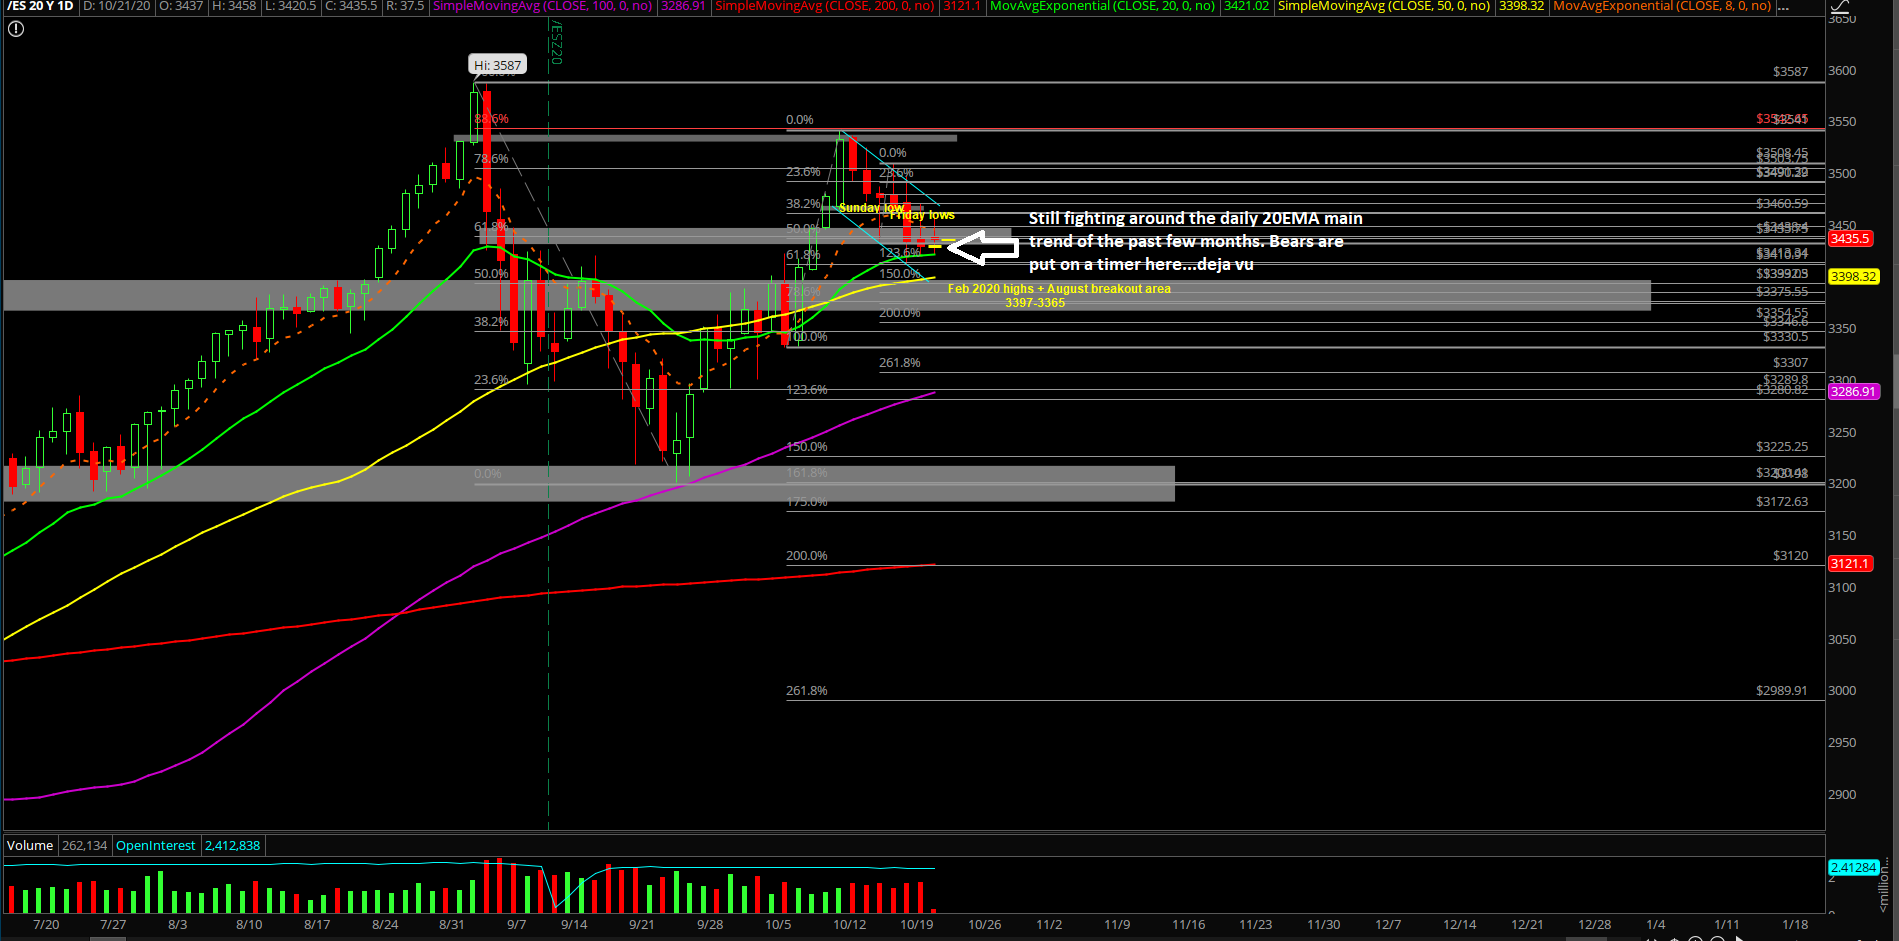
Tuesday’s session showcased an inside day/digestion where price got a reset after Monday’s trend day down. This allowed price action to consolidate a bit in order to setup for the next big move. It was a fairly standard range day where it pierced above 3465 for a few minutes and then got knocked back down to backtest support at 3420s. The crucial move is incoming for midweek as it sets the tone for rest of the week.
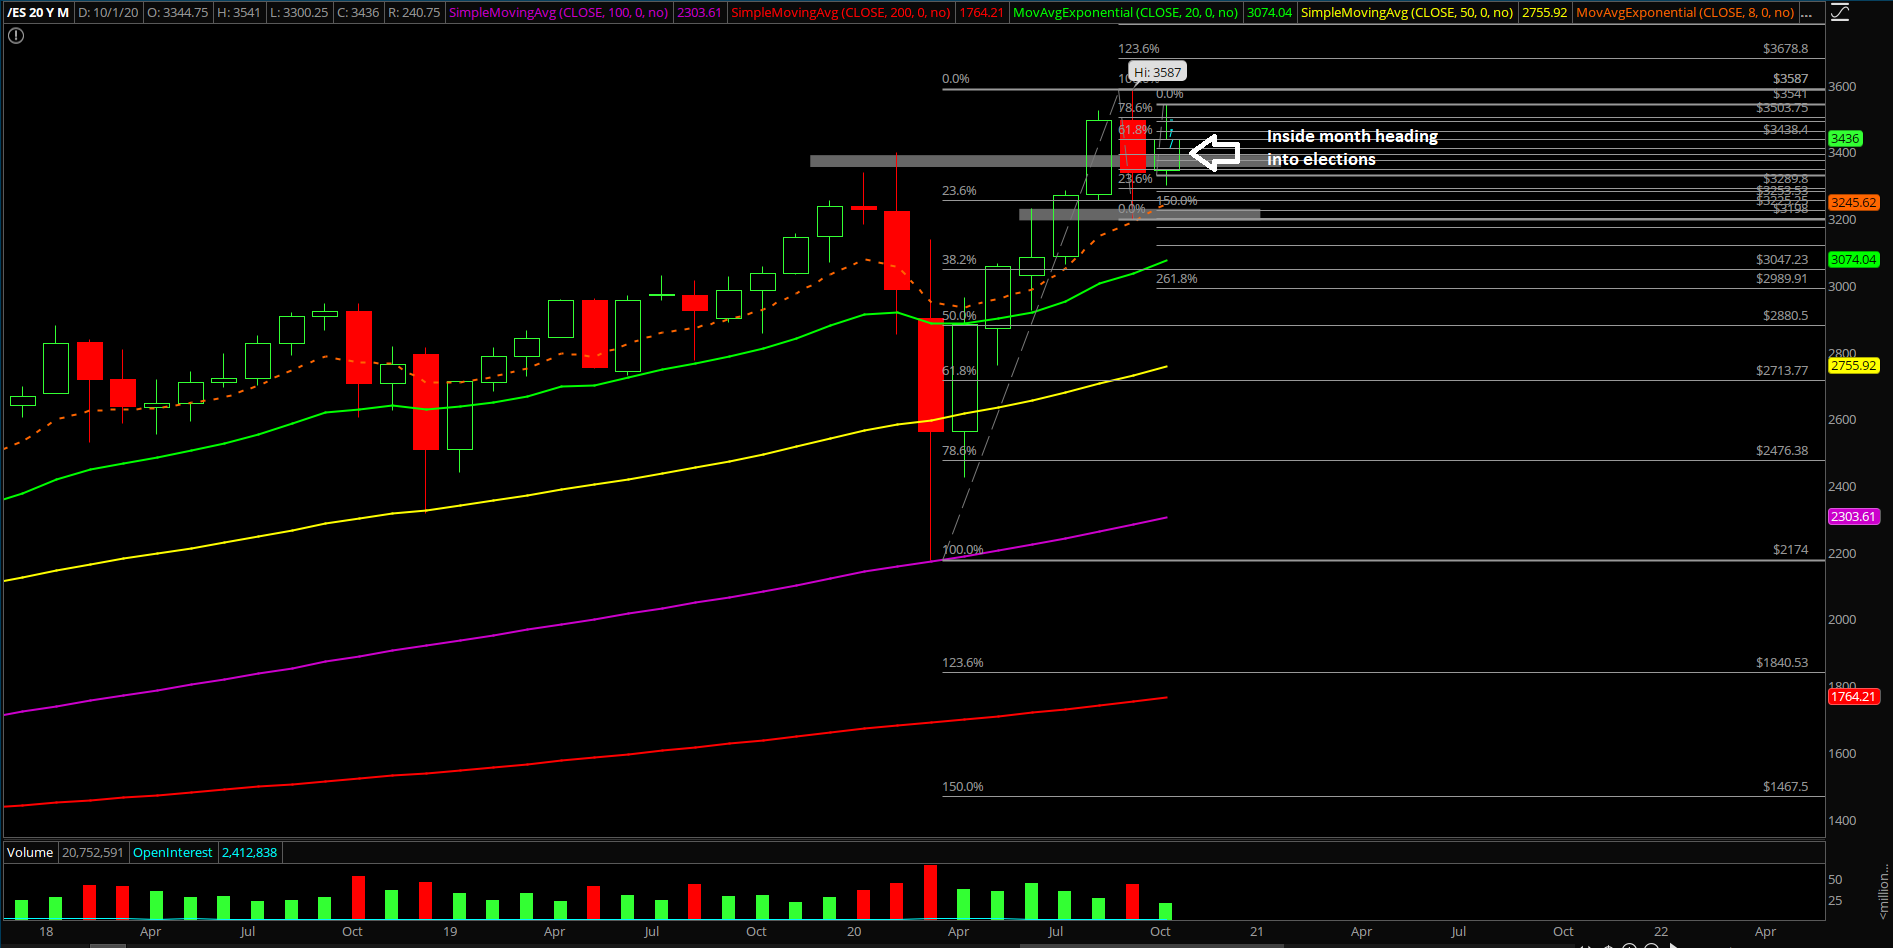
The main takeaway/context for the bigger picture remains the same again given last week’s low could be treated as in. Short-term timeframes back into alignment with the higher timeframes. Repeat existing context: the ES 3198 temporary bottom from Sept 24 could be the bigger picture bottom as we head into the rest of Q4 2020. This is a possibility given that price sticksaved/bottom against a key support confluence and has been building a basing pattern since then. Obviously, the wild card is the upcoming elections and likely the volatility/whipsaw will commence shortly and test this theory. We just have to implant that idea if this year is going for the year end highs closing print again as we discussed a few times since the V-shape reversal from March.
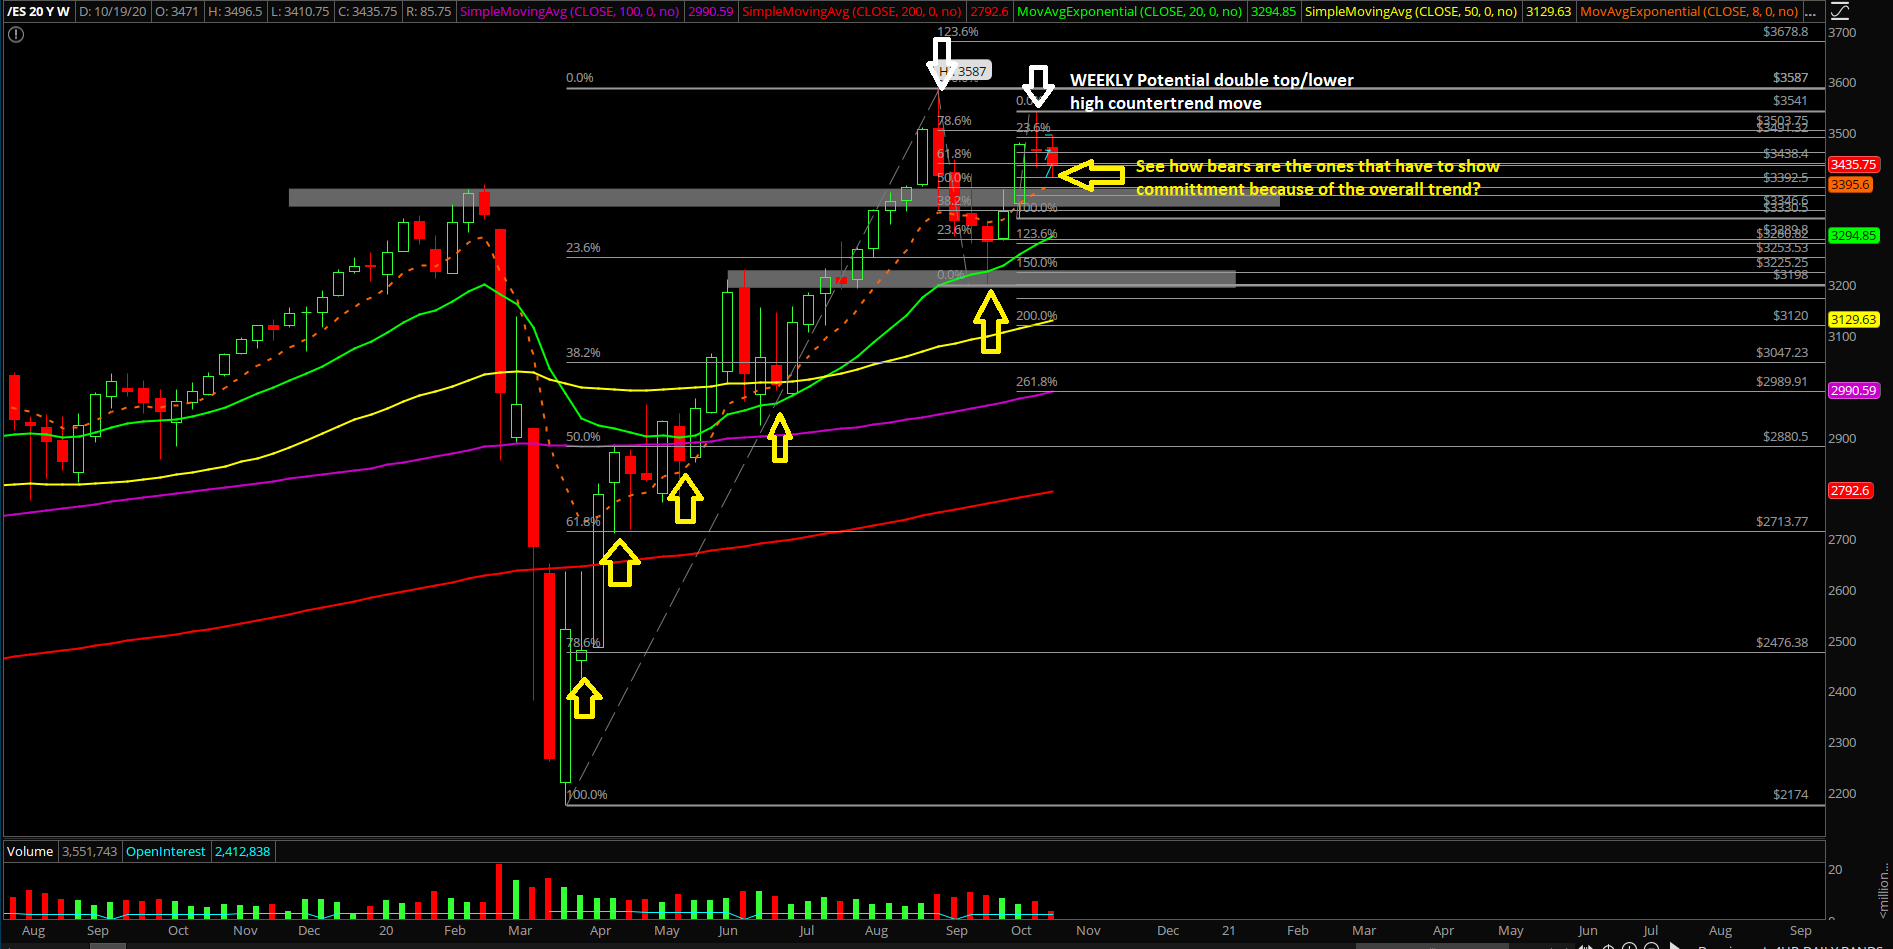
The current wild card is that last week’s high could be potentially considered as a double top/lower high given 3587 ATHs vs 3541 temporary high. It is up to bears to follow through and show additional continuation/commitment to the downside pattern. They are on a timer here and must decisively break below daily 20EMA to disallow yet another V-shape recovery/sticksave vs the main trend of the past few months.
What’s next?
Tuesday closed at 3428 near the day’s low and was below last week’s low of 3431.50 by a few points. No one has won the big battle yet so nothing has changed in regards to the parameters.
Copying and pasting a core section from our ES trade alert room’s premarket gameplan report where we demonstrate real-time trades and educational lessons. For additional details/key levels, please read or subscribe to the other report in entirety first to understand context if confused. FYI, the ES trade room provides real-time entries and exits with pre-determined stoploss and target levels alongside with real-time lessons on strategy/risk management/psychology/momentum. ES Trade Alerts room has been outperforming the S&P benchmark alongside with many competitors as demonstrated with our official 5 year track record on EWT.
- If you recall, bears are the ones that are put on a timer here because they are countering the daily/weekly timeframes and have to show commitment by following through with lower highs and lower lows. This means that today is quite critical because it’s already mid-week and it could potentially set the tone for the rest of the week
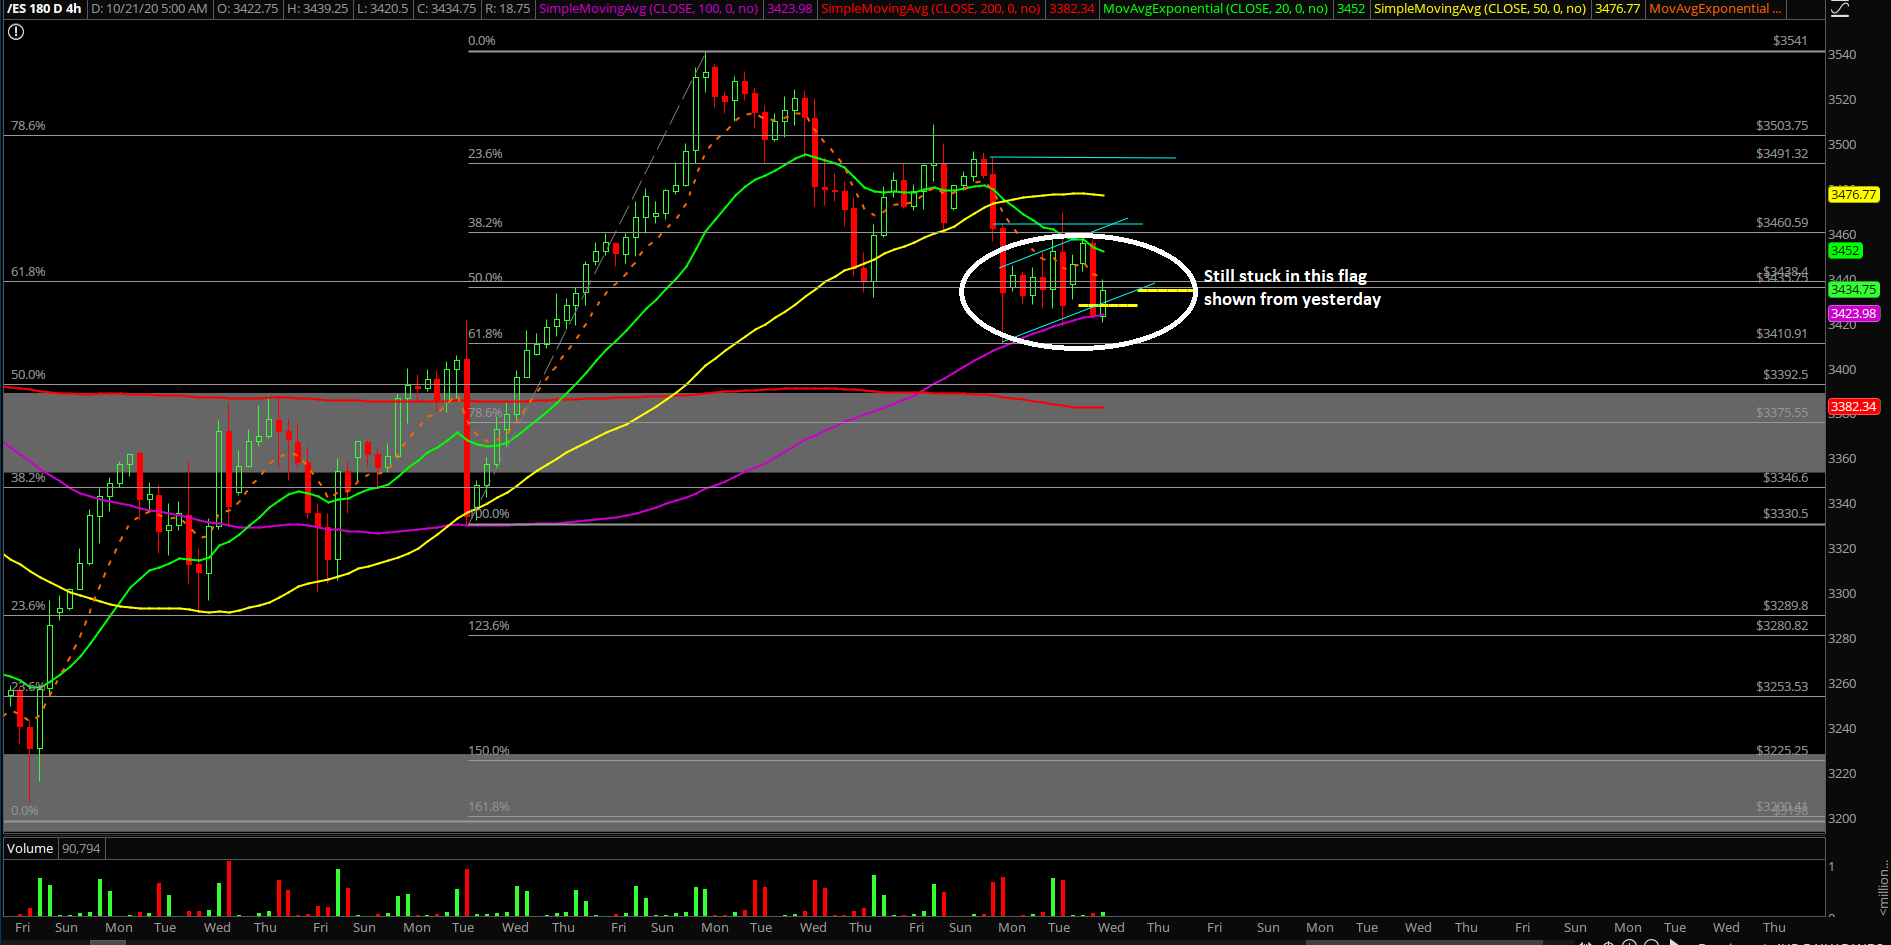
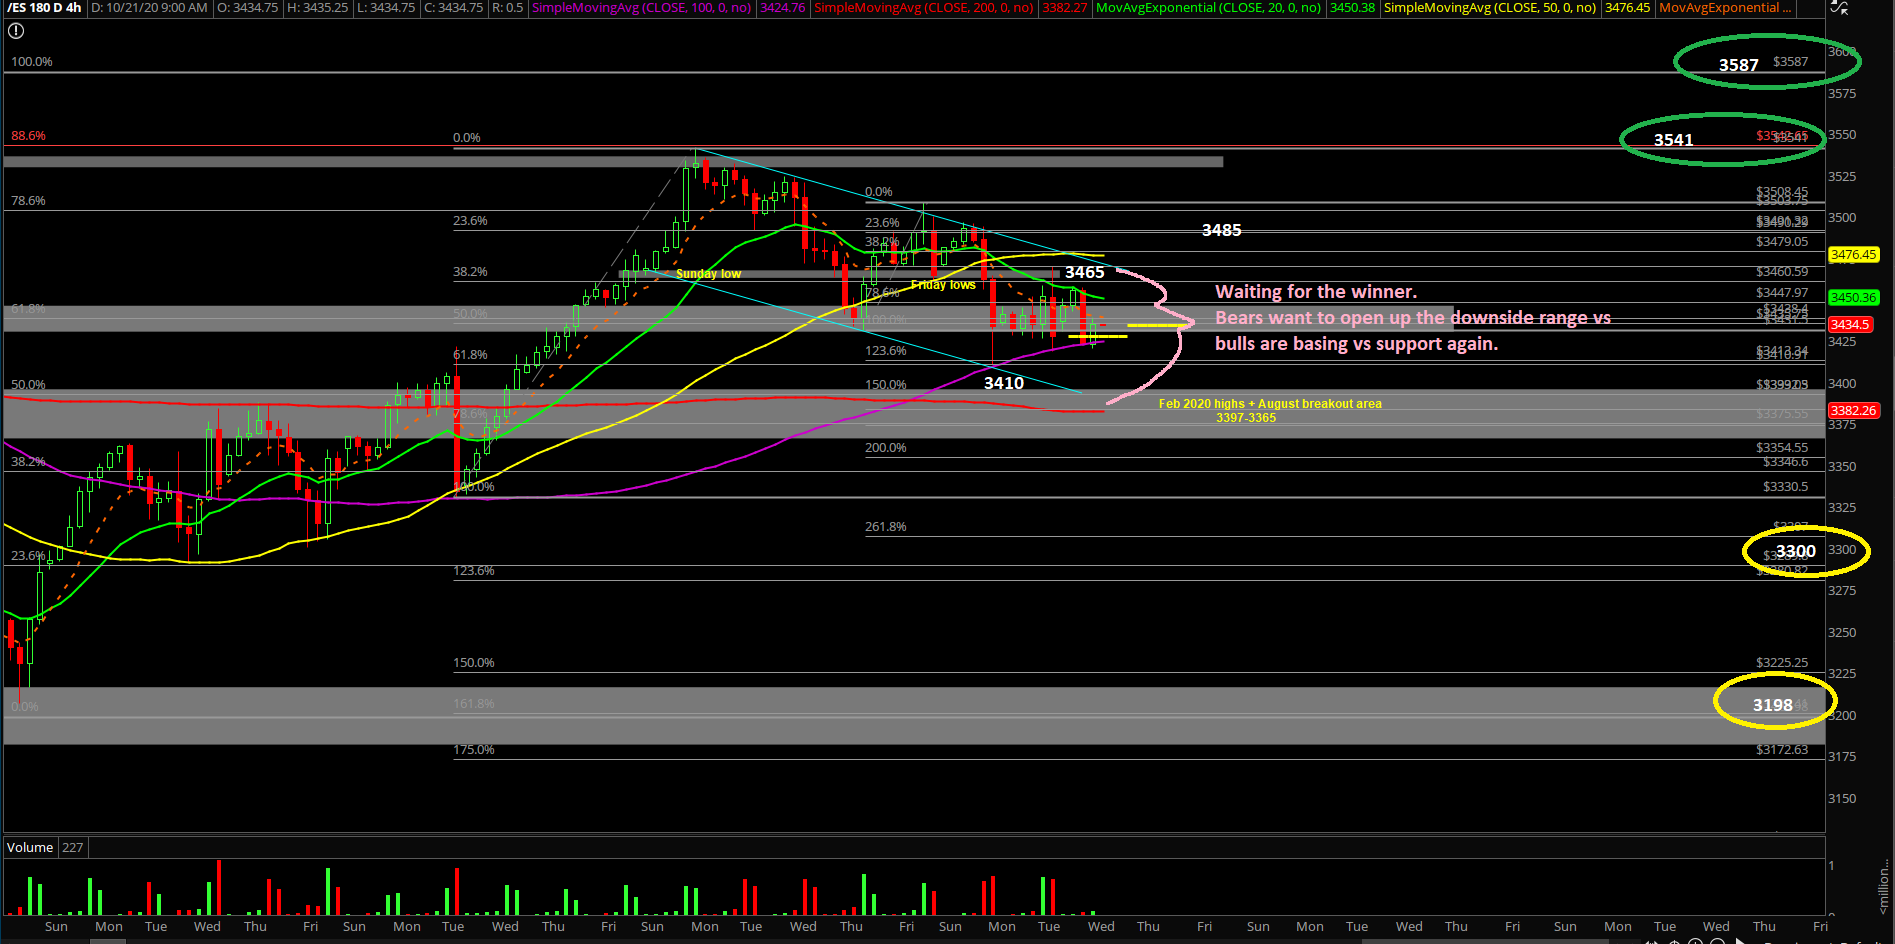
- Utilize the key levels identified, 3410 as key temporary support and immediate resistances of 3465/3485
- We are neutral bias on daily chart timeframe as price broke below last week’s low of 3431.5 and closed at 3433.75, whch was almost below it so it was a good tease. The low of yesterday was located at 3410.75 where the 61.8% (3410.91) and daily 20EMA aligned.
- We are bearish bias on short-term timeframes as long as price is below 3465/3485 and watching whether the higher daily timeframes whether it is basing with a cup and handle or bull flag setup back towards 3540s/3580s ATHs
- A break above 3465 would be a warning sign for bears. A break above 3485 would indicate that a V-shape reversal may be in the process given that it would mean 3410s held/sticksaved and price cannot hold the immediate bearish continuation pattern…déjà vu
- For bears, today is a crucial session because Monday was the initial breakdown, Tuesday was an inside day to reset/digest, so today must backtest and decisively break below 3410 followed by a continuation into the 3397-3365 zone quickly. If accomplishing that feat, it would threaten and open up the massive range of 3300/3198 levels again. Otherwise, the double top weekly chart pattern of 3587 vs 3541 goes to waste without a big threat of additional downside
- There’s still a big battle on the timeframes here so knowing your timeframes is here critical
- For reference, daily 20EMA has been the main trend for the past few months ever since the market bottomed in March, followed by the April V-shape reversal reclaiming the daily 8/20EMA and then running continuous higher lows and higher highs combined with bull flags/pennants/general continuation patterns off the existing trend
Additional context:
- Bears are threatening to potentially open up a bigger range which is massive because it spans from 3198-3541, meaning that the lower range is 3198 and current price is resting at 3430s. There’s still 200+ points until the last swing low which is about 6.7% movement. This is all predicated with last week’s weekly doji/potential double top/lower highs and the current breakdown below last week’s low of 3431.50. If you recall, last week’s high was 3541 and the all time highs is located at 3587. It was a decent rejection off of the 88.6% fib retracement + resistance confluence area
- See whether bears/price action is actually able to close below daily 20EMA and sustain below it. Otherwise, the risks are great for yet another V-shape reversal if bears turn back into gummy bears