2020 Rally Complete in Bitcoin & Ether?
 By
Ryan Wilday
By
Ryan Wilday
Bitcoin Intermediate- to Long-Term View:
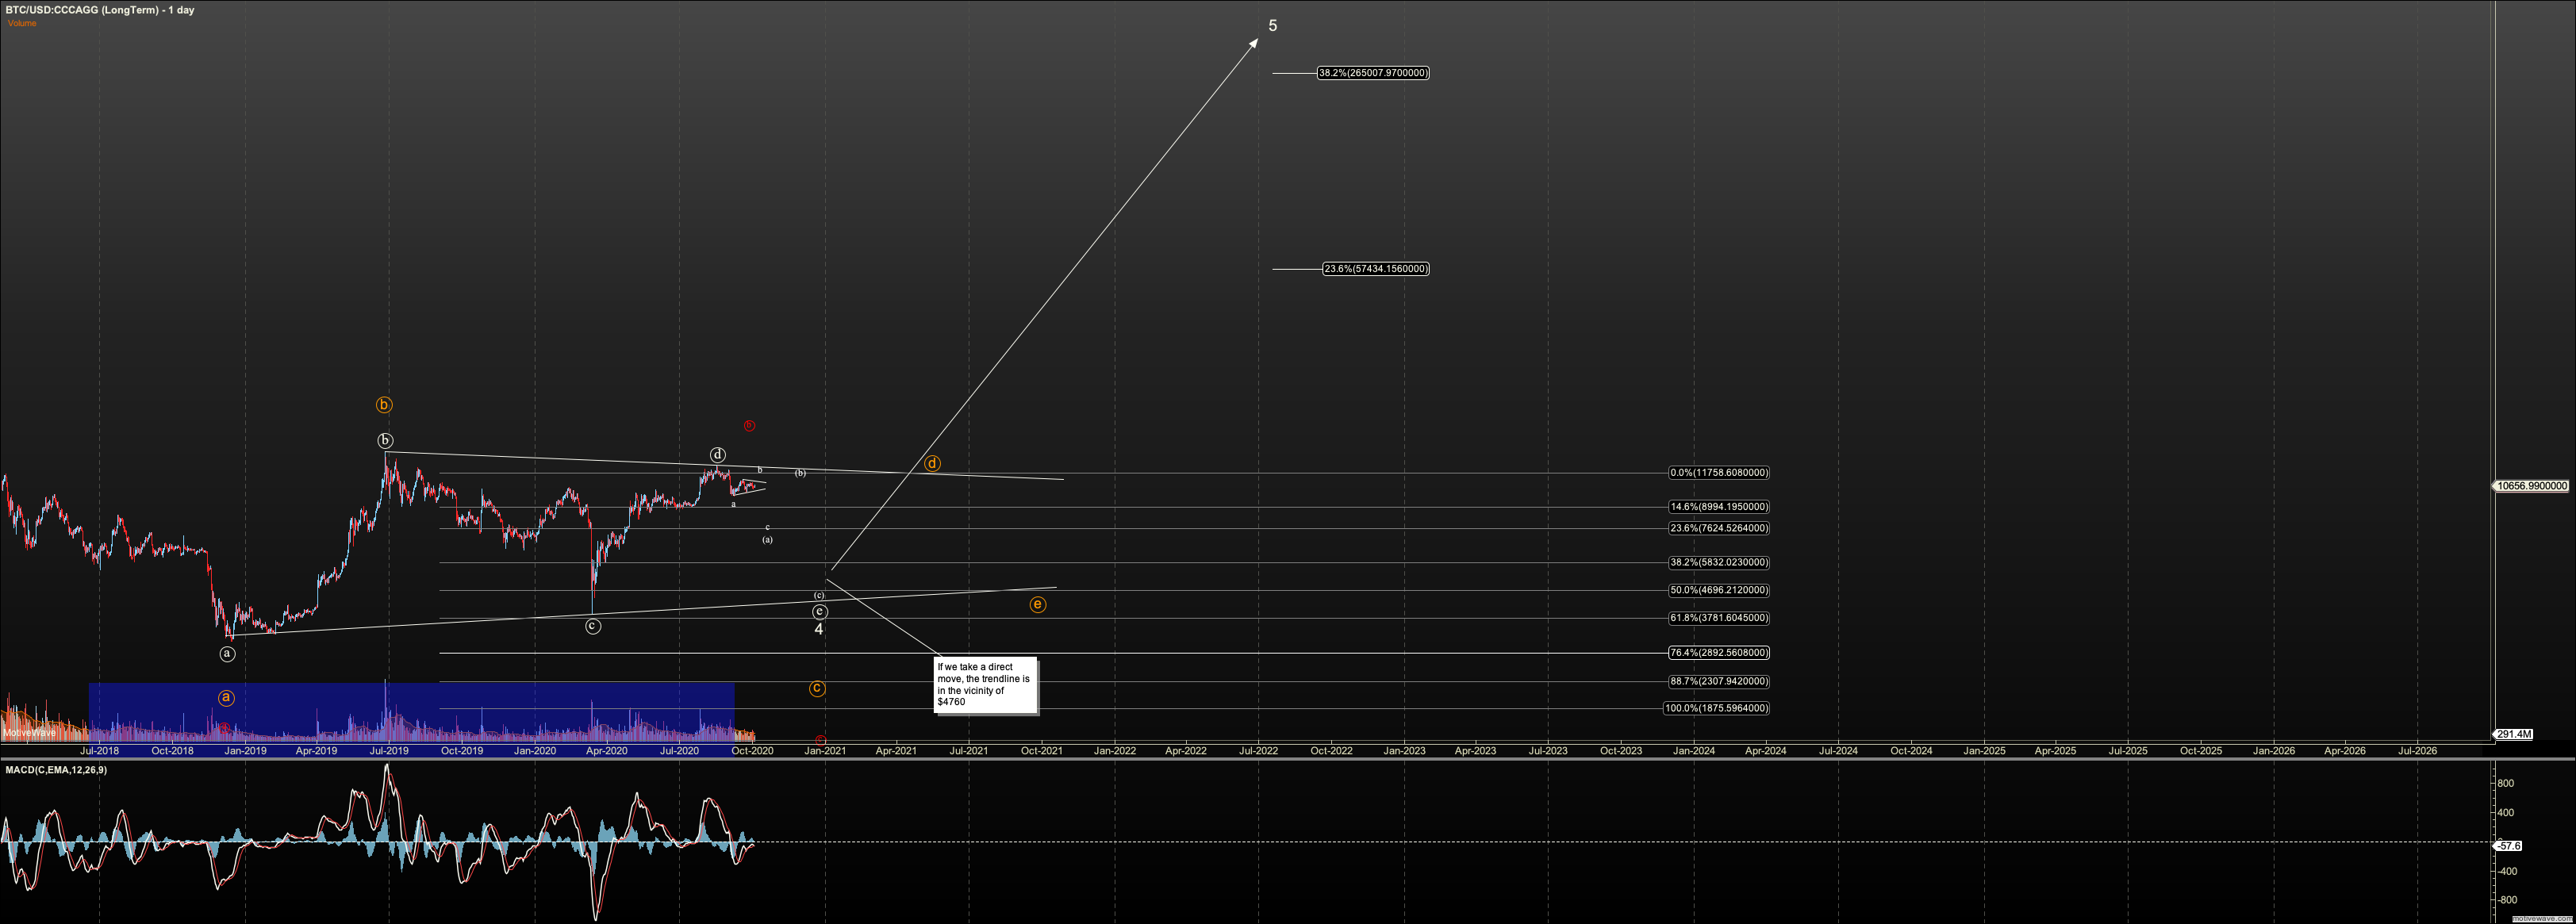
Since the March 2020 break down, my leaning has been that our large coins are unlikely to achieve escape from the bear market that started with the 2017 top in Bitcoin. And now I suggest we’ve seen the 2020 rally complete. However, even if we do breakout for one more high, action and internals in the coins suggest that a third wave into the $70K and beyond is unlikely. The big crypto bear market is intact after two years.
Where to now?
My preferred scenario is based on the ‘foreshortened rally’ in 2020, which could not break over the 2019 high suggesting we’re in a large triangle. If said high in late August holds, it suggests we have topped in a D wave and now are in an E wave in this triangle that began with the 2017 top. This triangle may be the fourth of the fifth of primary third, or primary fourth, depending on how long-term data is interpreted. Regardless, after this triangle completes, we can press beyond $100K, though I’ll be looking at the daily setup after the E wave bottoms to nail targets down.
The second runner up is a triangle where we have only topped in a complex B. This is shown in orange on the daily chart. This means we are only going to hit C in this pullback, potentially oscillating for 6 more months before our large scale breakout.
In ether triangle scenario a run to the mid $4K’s is expected here. Ideally we hold the lower trend line as shown. And, the triangle is not invalid until we break the March low at $3948 (global average).
Lastly, we have the brutal C wave to $2K, shown in red. In fact the exact dollar projection for this C wave now that we have a B wave top is $1989. That doesn’t make it any more likely, as the triangle structure is more typical of what we’ve seen out of 2019-2020 action. Nonetheless, I won’t be buying until there is an impulsive reversal, either at the mid $4K’s or $2K.
I have stated that regardless of whether we are in the C wave or the triangle options, we have a great opportunity to accumulate Bitcoin. If compared to its entire history, from a low price of $0.003 to its high over $19K, the current sideways action on the weekly charts is a massive bull flag suggesting that Bitcoin can eventually achieve levels over $300K.
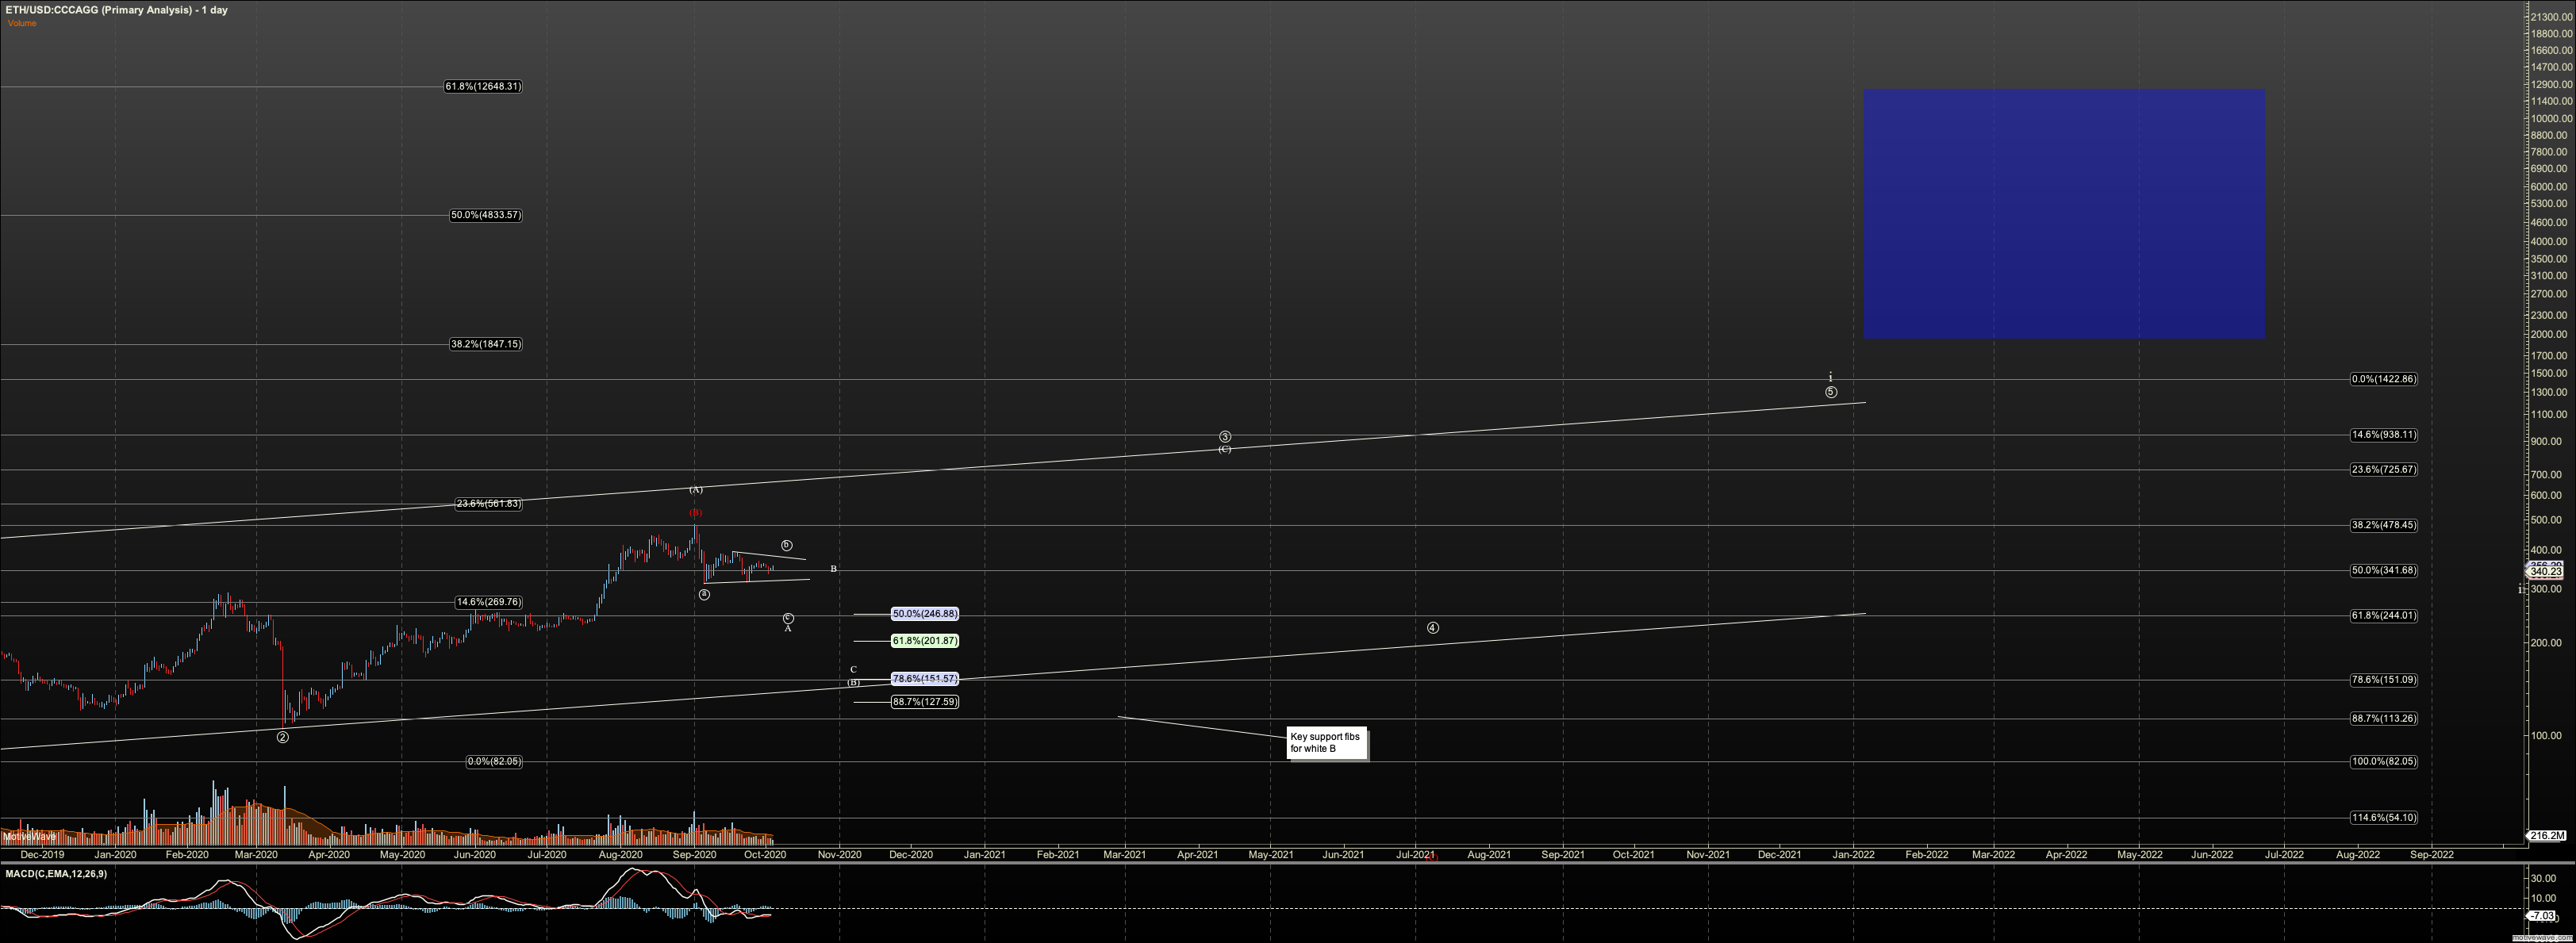
Ethereum Intermediate- to Long-Term View:
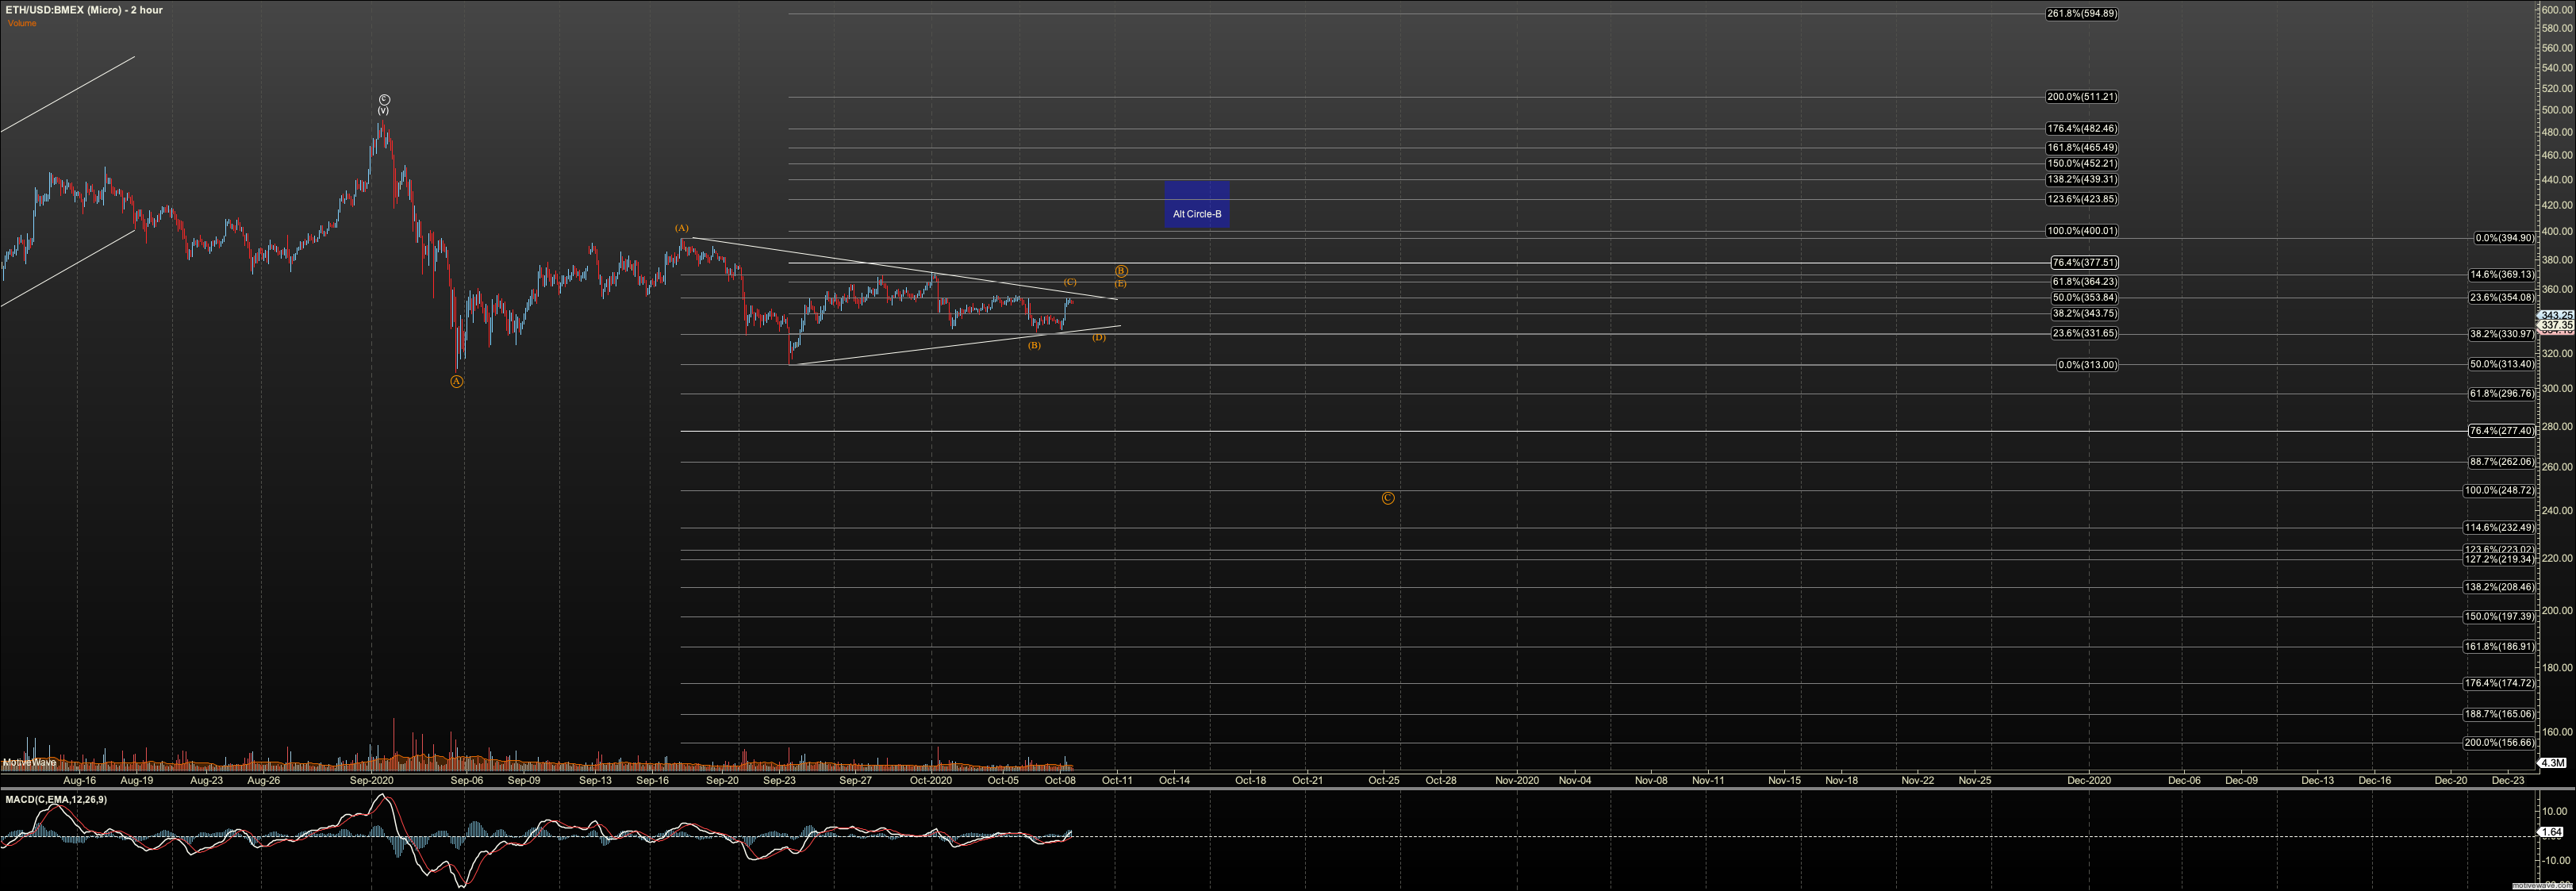
Between Bitcoin, and Ether, Ether gave the more pronounced warning after the March 2020 breakdown. Where Bitcoin has been able to rally within spitting distance of its 2017 high, Ether has remained below the .618 retrace of its 2018 peak to trough. That said, its 2020 rally was much stronger than Bitcoin, but so far the top leaves us with a three wave rally (aka B wave).
My working thesis has been that we’d see a C wave drop to finish off Ether’s primary wave 2 at $50. In fact, if we follow the current projection off the 2020 rally, we can easily see $26.
But a question comes to mind. If Bitcoin were to hold the triangle and avoid a move to $2K in red C, where does that leave Ether? In the backdrop we seem to have a large defi bubble building, potentially leading into a liquidity crisis. I am still reading in effort of coming to terms with the black box tech in this space. However, my surface-level knowledge suggests a liquidity crisis could cause Ether to outrun Bitcoin to the downside. This thesis is reasonable to me even if Bitcoin were to hold the triangle.
However, with the lack of a liquidity crisis, I must look for alternatives. Currently, I only see the attached leading diagonal rendered in white, which is the start of Ether’s primary third wave, There is much to desire with respect to this diagonal but more specifically the A top which we have just seen, is very high for such a structure. Nevertheless, this is the best alternative. This puts our support in this leg down at $147 and this scenario is invalid below $102, the March low. Below $102 we should expect to see $50-25.
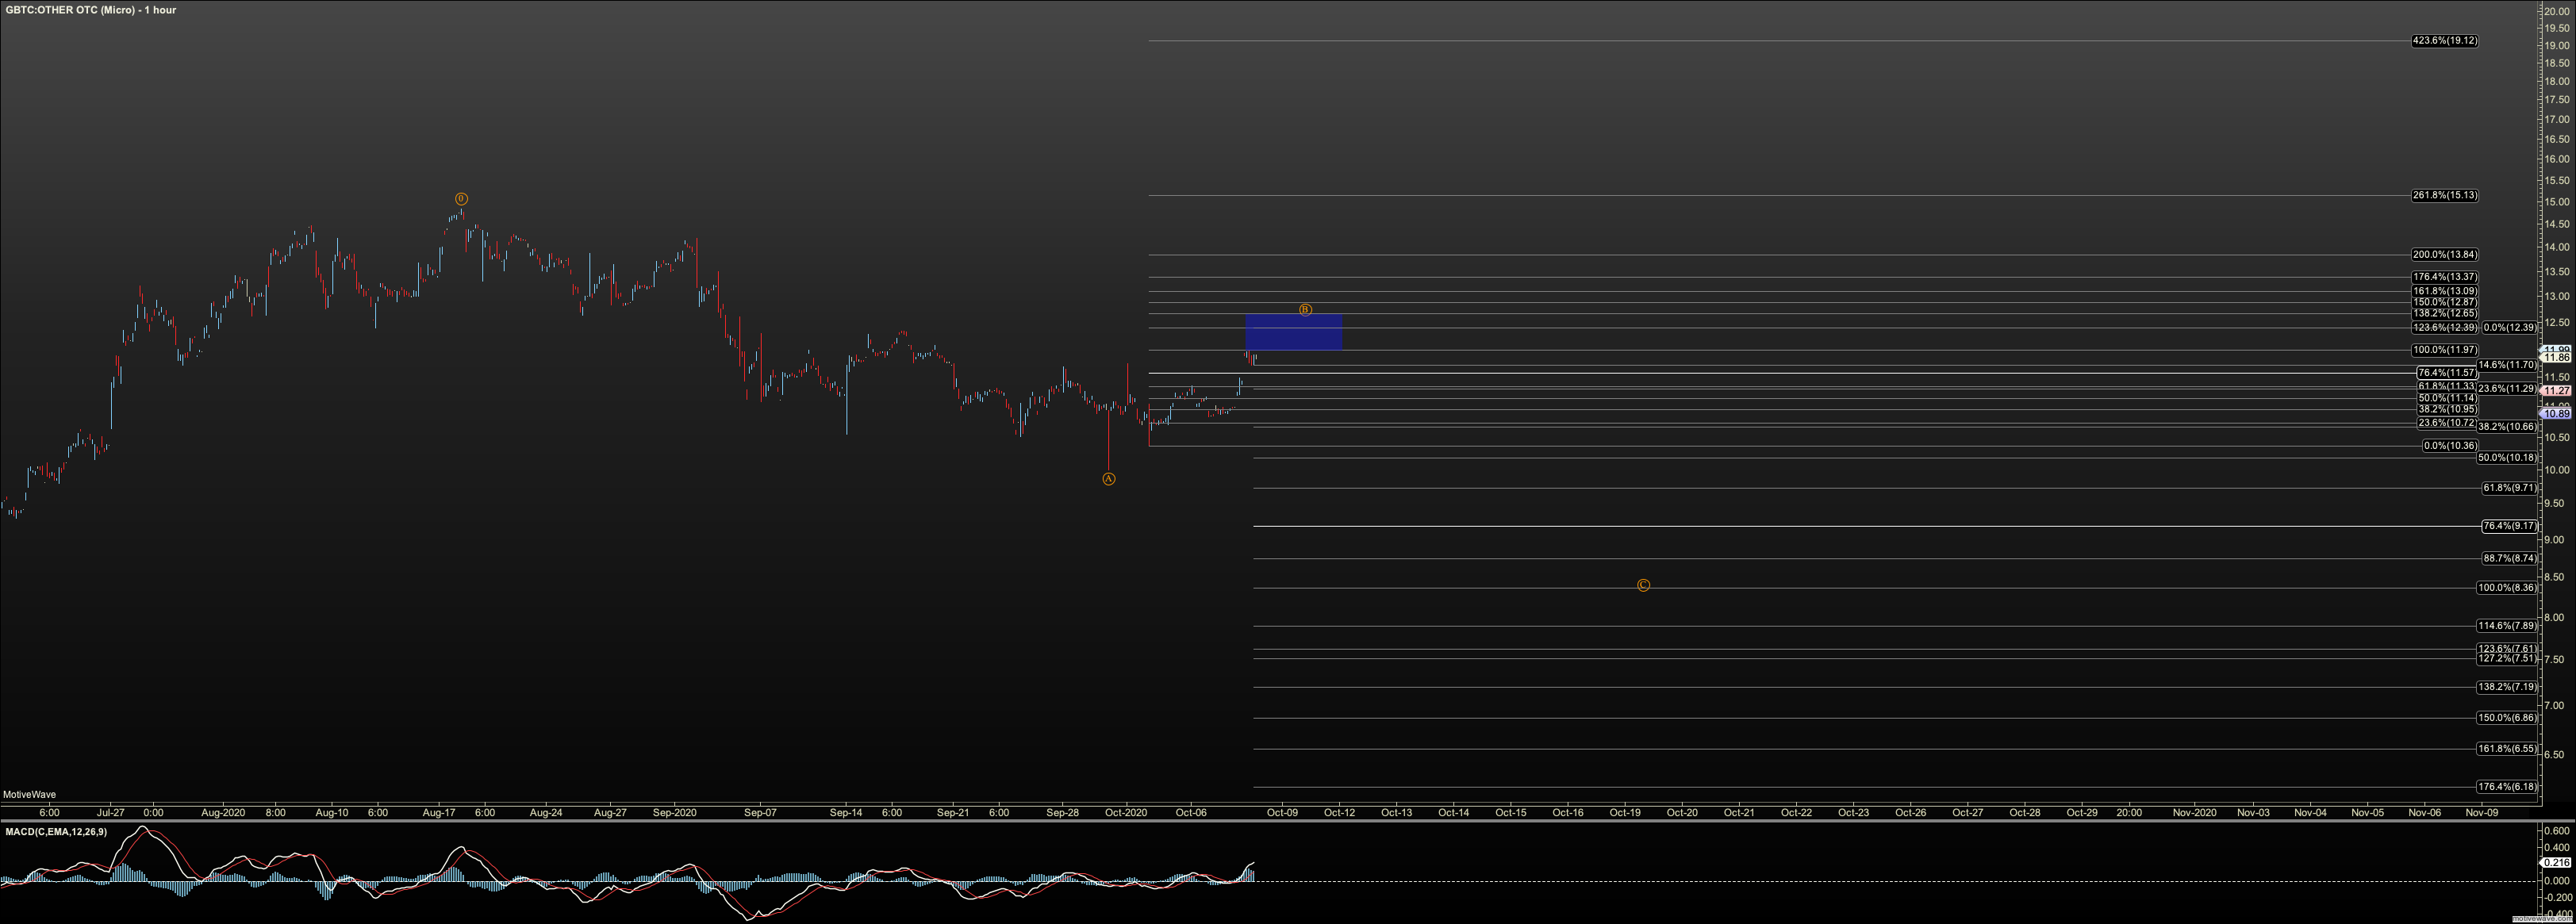
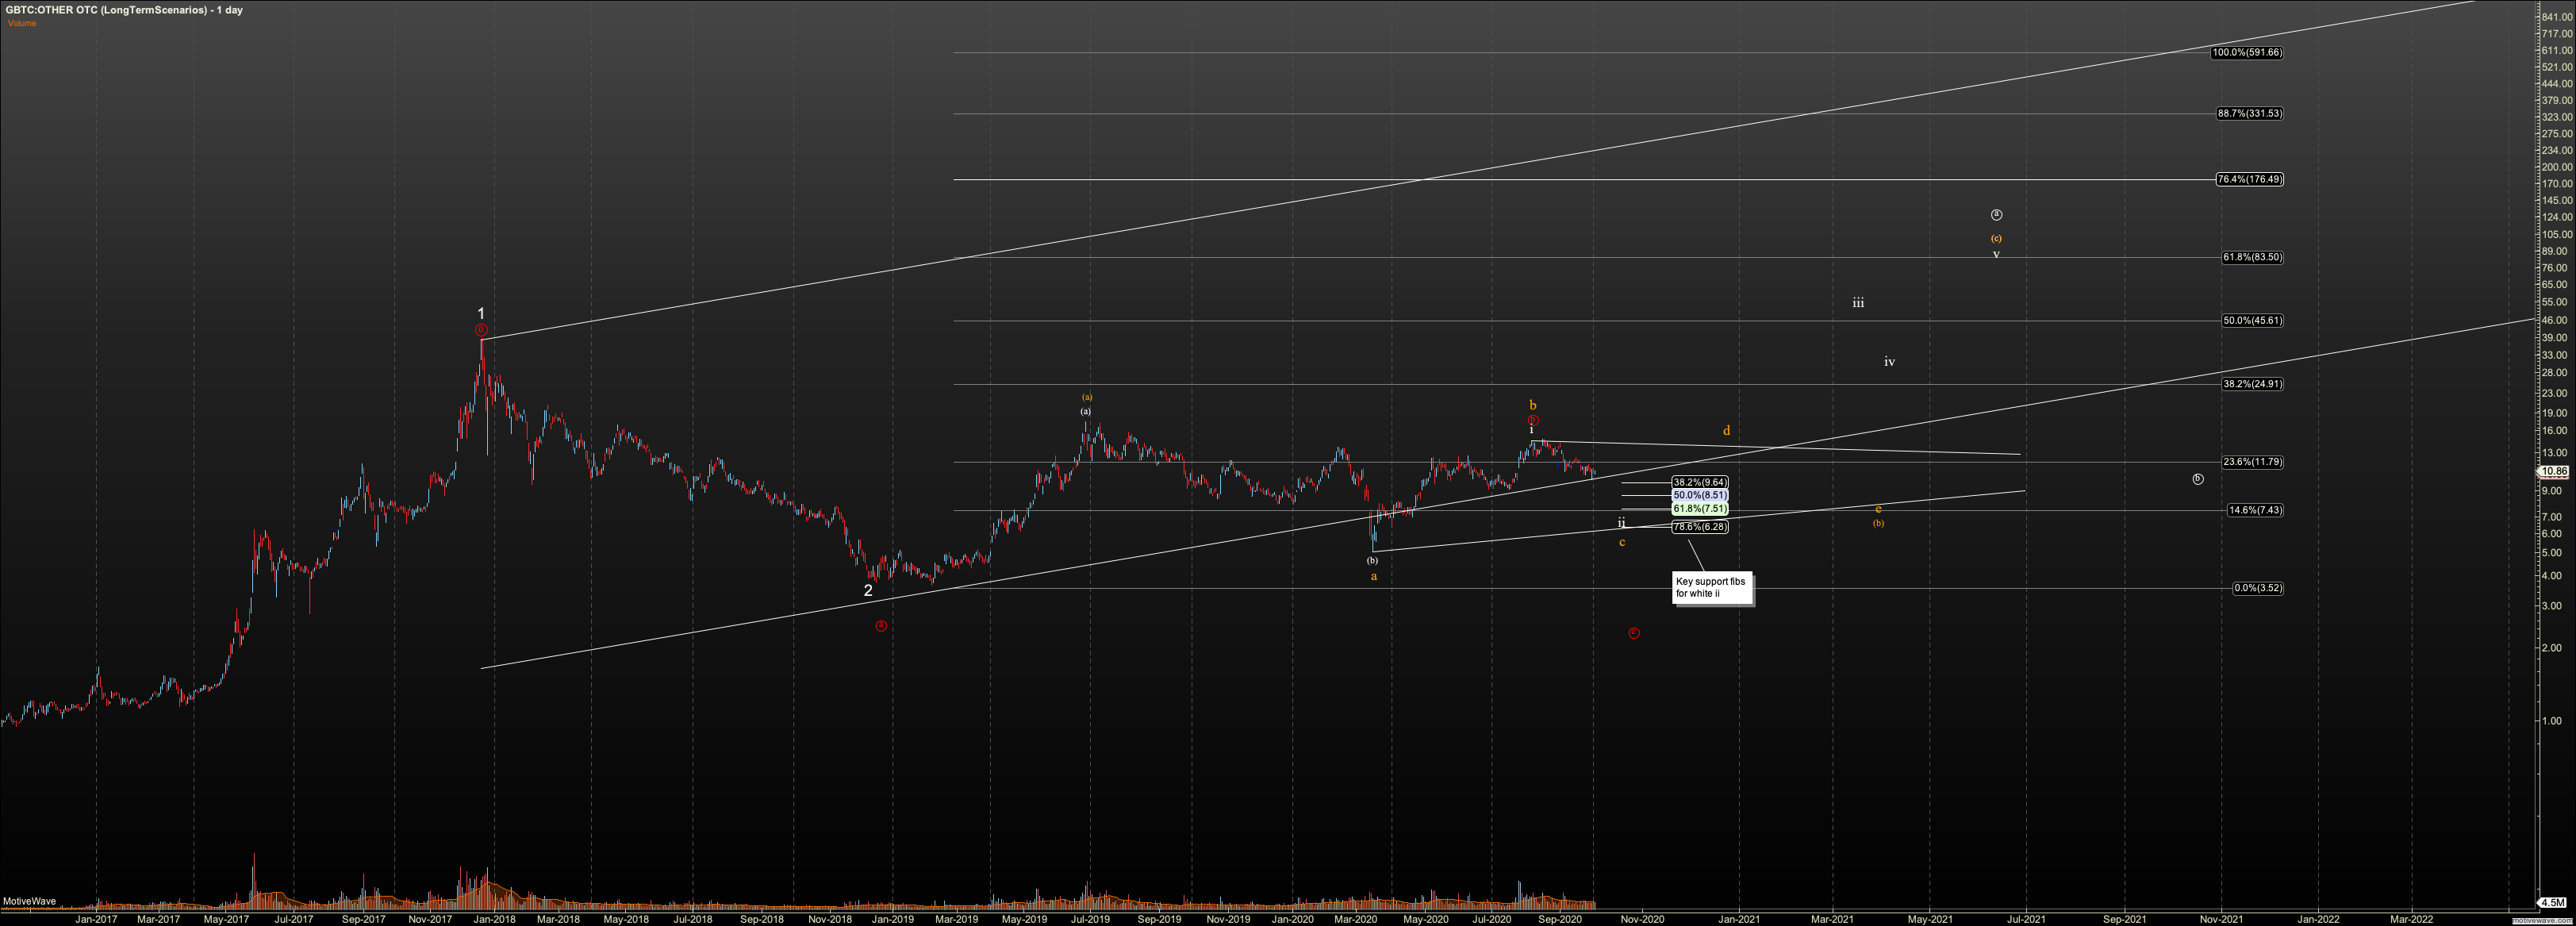
GBTC Intermediate- to Long-Term View:
GBTC has a much better defined 5 waves off the March low than Bitcoin. However it is similar in that we now have a confirmed top and one that failed to break the 2019 high. The scenarios I see here are an attempt to ‘force’ similar degree moves into GBTC’s count that I expect to see in BTC. What makes this difficult is that I’m filling in in places the shorter data history in GBTC doesn’t clarify.
If Bitcoin is now in the E wave of a triangle, the best scenario is that GBTC is in white wave ii. Support for this wave is $6.28 and ideally we hold $7.50 before starting a rally toward $80.
If BTC is in the elongated triangle which I now have in orange, then I have the orange triangle for GBTC. This would also prove that GBTC is in a large diagonal, something I’ve wondered for quite some time.
If instead we see BTC break through the March low confirming a target of $2000 then I expect GBTC to form the red C wave to $2. The actual projection based on 2019-2020 action is actually $4.20. However, that projection is tainted by GBTC’s RTH-only trading. If it was to see a ‘full move’ similar to BTC, I would expect wave 2.