1’s and 2’s
I knew Elliott Wave analysis was for me when all I had to do was be able to count up to 5. (smile) But, to be honest, one of the best set ups you can come across within the market is when the market provides you with a series of 1’s and 2’s. That tells you that we are setting up for a 3rd wave of some degree. While it is not a guarantee that a 3rd wave will certainly take hold, the great majority of the time we see follow through in a 3rd wave.
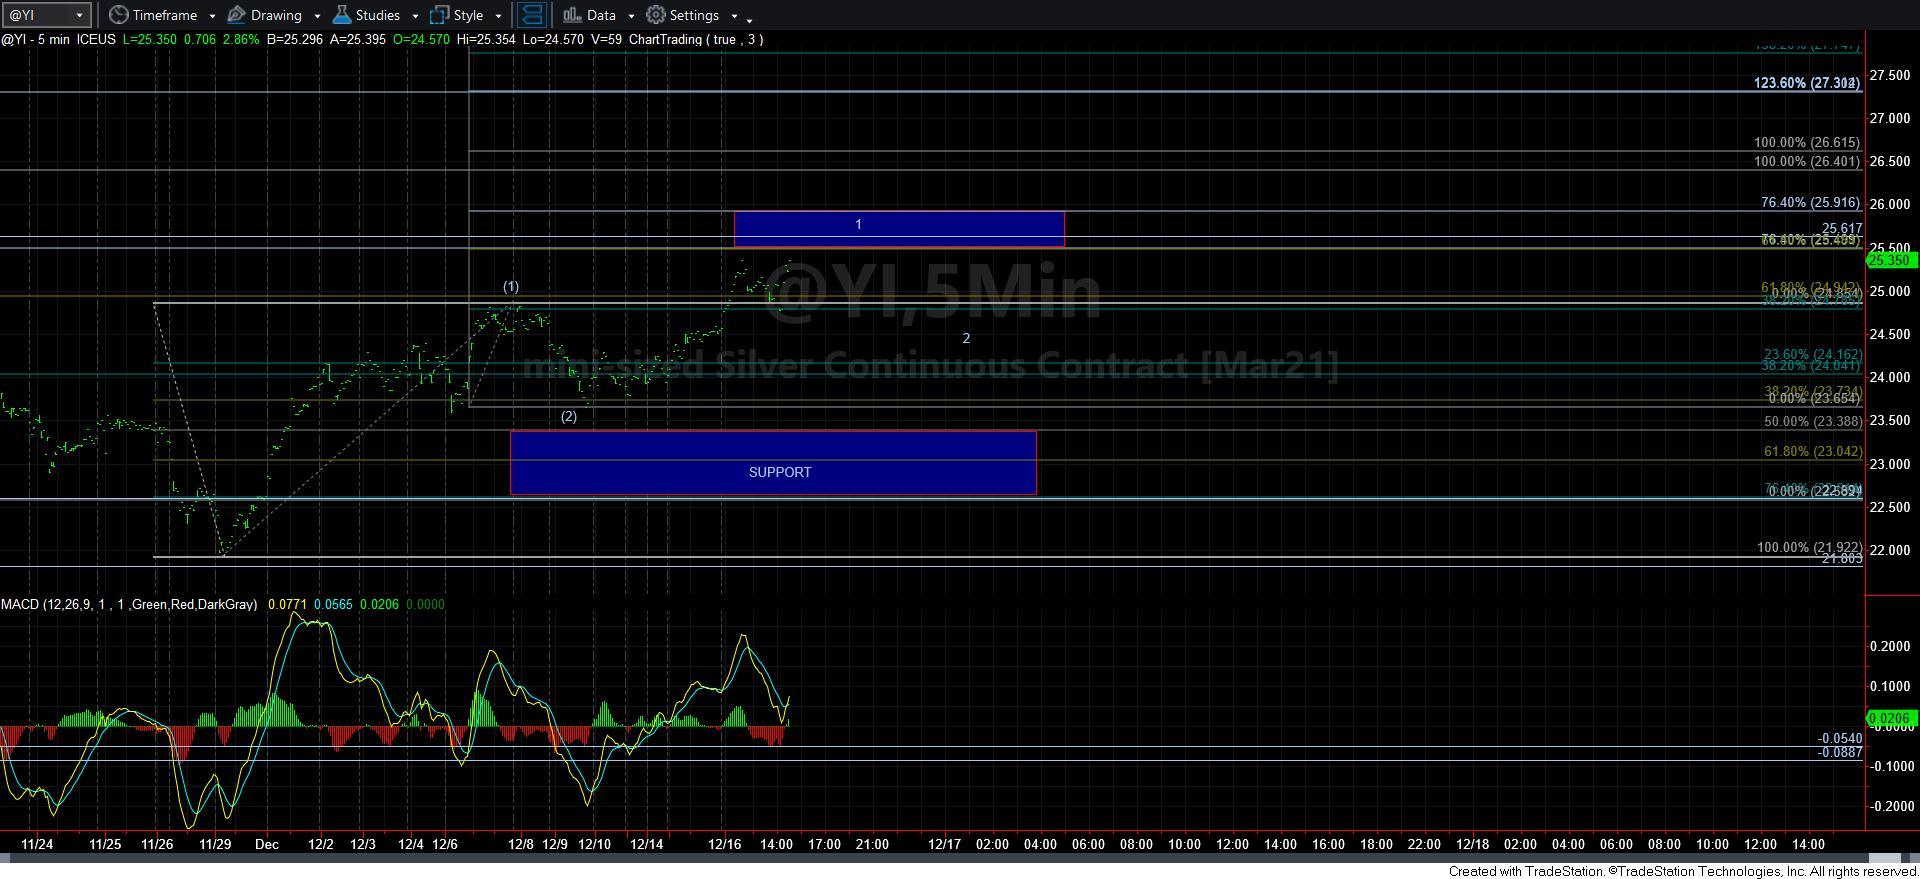
At this point in time, I can say that the silver and GDX charts are showing us indications of a set of micro 1’s and 2’s.
I have updated my 5-minute silver chart with a blue box pivot overhead, which is a common target for wave 1 of [3], as I am showing in the micro silver chart. As long as this box is respected, then we may see one more micro wave 2 pullback. But, should we break out through this box, then it becomes your micro support, and as long as all pullbacks hold over this box, then we are likely heading up in the heart of a 3rd wave.
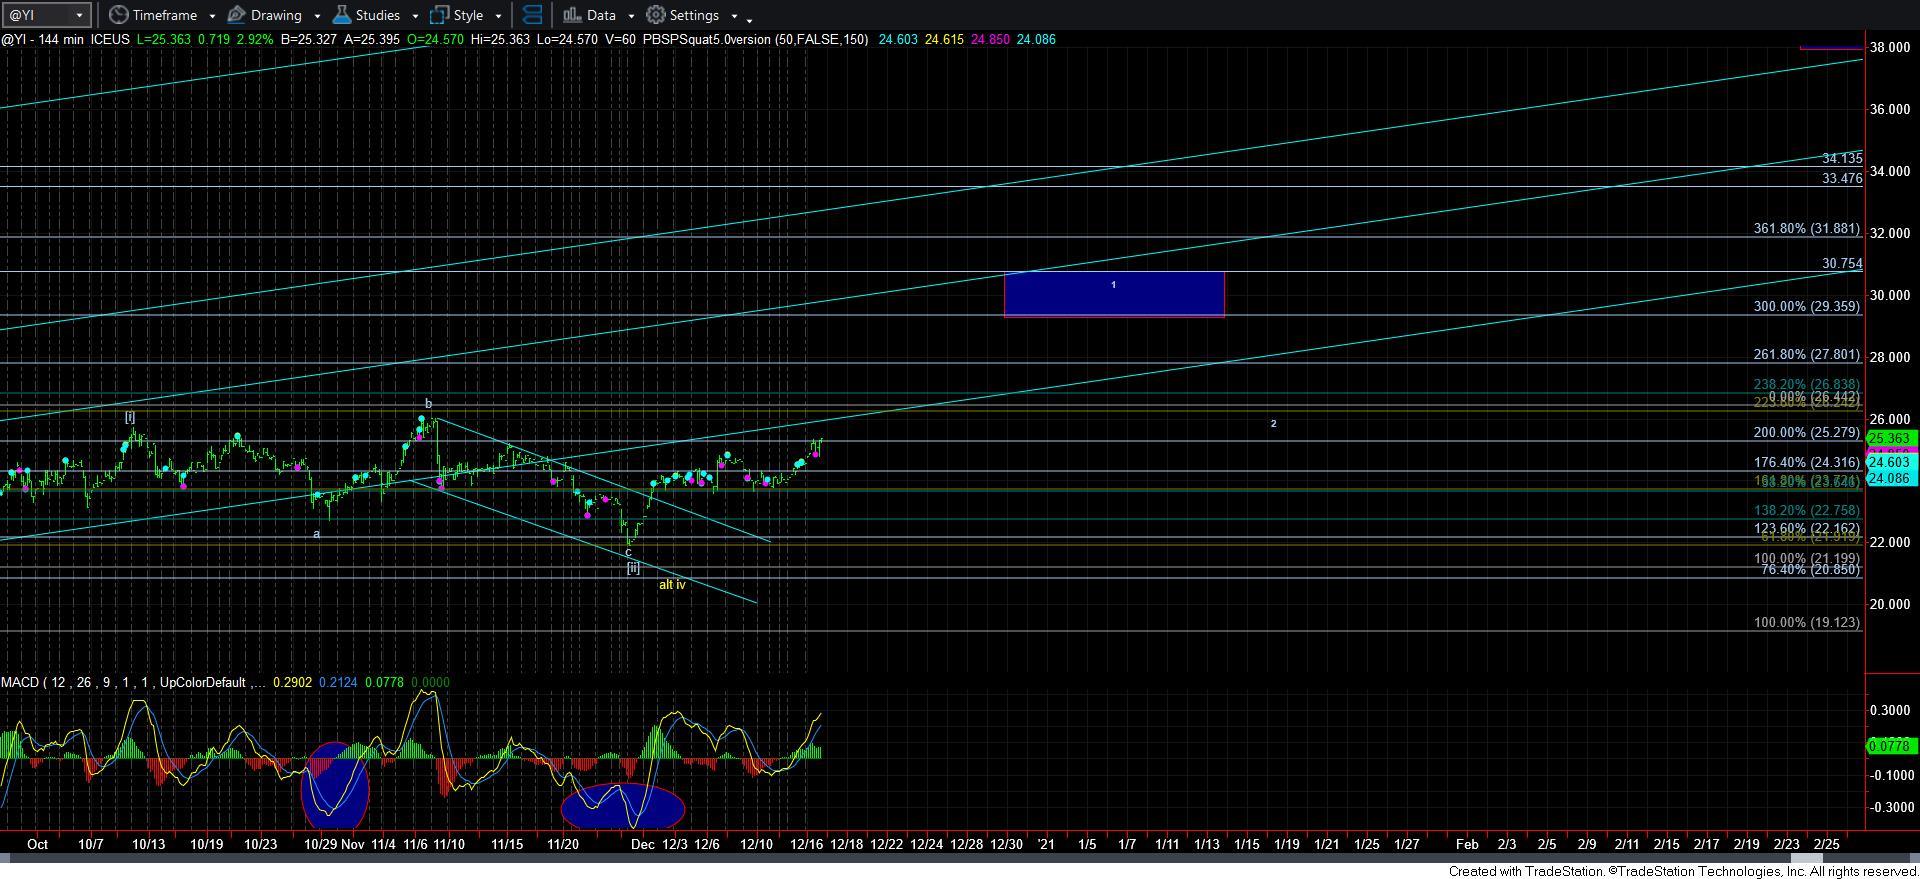
But, this is where you need to glance over at the 144-minute chart. This is only a 3rd wave in the bigger wave 1 of [iii] in silver. The target for this larger wave 1 is presented by the box on the 144-minute chart, which is in the 27.80-29.50 region. Moreover, if this larger 1-2 fills out over the coming weeks and months, then the target for wave [iii] would then become the 40-47 region, depending upon how waves 1 and 2 form. So, based upon follow through in the current micro structure, the rally off the March lows can be pointing us back to the all time high region in silver by the time this larger 5-wave structure completes off that March low.
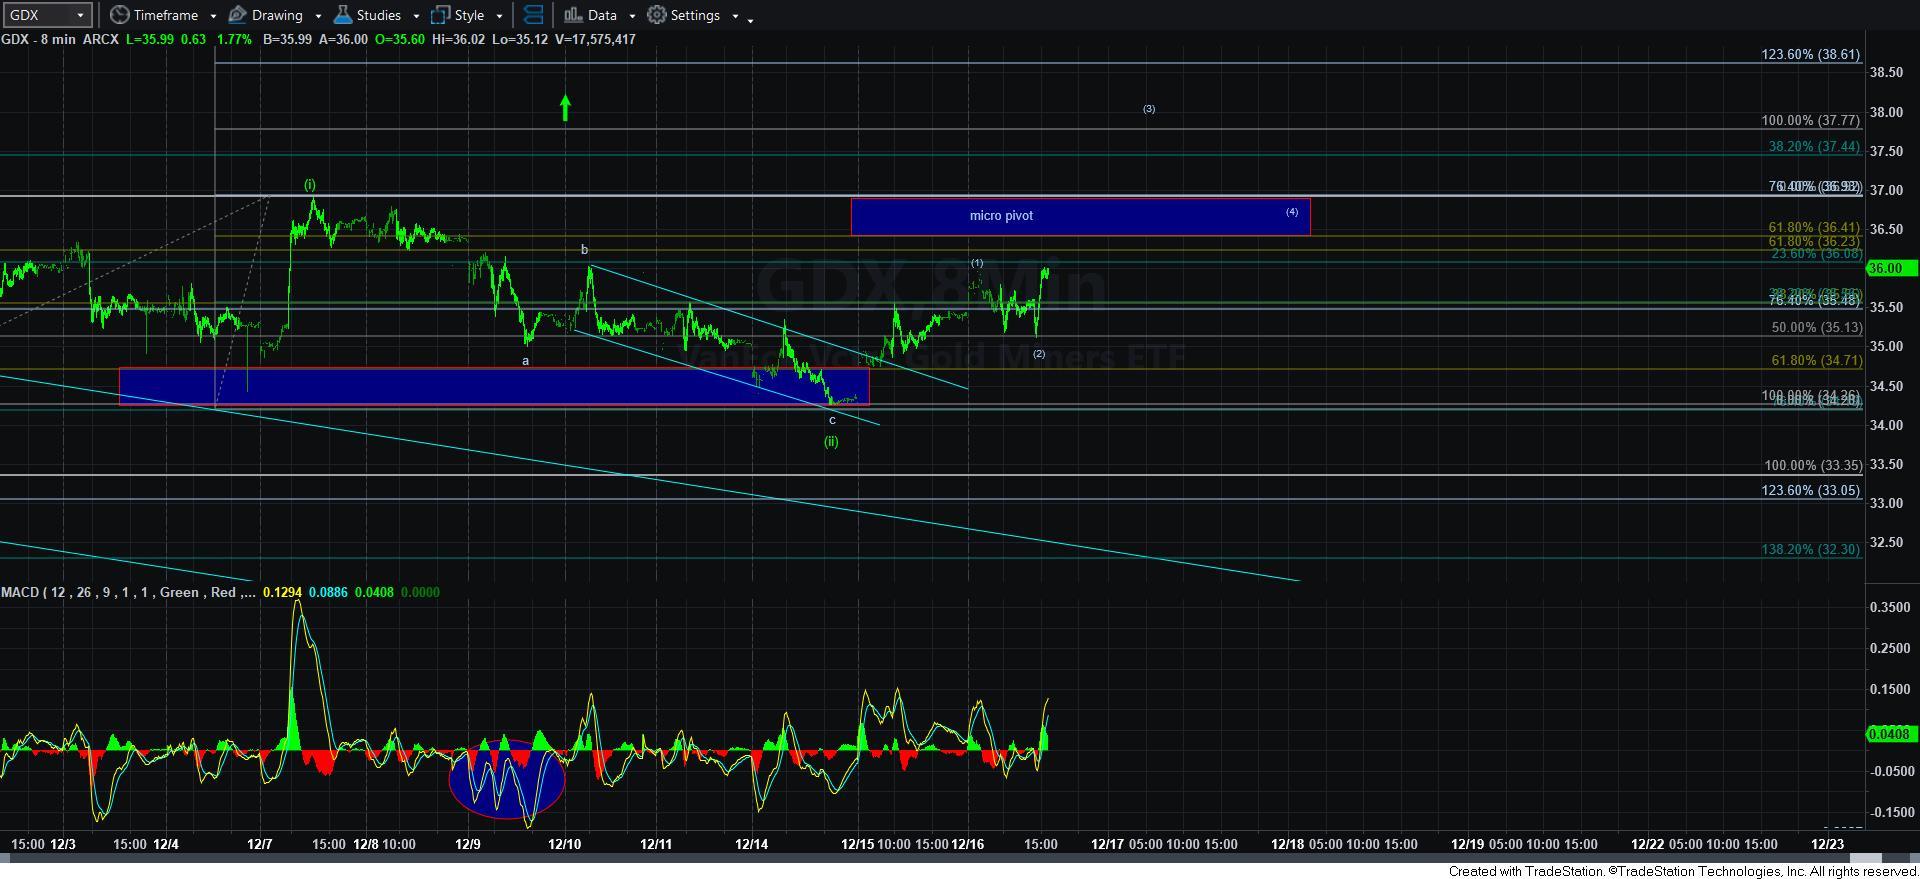
As far as the GDX is concerned, I am unsure as to whether this current rally is completing all of wave [1] of [iii], or if we are already in wave [3] of [iii] off the recent lows. So, as long as hold below the 36.50 level, then I can still view this as wave [1], with a wave [2] yet to pullback. But, should we break out over that level, and follow through over the pivot, then we are targeting the 37.75 region much more directly for the wave [3] of [iii].
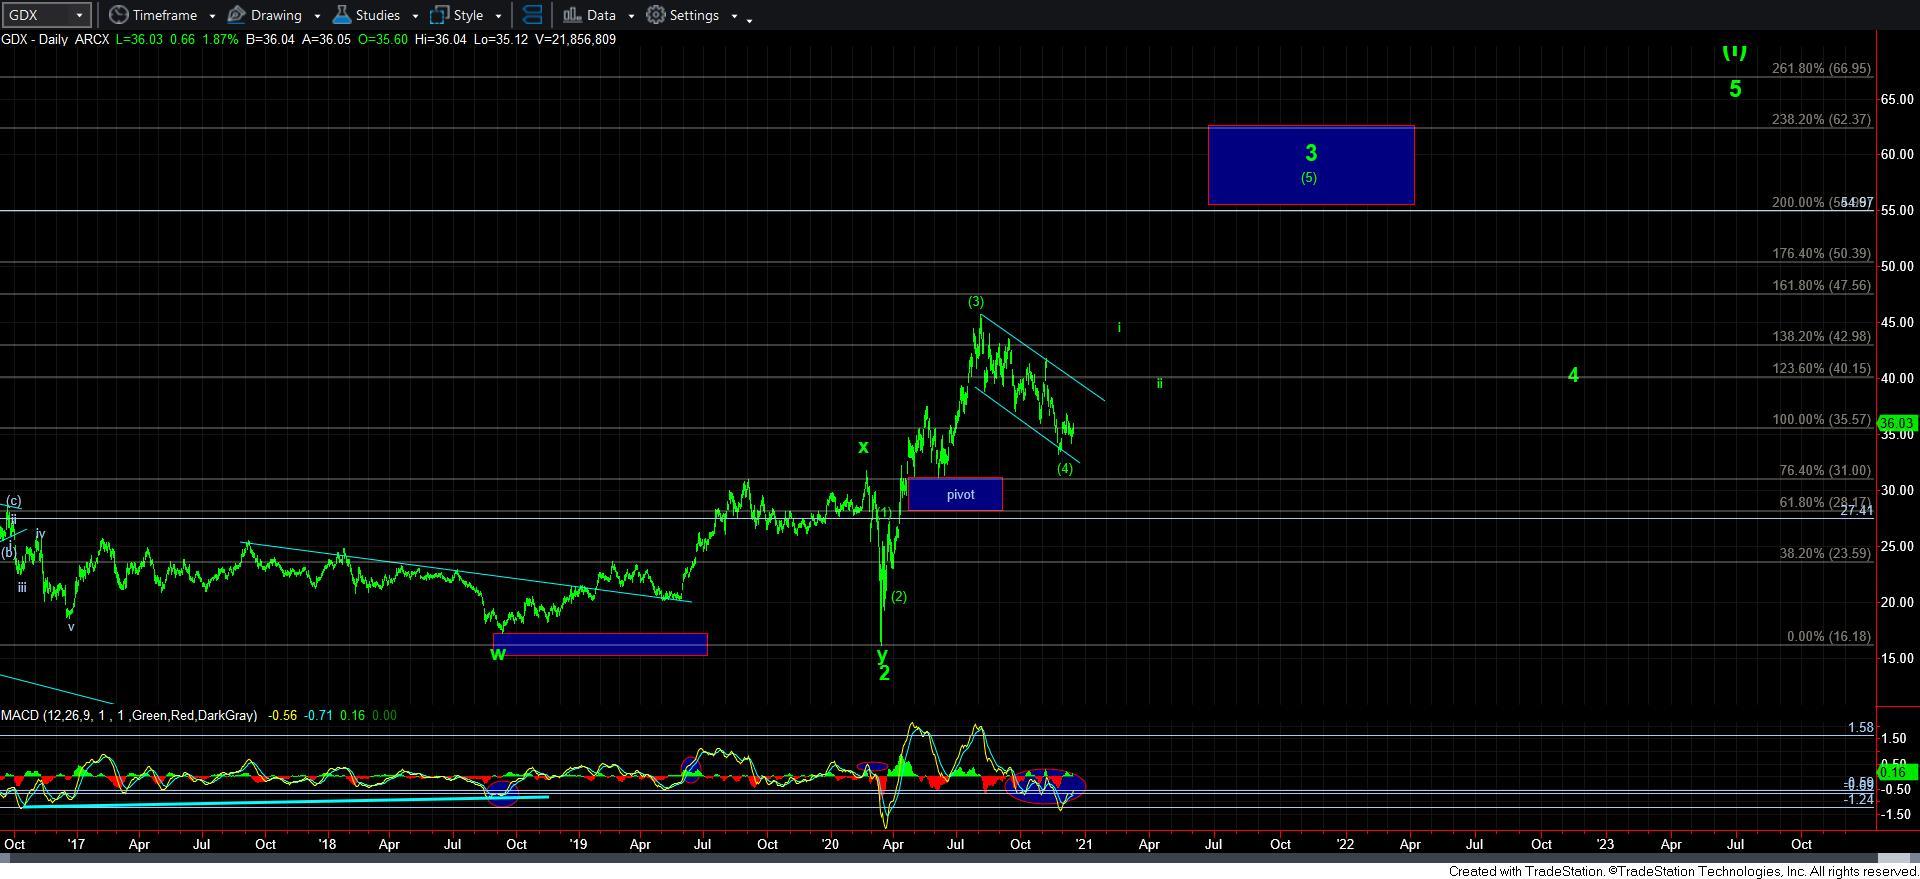
But, again, remember, this [i][ii][1][2] structure in GDX is only the initial set up within wave i of [5] of 3 on the daily chart. So, if this triggers through the pivot, then our pivot becomes support of utmost importance in order to keep pressure up to the 41-43 region as an ideal target for wave i of [5] of 3. So, we are getting very close to the confirmation point that the low is in, and a rally to 55+ has finally begun.
While the set up is currently developing, I am still going to remain cautiously optimistic until the market proves itself with a break out through the pivot, and then successfully tests the pivot from above as support.
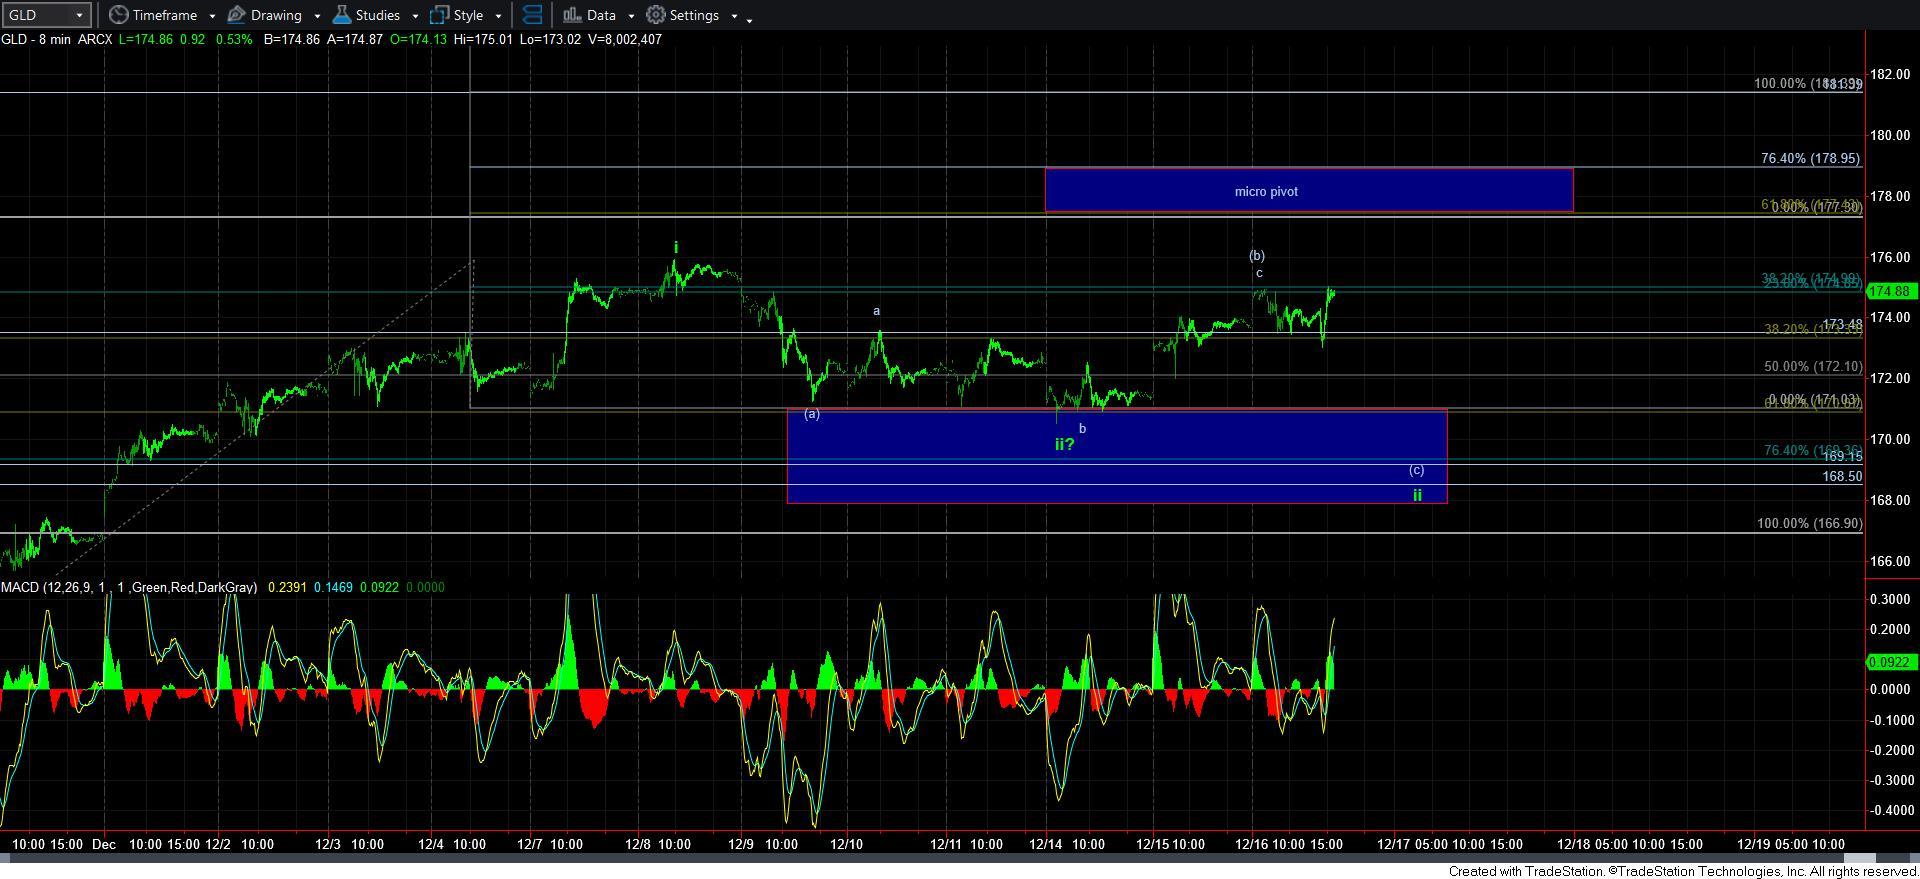
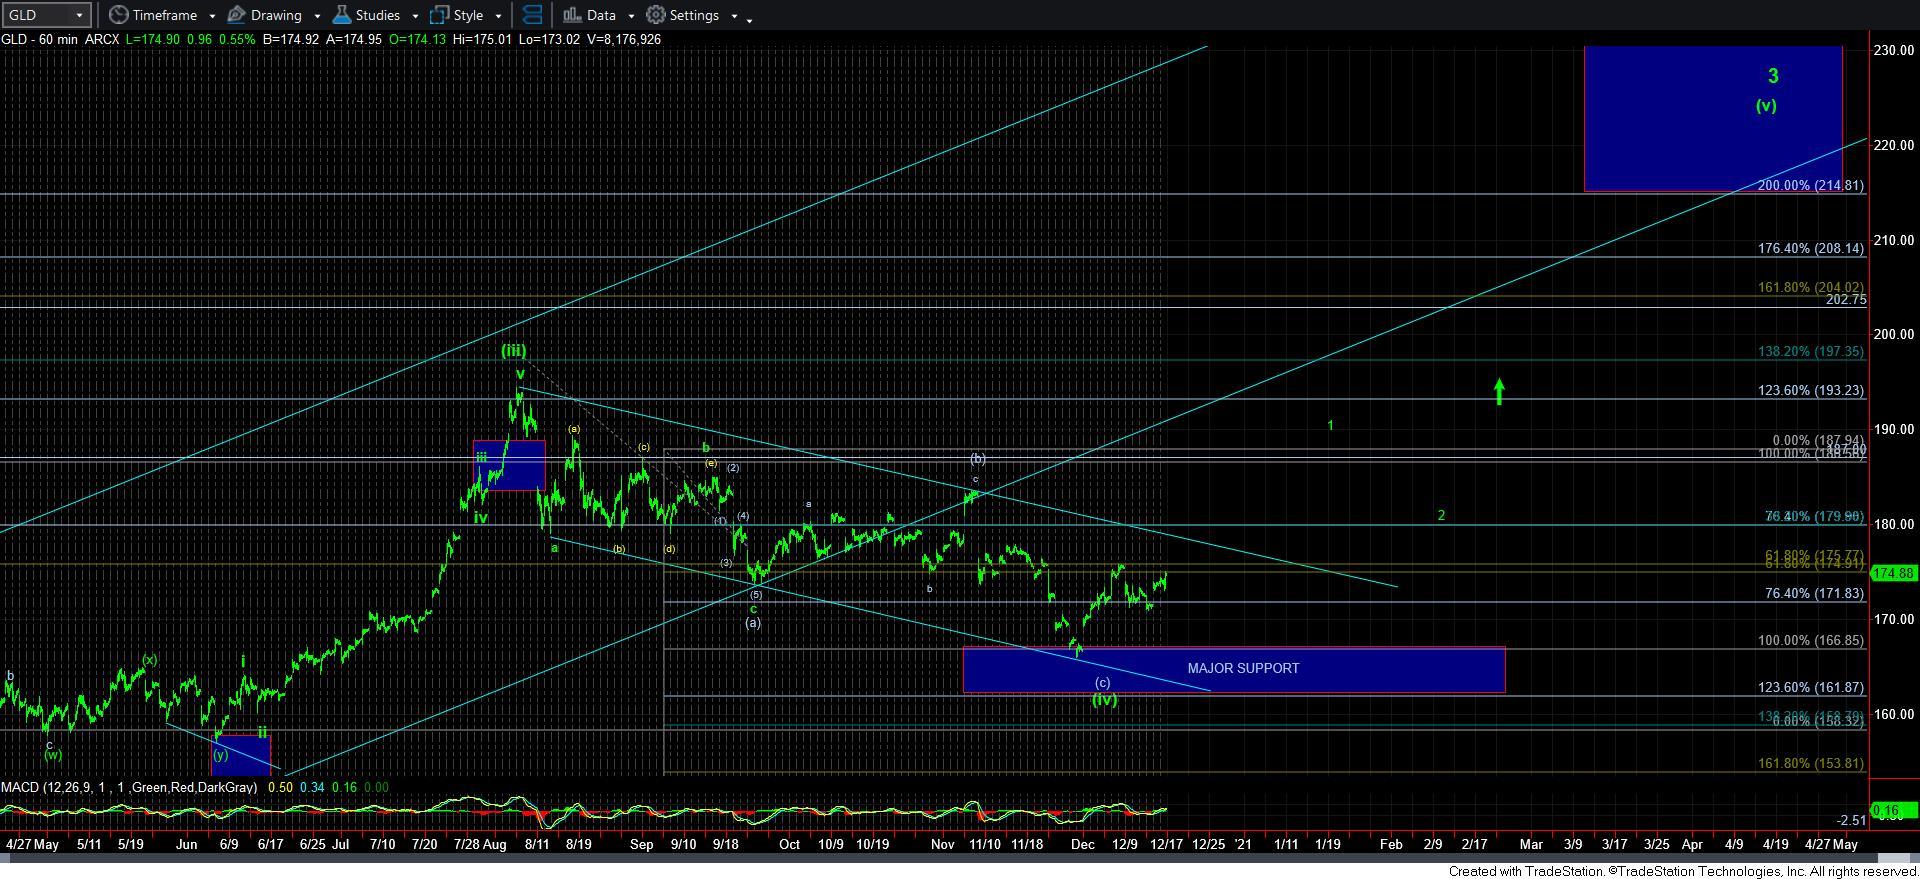
The one micro chart for which I can say I am not yet fully confident that the 2nd wave off the recent low has completed is in GLD. But, it has the same potential as GDX, wherein this could be completing a wave [1] off the 2nd wave lows, providing us with that i-ii, [1][2] off the low that silver and GDX seem to have. But, just as with the other charts, we have our pivot overhead which must be conquered and not given back to confirm that this correction has finally run its course, and we are finally heading up to create the wave 1 of the next larger rally into 2021.
So, as the market is providing us some micro clues that the bulls want to take the ball and drive down the field again, we still have one more test they have to pass before they are able to take it over the 50 yard line.