[c] It Is
With the break out in the overnight session, the market invalidated the immediate downside set up for a more protracted and deeper [b] wave within this larger degree b-wave we have been tracking. That now leaves us viewing the market as rallying in the [c] wave.
Yet, the structure we are seeing in this rally has left a lot to be desired. I have tried to take apart this rally structure in multiple ways, yet, I cannot find a higher reliable pattern which adheres to appropriate Fibonacci ratios within its internal structure. It has me leaning towards a consideration that this rally is subdividing as an ending diagonal. And, yes, that simply continues the complexity with which we have been dealing.
You see, most often, a c-wave is a standard 5-wave structure which adheres to Fibonacci Pinball standards. Yet, I simply cannot find that structure in this current rally. This leads me to consider that we are tracing out an ending diagonal.
While I can probably write another page or two within this update to discuss how this can subdivide, I think we have dealt with enough micro-difficulties to last us for months. So, I am going to try to distill our current situation in the simplest way I can, using supports and resistances as our guide.
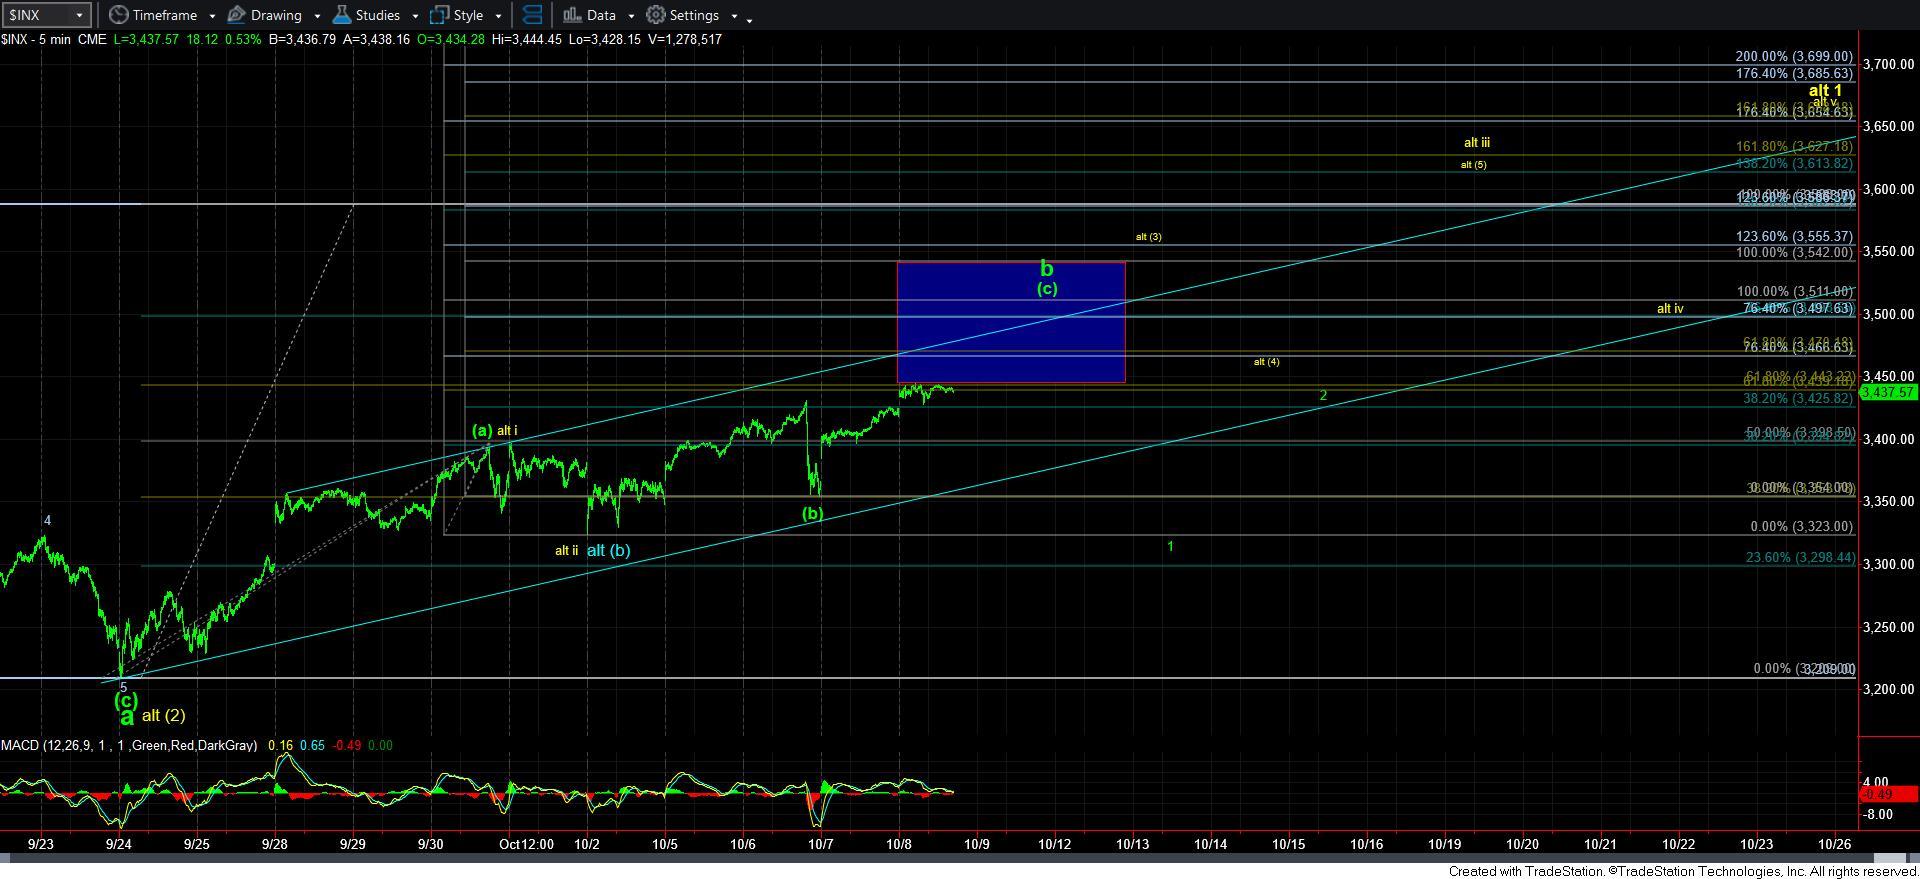
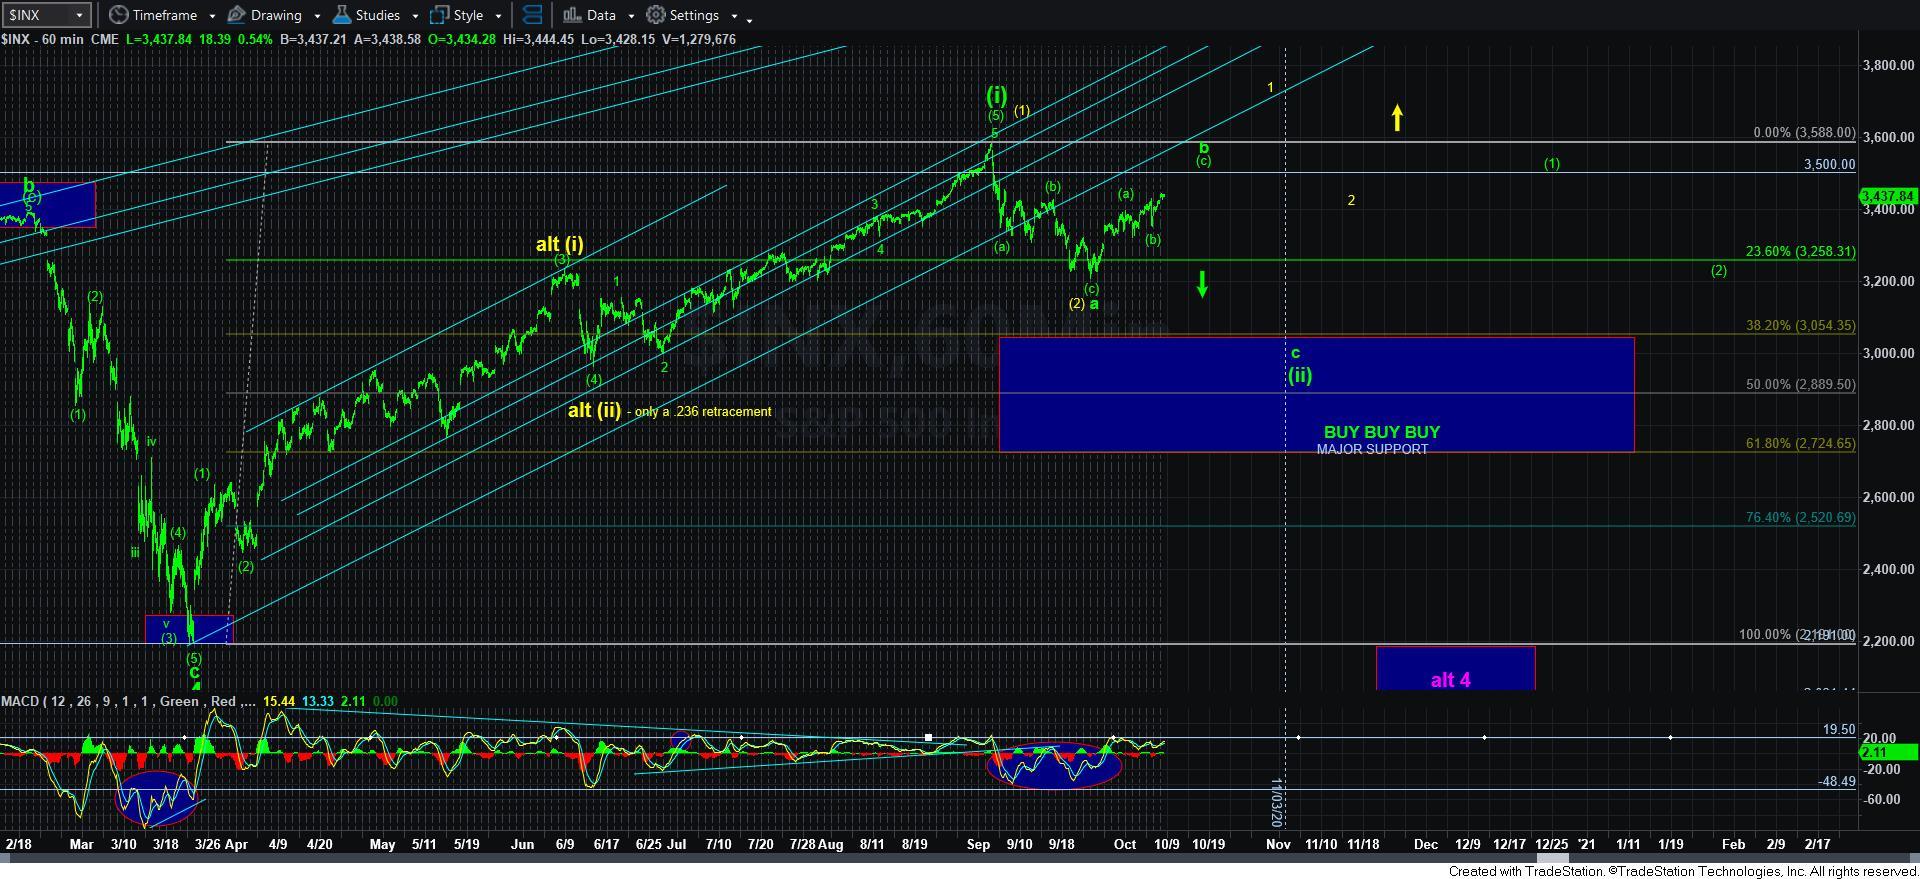
Currently, our main support level is the 3354SPX level, which is the low we struck the other day. A break down below that level, with follow through below 3323SPX would suggest we are in wave 1 of the c-wave down within the larger green wave [ii] count.
With regard to resistance points, today we struck the .618 retracement of the a-wave decline. While this is a common target for a corrective rally, I really do not have a clearly completed structure to consider this rally as completed. Moreover, much of the confluence in the calculations I have been running points more towards the 3500SPX region as the most likely target for this rally.
So, unless I see the market begin an impulsive decline projecting below 3354SPX, I am going to maintain the 3500SPX region as the ideal target for the [c] wave, which would complete the b-wave.
The maximum resistance for which I can allow this b-wave to travel is the 3542SPX level. Should we be able to rally through that level, then I will have to begin to shift probabilities towards the yellow count. For now, that is not my expectation.
In summary, our floor is now the 3323-3354SPX region, with our main overhead resistance between 3500-3542. At this time, since we have struck the minimum target we would expect for a corrective rally at the .618 retracement of the a-wave decline, I will be on the lookout for a 5-wave decline which will provide us with an initial indication that the c-wave of wave [ii] has potentially begun. Until such time, I think we could continue to see a combination of grinding and whipsaw until we reach the 3500SPX resistance region.
Lastly, while I still have the yellow count on the chart, I cannot consider it as a reasonable probability until we exceed the 3542SPX level.