b-Wave Likely Done
With the break down below Thursday’s low, I think the probabilities have now swung to the potential that the b-wave has completed.
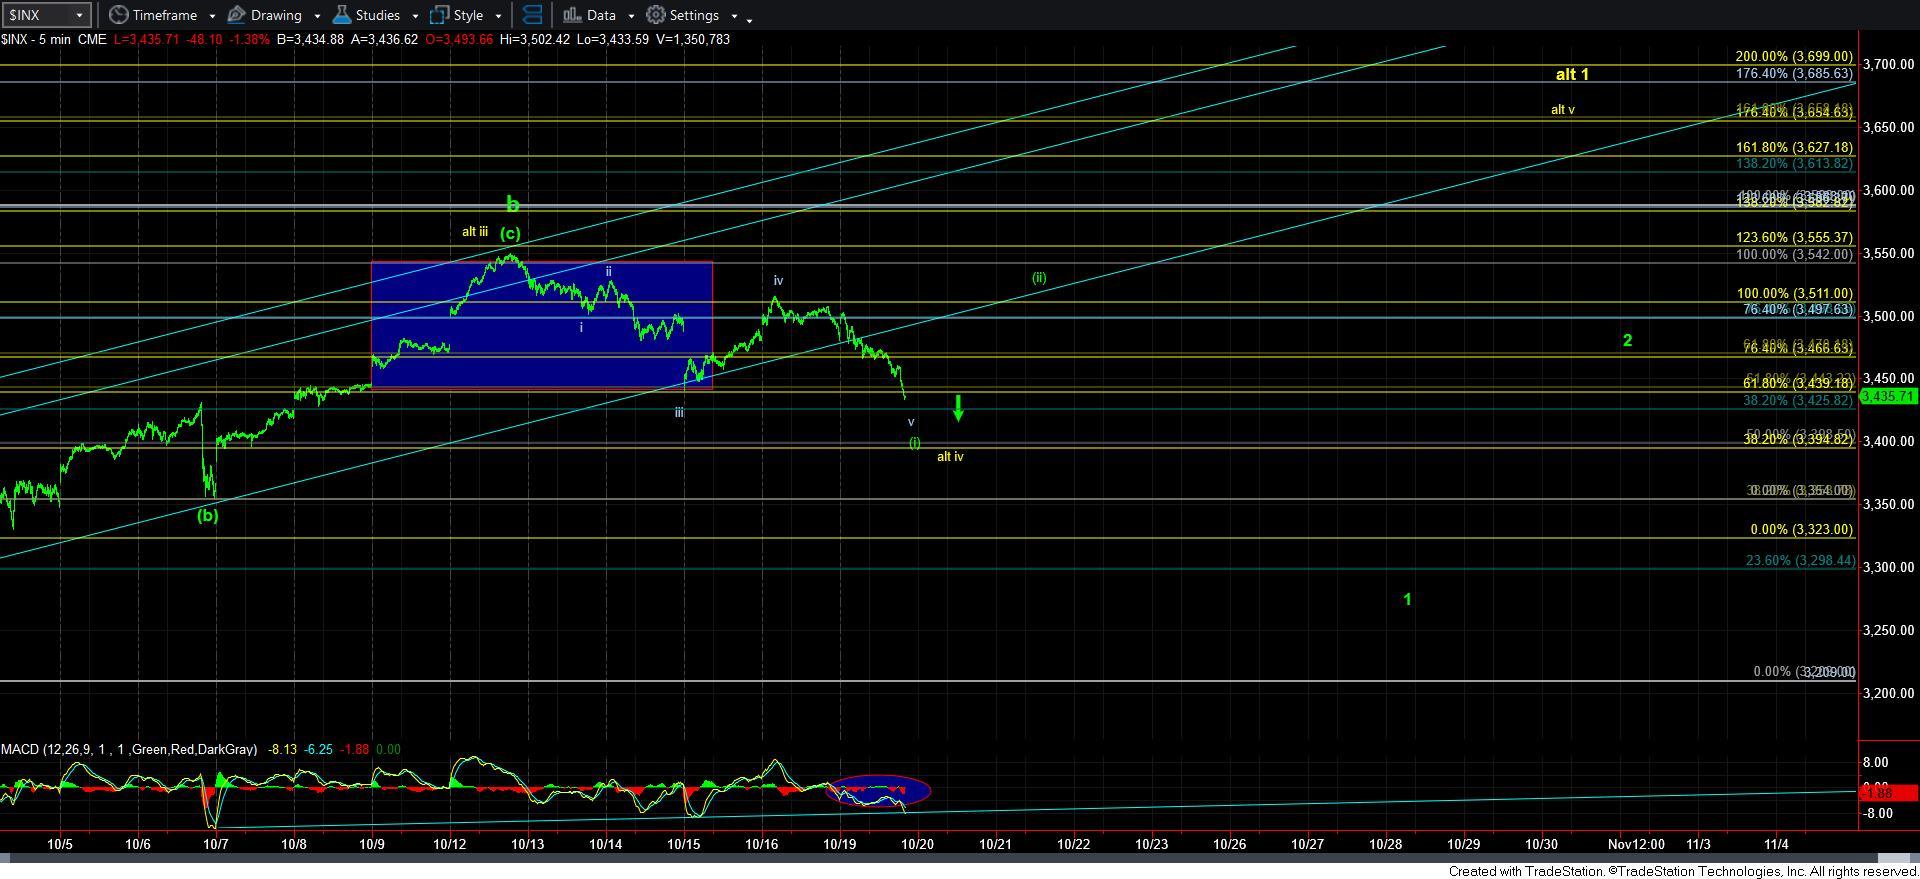
I want start this update by noting that the drop off last week’s high is not really a clear impulsive structure. And, c-waves are normally standard impulsive structures. So, I am potentially viewing the initial decline off last week’s high as a leading diagonal, with today dropping us in the wave [v] of wave i of a larger degree wave 1 off the b-wave high.
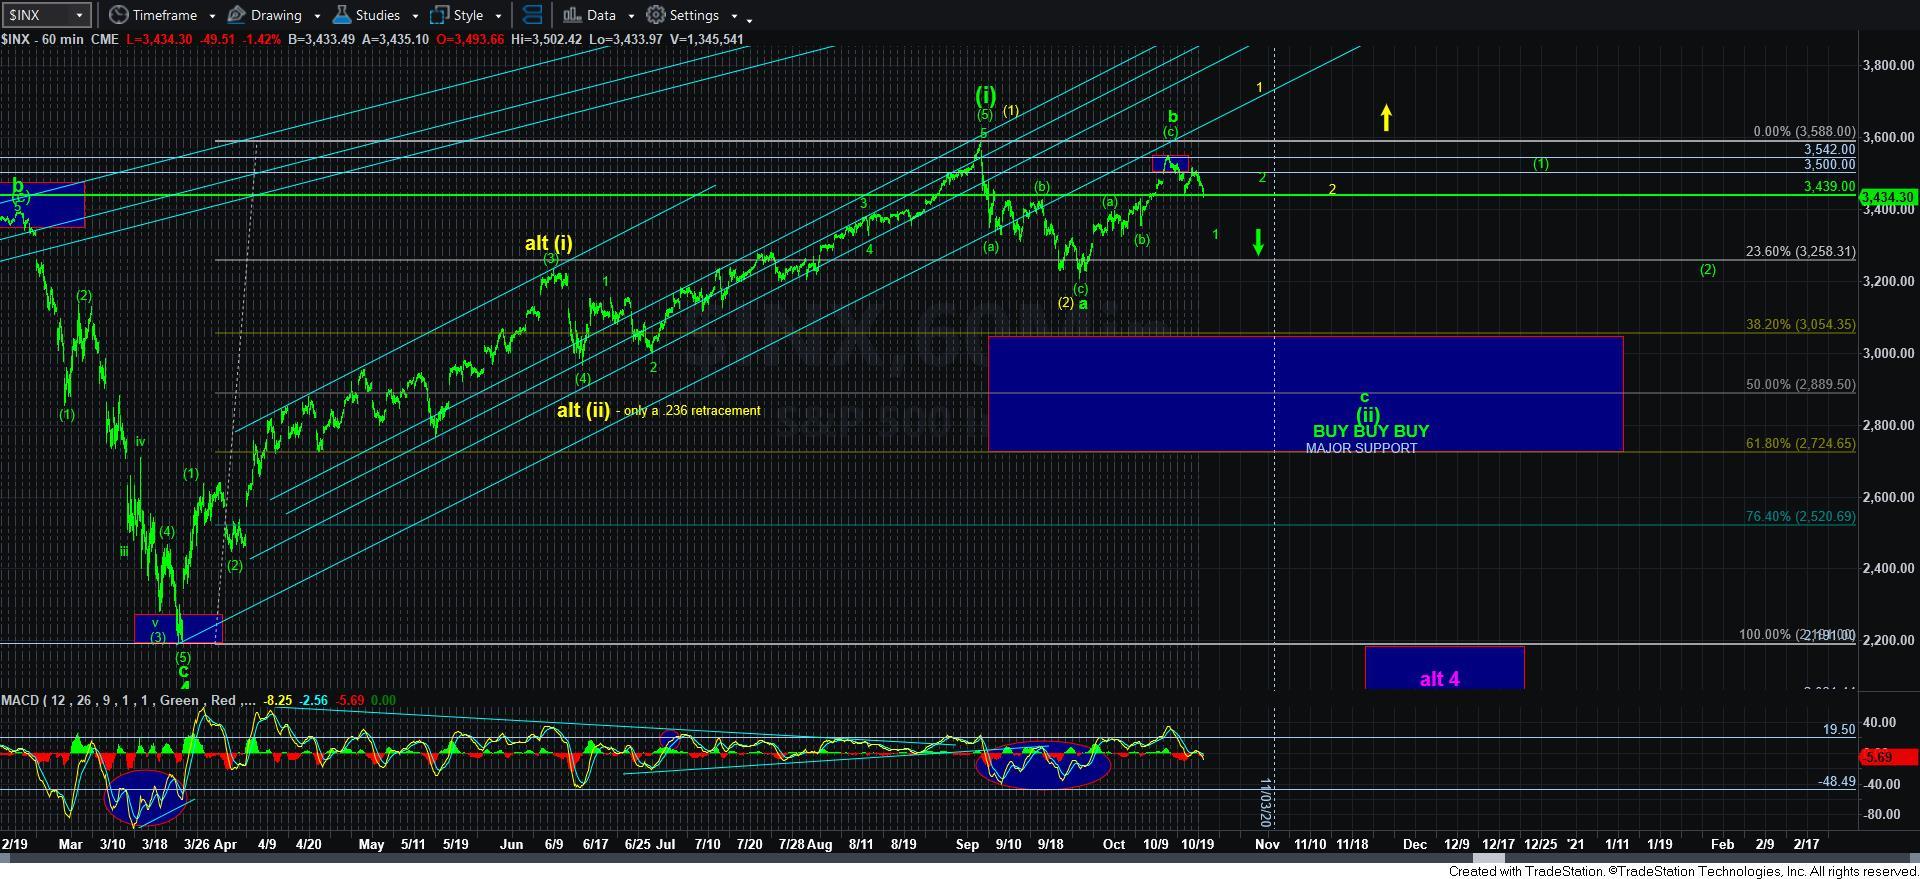
Now, I cannot say that I have a high level of confidence in this micro count, but if we see a corrective bounce over the coming days, then this will be the most likely structure in my opinion. Ideally, the larger degree wave 1 should take us down to the 3300SPX region to set up a decline to at least the 3050SPX region, but more likely down towards the 2900SPX region.
Clearly, I would have preferred a clear 5-wave decline structure to make this potential an even higher probability, but the fact that we have broken down below the .618 extension has begun to swing the probabilities towards the b-wave as having completed at this time. I am going to give the market a few days to clarify the micro structure, but I believe we have begun the drop in the c-wave of wave [ii].
I will leave the “alternative” in yellow on the chart, and it would now count as a diagonal, as we have hit the 1.236 extension (traditional target for the 3rd wave in a diagonal), which means we are pullback back in wave iv in yellow in that diagonal. But, as you know, I do not give a lot of credence to diagonals until proven.
So, in summary, I think the market has increased the probabilities for the c-wave of wave [ii] in green today, and it would have to break out over last week’s high to convince me otherwise. But, there is no doubt that I still have some question in my mind due to the overlapping structure off the recent high.