b-Wave Continues To Grind Higher
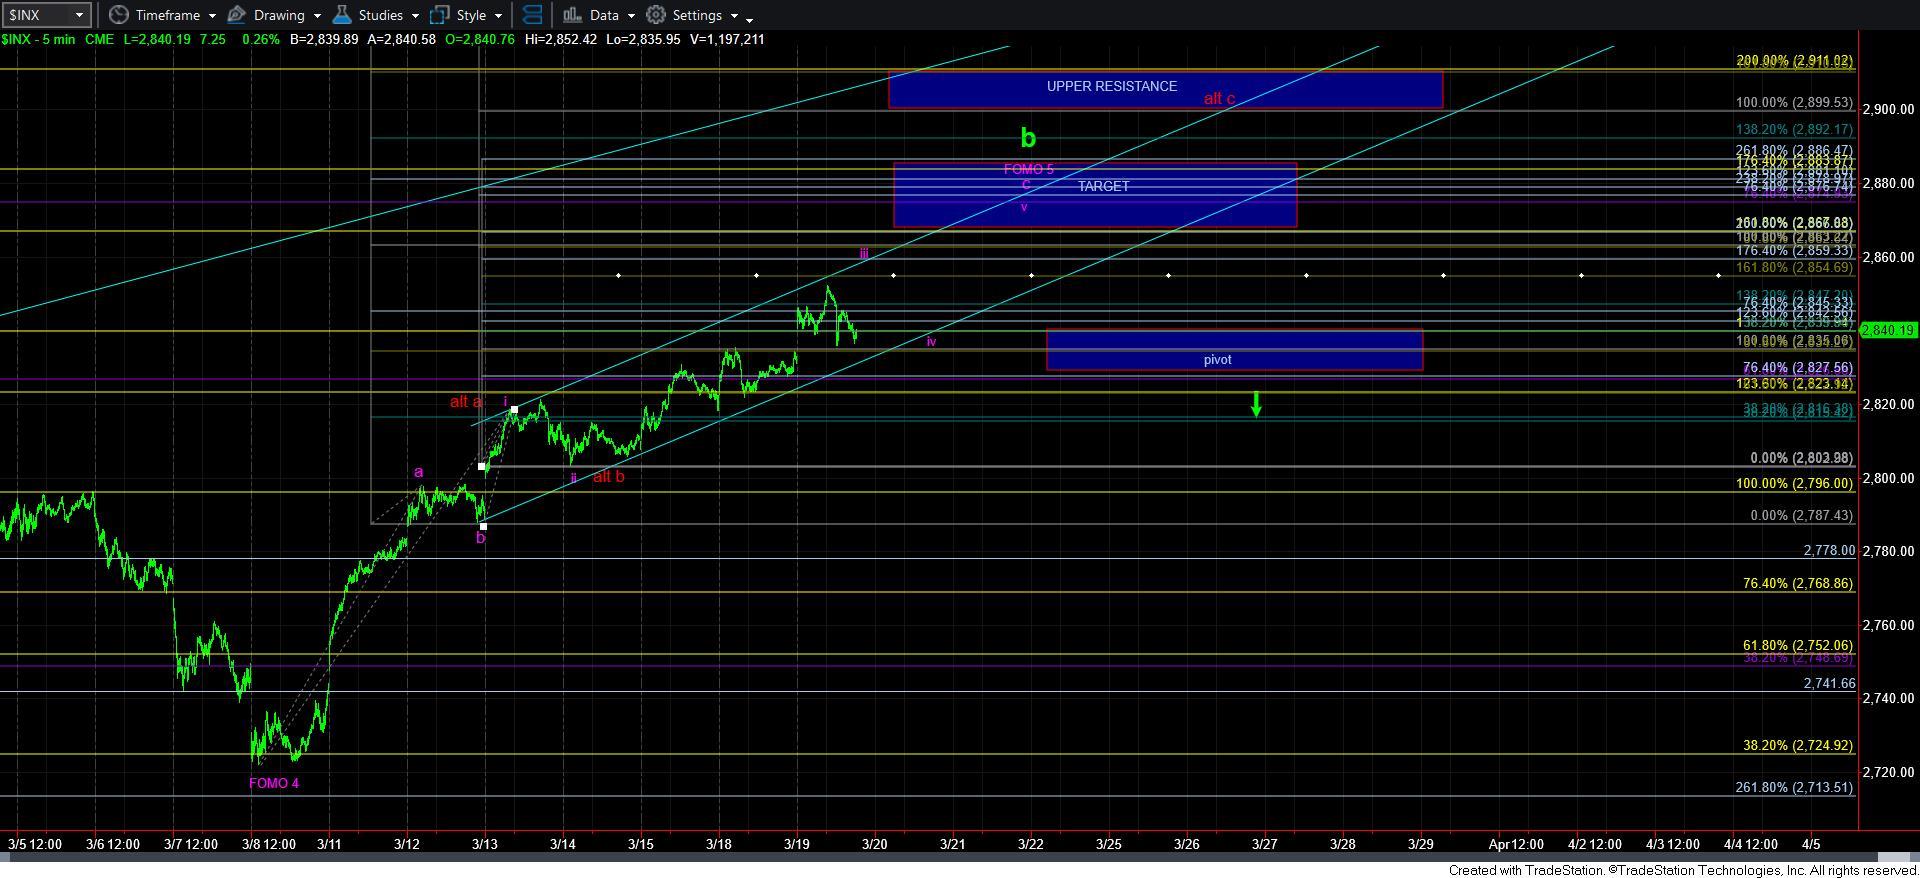
As I noted in the trading chat yesterday, the market was set up at the end of the day to rally to 2850SPX next. And, with today’s high, we met that target. But, the manner in which we topped and turned down hard leaves me questioning whether that was all of wave iii of the c-wave or not. But, I don’t think it matters too much, as once we get to the 2865-75SPX region, we will likely have enough waves in place to consider all of the b-wave to have completed.
In the meantime, I have added some trading cues onto my 5-minute chart. First, our target box remains the same, as it has been sitting there for quite some time, and we seem to be grinding our way towards it. Once we are able to move into that target, then the pivot on the chart will be important. Once we break down that pivot from the target region, we will have our initial indication that the b-wave has topped out.
You can also see an alternative on the chart, which points to the upper resistance now noted on the chart. The reason that is on the chart is because it is unclear where the a-b reside in this rally because there really was no pullback to speak of to be confident in where the b-wave really resides. For now, the purple count is how I have it presented, and I think that is the more likely scenario, which aligns with several other larger degree calculations and overlapping confluence.
For now, support is at 2827-35SPX, with 2815SPX below that. If we were to see a break down below 2815SPX before we are able to climb to the 2860+ region, then that would be the initial indication that a top has been struck. For now, I am still focusing on our target region, which has been sitting there quite lonely for quite some time. But, I expect it will be visited by price action in the near term.