b-Wave Action - Market Analysis for Mar 13th, 2017
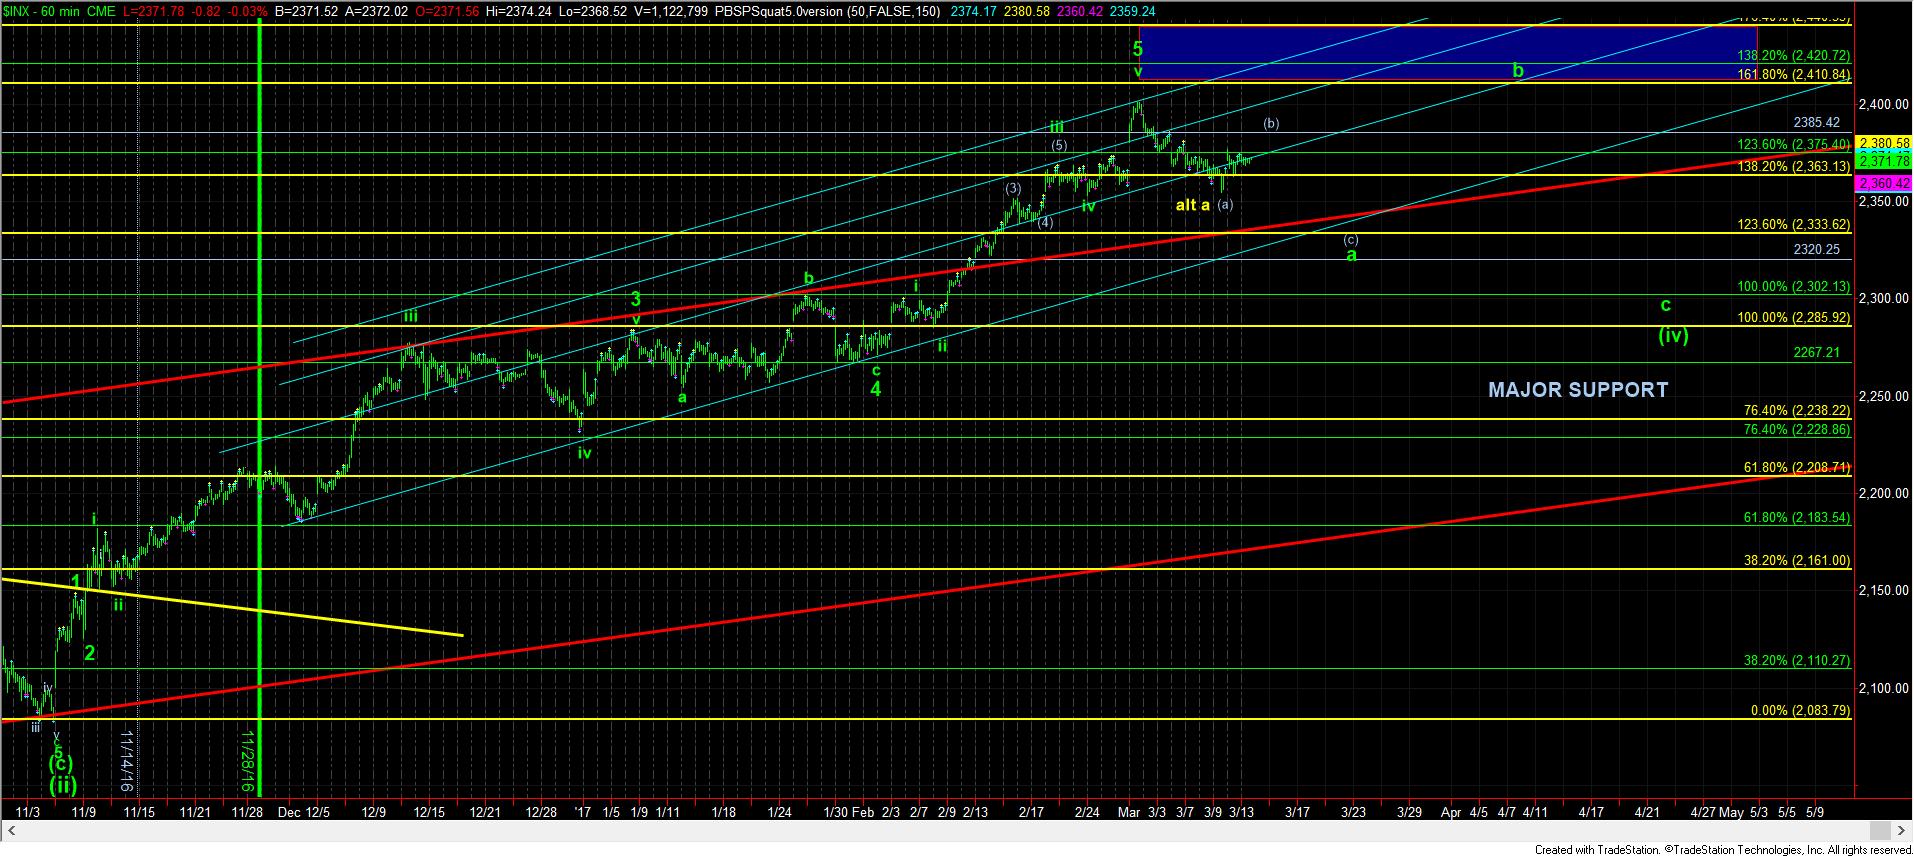
My primary perspective has SPX within a (b) wave rally, with an ideal target region between 2383-94SPX. As long as we hold the last lows as 2363SPX, I am still going to expect that rally to take hold.
Once we get up into that region, it can get a bit more tricky in the short term. Again, our primary expectation is that this will top out a (b) wave in a bigger a-wave of wave (iv), and point us down later this week towards the 2335SPX region.
However, if we are able to break out over 2395SPX, then the alternative pattern becomes more likely, where we can make a higher high in the green b-wave sooner than I had expected, which also means that the a-wave is done, as shown in the yellow count on the 60 minute chart.
Also, if we see a break below 2363SPX, it may mean that we are heading down to the 2335SPX region sooner than later as well. Again, this is the type of thought process in which one must engage within a 4th wave consolidation, as they are truly quite variable in structure.
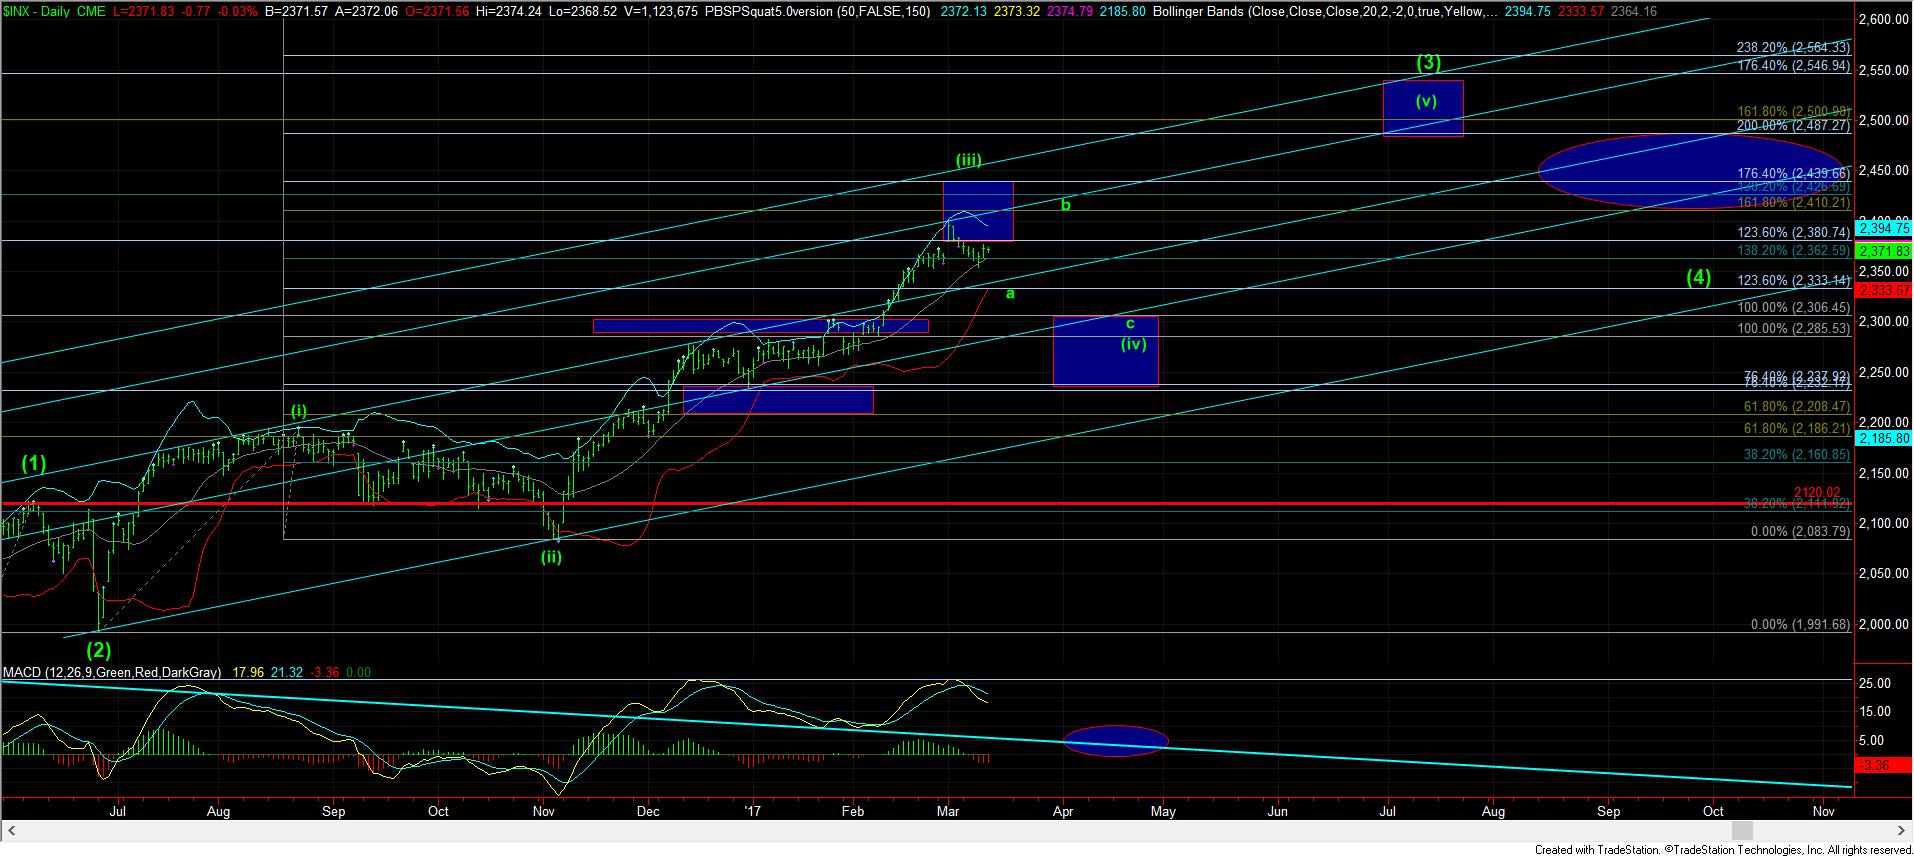
For those with a bit more of a longer term perspective, I am still awaiting more of a pullback in price before the next 200+ point rally can take hold. Moreover, I am also looking for the daily MACD to pullback towards the ellipse on the daily chart. So, I still think this correction can take some more time and provide more whipsaw over the next month or two.