(b) Wave Potential Still Alive
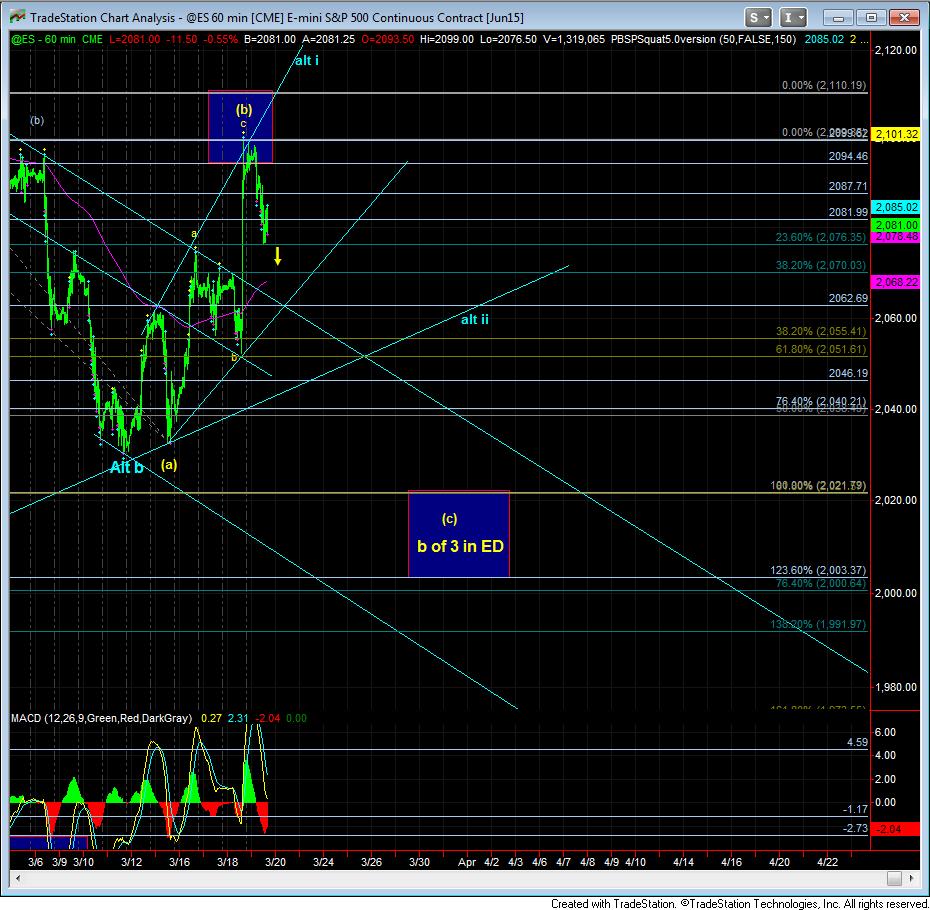
Within a heart of a 3rd wave, the market often targets the 1.00 or 1.236 extension for the iii of 3. And, if we had struck one of those and pulled back correctively today, then I may be a bit more immediately bullish. However, when the market topped at 2099ES, it stopped in between the 1.00 and 1.236 extensions in the recent move higher. Moreover, the 2099ES level has perfect (a)=(c) confluence with the .618 retracement down at 2021ES.
So, when the market does not hit the standard extension for wave iii of 3, but hits a specific level in between, and retreats in that manner, it does not mean that we are absolutely heading down to 2021ES. But, one must take notice of that type of “rhyming” in the market.
Today, we came right down to the support region I noted last night. So far, we have held it. However, should we break down further, the only immediate bullish perspective one can maintain is a leading diagonal for wave i of 3 of the c-wave, noted in the blue count. But, that clearly is not my preference, unless the market is able to exceed the 2110ES region.
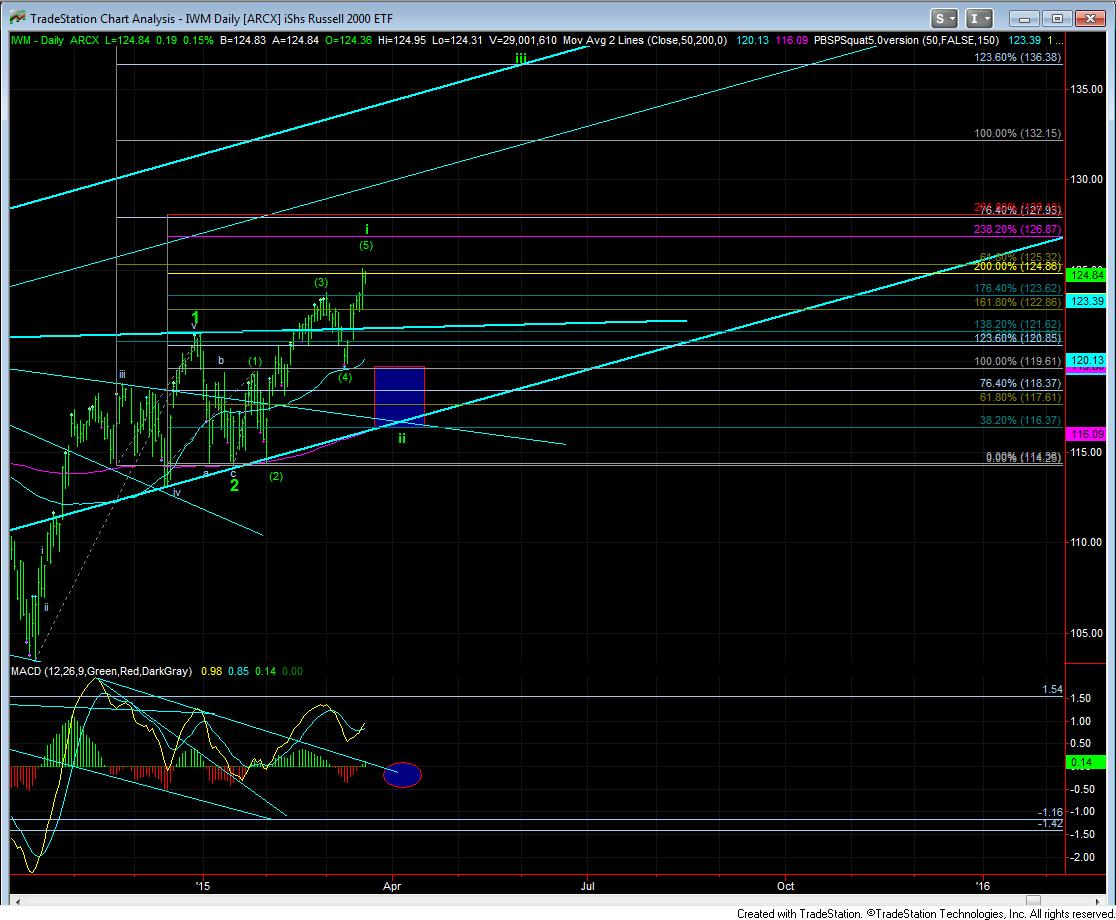
But do take note that even if we do head higher for the alternative count, we will still likely see weakness back into this region for a wave ii. Therefore, I still believe we will see more volatility over the next week or two, without much in the way of upside movement. I still don’t think our real rally begins until April. But, as I said, should IWM explode through the 128 region, then I will be proven wrong. Until such time, I will maintain my perspective that I will be looking to buy the next market weakness seen into the end of the month, or early April.